Analysis Summary
Notes:
- 1) No attempt has been made to eliminate the non-significant decimal places.
- 2) This batgrbproduct analysis is done using the HEASARC data.
- 3) This batgrbproduct analysis is using the flight position for the mask-weighting calculation.
======================================================================
BAT GRB EVENT DATA PROCESSING REPORT
Process Script Ver: batgrbproduct v2.46
Process Start Time: Sun Jan 4 09:28:55 EST 2015
Host Name: bat1
Current Working Dir: /local/data/bat1/alien/Swift_3rdBATcatalog/event/batevent_reproc/trigger622006
======================================================================
Trigger: 00622006 Segment: 000
BAT Trigger Time: 440842043.904 [s; MET]
Trigger Stop: 440842044.928 [s; MET]
UTC: 2014-12-21T08:07:10.958720 [includes UTCF correction]
Where From?: TDRSS position message
BAT
RA: 198.269160599318 Dec: 8.21006046919977 [deg; J2000]
Catalogged Source?: NO
Point Source?: YES
GRB Indicated?: YES [ by BAT flight software ]
Image S/N Ratio: 14.98
Image Trigger?: NO
Rate S/N Ratio: 41.194659848092 [ if not an image trigger ]
Image S/N Ratio: 14.98
Analysis Position: [ source = BAT ]
RA: 198.269160599318 Dec: 8.21006046919977 [deg; J2000]
Refined Position: [ source = BAT pre-slew burst ]
RA: 198.282698999598 Dec: 8.19756201914579 [deg; J2000]
{ 13h 13m 07.8s , +08d 11' 51.2" }
+/- 1.04114929241389 [arcmin] (estimated 90% radius based on SNR)
+/- 0.352935703791261 [arcmin] (formal 1-sigma fit error)
SNR: 28.7144033560413
Angular difference between the analysis and refined position is 1.099438 arcmin
Partial Coding Fraction: 0.7890625 [ including projection effects ]
Duration
T90: 36.8159999847412 +/- 4.1037256240395
Measured from: -21.1520000100136
to: 15.6639999747276 [s; relative to TRIGTIME]
T50: 14.6159999370575 +/- 3.16572897935709
Measured from: -3.9559999704361
to: 10.6599999666214 [s; relative to TRIGTIME]
Fluence
Peak Flux (peak 1 second)
Measured from: -0.0959999561309814
to: 0.904000043869019 [s; relative to TRIGTIME]
Total Fluence
Measured from: -24.1119999885559
to: 20.3320000171661 [s; relative to TRIGTIME]
Band 1 Band 2 Band 3 Band 4
15-25 25-50 50-100 100-350 keV
Total 1.107679 1.428700 0.861426 0.228633
0.050427 0.052709 0.046044 0.039067 [error]
Peak 0.082249 0.138096 0.132562 0.047500
0.008925 0.010122 0.009479 0.007443 [error]
[ fluence units of on-axis counts / fully illuminated detector ]
======================================================================
====== Table of the duration information =============================
Value tstart tstop
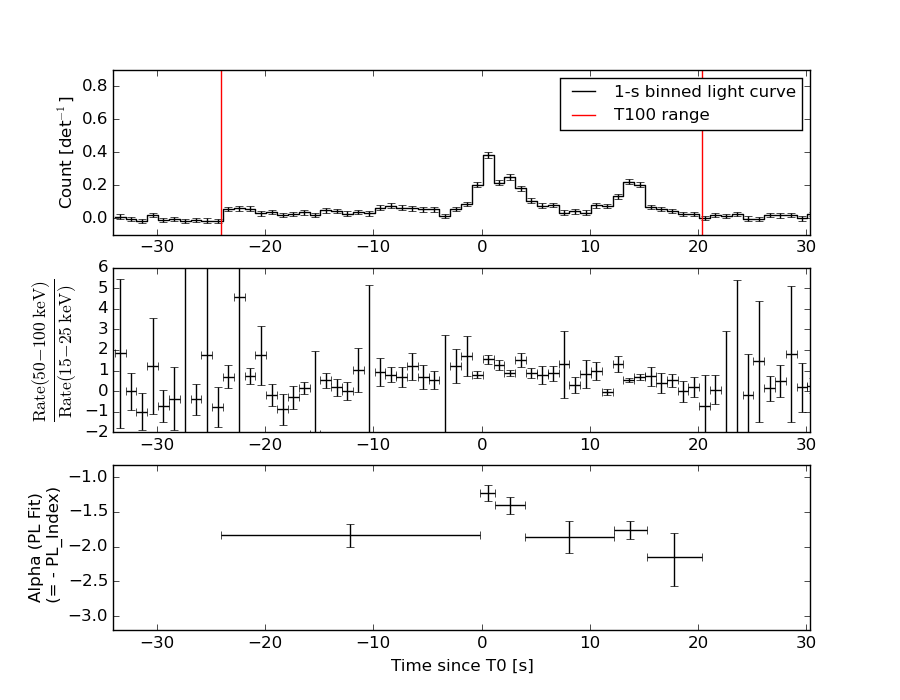
T100 44.444 -24.112 20.332
T90 36.816 -21.152 15.664
T50 14.616 -3.956 10.660
Peak 1.000 -0.096 0.904
====== Spectral Analysis Summary =====================================
Model : spectral model: simple power-law (PL) and cutoff power-law (CPL)
Ph_index : photon index: E^{Ph_index}
Ph_90err : 90% error of the photon index
Epeak : Epeak in keV
Epeak_90err: 90% error of Epeak
Norm : normalization at 50 keV in both the PL model and CPL model
Nomr_90err : 90% error of the normalization
chi2 : Chi-Squared
dof : degree of freedo
=== Time-averaged spectral analysis ===
(Best model with acceptable fit: N/A)
Model Ph_index Ph_90err_low Ph_90err_hi Epeak Epeak_90err_low Epeak_90err_hi Norm Nomr_90err_low Norm_90err_hi chi2 dof
PL -1.736 -0.084 0.083 - - - 5.15e-03 -2.50e-04 2.49e-04 73.000 57
CPL -1.256 -0.352 0.385 72.839 -14.425 67.581 9.20e-03 -3.13e-03 5.36e-03 67.420 56
=== 1-s peak spectral analysis ===
(Best model with acceptable fit: PL)
Model Ph_index Ph_90err_low Ph_90err_hi Epeak Epeak_90err_low Epeak_90err_hi Norm Nomr_90err_low Norm_90err_hi chi2 dof
PL -1.131 -0.134 0.136 - - - 2.63e-02 -1.99e-03 1.99e-03 63.120 57
CPL -1.080 -0.174 0.528 979.872 -979.872 -979.872 2.78e-02 -3.22e-03 2.10e-02 63.130 56
=== Fluence/Peak Flux Summary ===
Model Band1 Band2 Band3 Band4 Band5 Total
15-25 25-50 50-100 100-350 15-150 15-350 keV
Fluence PL 3.65e-07 5.80e-07 6.97e-07 1.63e-06 2.11e-06 3.28e-06 erg/cm2
90%_error_low -2.74e-08 -2.69e-08 -4.57e-08 -2.16e-07 -1.07e-07 -2.56e-07 erg/cm2
90%_error_hi 2.80e-08 2.68e-08 4.58e-08 2.37e-07 1.07e-07 2.73e-07 erg/cm2
Peak flux PL 7.59e-01 9.53e-01 8.70e-01 1.39e+00 3.06e+00 3.97e+00 ph/cm2/s
90%_error_low -1.12e-01 -8.70e-02 -7.62e-02 -2.45e-01 -2.38e-01 -3.24e-01 ph/cm2/s
90%_error_hi 1.17e-01 8.59e-02 7.56e-02 2.78e-01 2.38e-01 3.31e-01 ph/cm2/s
Fluence CPL 3.39e-07 6.09e-07 7.03e-07 7.85e-07 2.02e-06 2.44e-06 erg/cm2
90%_error_low -3.28e-08 -3.37e-08 -4.90e-08 -3.01e-07 -1.26e-07 -3.28e-07 erg/cm2
90%_error_hi 3.32e-08 3.43e-08 4.91e-08 5.33e-07 1.26e-07 5.41e-07 erg/cm2
Peak flux CPL 7.52e-01 9.59e-01 8.71e-01 1.38e+00 3.05e+00 3.89e+00 ph/cm2/s
90%_error_low -1.35e-01 -9.23e-02 -7.55e-02 -6.43e-01 -2.51e-01 -6.18e-01 ph/cm2/s
90%_error_hi 1.02e-01 9.29e-02 9.32e-02 1.60e-01 2.44e-01 3.88e-01 ph/cm2/s
======================================================================
Image
Pre-slew 15.0-350.0 keV image (Event data)

#   RAcent    DECcent   POSerr    Theta     Phi              Peak Cts       SNR   Name
  198.2827     8.1976   0.0067    26.1407    16.5987         3.5298217     28.714 TRIG_00622006

Foreground time interval of the image:
-24.112  16.397 (delta_t =  40.509 [sec])
Background time interval of the image:
-66.603 -24.112 (delta_t =  42.491 [sec])
Light Curves
Note: The mask-weighted lightcurves have units of either count/det or counts/sec/det, where a det is 0.4 x 0.4 = 0.16 sq cm.
Full-time range; 1 s binning
Other quick-look light curves:
- 64 ms binning (zoomed)
- 16 ms binning (zoomed)
- 8 ms binning (zoomed)
- 2 ms binning (zoomed)
- SN=5 or 10 s binning (full-time range)
- Raw light curve
Spectra
- 64 ms binning (zoomed)
- 16 ms binning (zoomed)
- 8 ms binning (zoomed)
- 2 ms binning (zoomed)
- SN=5 or 10 s binning (full-time range)
- Raw light curve
Spectra
Notes:
- 1) The fitting includes the systematic errors.
- 2) When the burst includes telescope slew time periods, the fitting uses an average response file made from multiple 5-s response files through out the slew time plus single time preiod for the non-slew times, and weighted by the total counts in the corresponding time period using addrmf. An average response file is needed becuase a spectral fit using the pre-slew DRM will introduce some errors in both a spectral shape and a normalization if the PHA file contains a lot of the slew/post-slew time interval.
- 3) For fits to more complicated models (e.g. a power-law over a cutoff power-law), the BAT team has decided to require a chi-square improvement of more than 6 for each extra dof.
Time averaged spectrum fit using the average DRM
Power-law model
Time interval is from  -24.112 sec. to   20.332 sec.

Spectral model in power-law:
------------------------------------------------------------
Parameters  : value       lower 90%   higher 90%
Photon index: -1.7362     ( -0.0842692   0.0833918 )
Norm@50keV  : 5.14748E-03    ( -0.000250348   0.000249051 )
------------------------------------------------------------
#Fit statistic : Chi-Squared =          73.00 using 59 PHA bins.
# Reduced chi-squared =          1.281 for     57 degrees of freedom
# Null hypothesis probability =   7.509017e-02

Photon flux (15-150 keV)    in 44.44 sec: 0.692551 ( -0.032416  0.032467 ) ph/cm2/s
Energy fluence (15-150 keV)             : 2.11288e-06 ( -1.06724e-07  1.07332e-07 ) ergs/cm2
Cutoff power-law model
Time interval is from  -24.112 sec. to   20.332 sec.
Spectral model in the cutoff power-law:
------------------------------------------------------------
Parameters  : value       lower 90%   higher 90%
Photon index: -1.25574     ( -0.351691   0.385008 )
Epeak [keV] : 72.8390      ( -14.4244 67.5812 )
Norm@50keV  : 9.20353E-03    ( -0.00312842   0.00536033 )
------------------------------------------------------------
#Fit statistic : Chi-Squared =          67.42 using 59 PHA bins.
# Reduced chi-squared =          1.204 for     56 degrees of freedom
# Null hypothesis probability =   1.411597e-01

Photon flux (15-150 keV)    in 44.44 sec: 0.673927 ( -0.035061  0.035041 ) ph/cm2/s
Energy fluence (15-150 keV)             : 2.0189e-06 ( -1.26012e-07  1.26434e-07 ) ergs/cm2
1-s peak spectrum fit
Power-law model
Time interval is from   -0.096 sec. to    0.904 sec.

Spectral model in power-law:
------------------------------------------------------------
Parameters  : value       lower 90%   higher 90%
Photon index: -1.13067     ( -0.133737   0.135538 )
Norm@50keV  : 2.62627E-02    ( -0.00199174   0.00199132 )
------------------------------------------------------------
#Fit statistic : Chi-Squared =          63.12 using 59 PHA bins.
# Reduced chi-squared =          1.107 for     57 degrees of freedom
# Null hypothesis probability =   2.689130e-01

Photon flux (15-150 keV)    in 1 sec: 3.05599 ( -0.23755  0.23793 ) ph/cm2/s
Energy fluence (15-150 keV)             : 2.71982e-07 ( -2.30332e-08  2.31933e-08 ) ergs/cm2
Cutoff power-law model
Time interval is from   -0.096 sec. to    0.904 sec.
Spectral model in the cutoff power-law:
------------------------------------------------------------
Parameters  : value       lower 90%   higher 90%
Photon index: -1.07996     ( -0.173557   0.528056 )
Epeak [keV] : 979.872      ( -990.098 -990.098 )
Norm@50keV  : 2.77736E-02    ( -0.00319263   0.0210254 )
------------------------------------------------------------
#Fit statistic : Chi-Squared =          63.13 using 59 PHA bins.
# Reduced chi-squared =          1.127 for     56 degrees of freedom
# Null hypothesis probability =   2.391120e-01

Photon flux (15-150 keV)    in 1 sec: 3.05396 ( -0.25055  0.24392 ) ph/cm2/s
Energy fluence (15-150 keV)             : 2.71063e-07 ( -2.45102e-08  2.39424e-08 ) ergs/cm2
Time-resolved spectra
Distribution
T90 vs. Hardness ratio plot
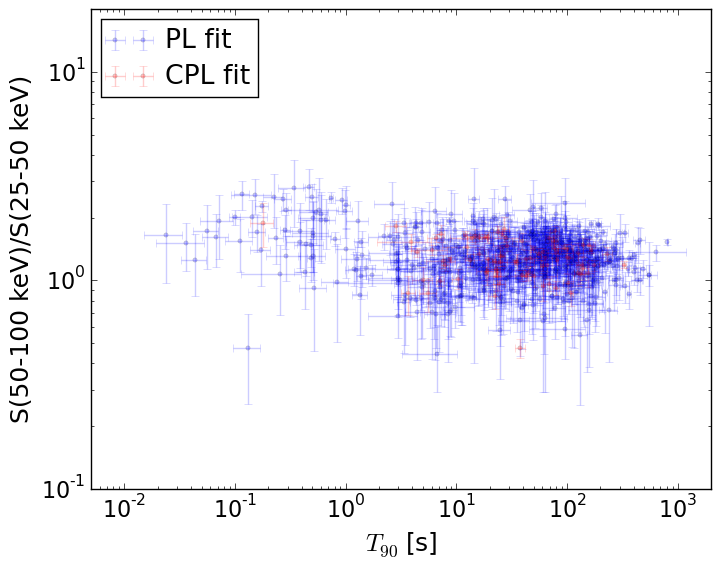
T90                                   = N/A sec.
Hardness ratio (energy fluence ratio) = N/A
S(15-50 keV) vs. S(50-150 keV) plot
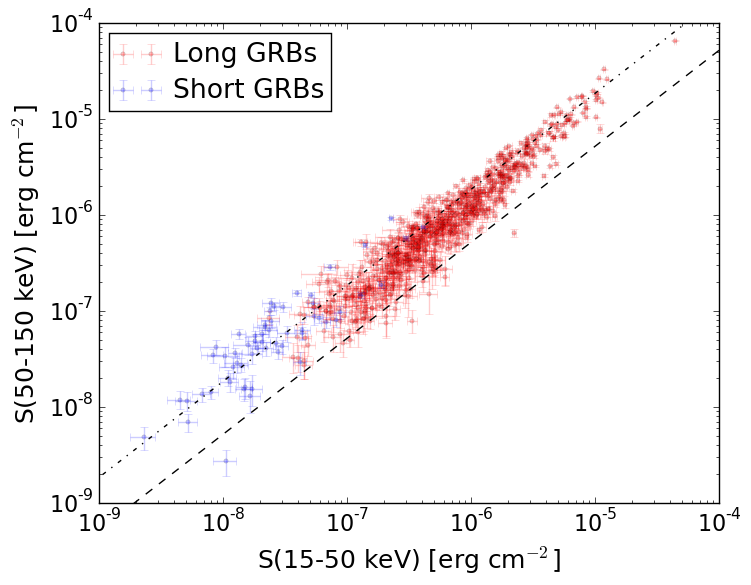
S(15-50 keV)  = N/A
S(50-150 keV) = N/A
The dash-dotted line and the dashed line traces the fluences calculated from the Band function with Epeak = 15 and 150 keV, respectively. Both lines assume a canonical values of alpha = -1 and beta = -2.5.
Mask shadow pattern
IMX = 4.703254137966747E-01, IMY = -1.401982135373573E-01
Spacecraft aspect plot
Bright source in the pre-burst/pre-slew/post-slew images
Pre-burst image of 15-350 keV band
Time interval of the image:
-66.603390 -24.112000

# RAcent  DECcent POSerr Theta    Phi  PeakCts   SNR AngSep     Name
#  [deg]    [deg]    ['] [deg]  [deg]                   [']
254.3701  35.2671    6.6  31.8 -154.8   0.1631   1.8    6.2	Her X-1
185.8414 -15.0699    2.5  51.6    5.5   1.0511   4.5 ------	UNKNOWN
234.5494 -18.3945    2.3  45.7  -57.7   1.8838   5.0 ------	UNKNOWN
Pre-slew background subtracted image of 15-350 keV band
Time interval of the image:
-24.112000 16.396600

# RAcent  DECcent POSerr Theta    Phi  PeakCts   SNR AngSep     Name
#  [deg]    [deg]    ['] [deg]  [deg]                   [']
254.5156  35.5474    0.0  32.0 -155.2   0.2154   1.7   12.6	Her X-1
192.0431  46.0526    2.0  30.4  103.6   1.1430   5.6 ------	UNKNOWN
200.8048  52.9555    2.3  31.4  121.0   0.9856   5.0 ------	UNKNOWN
198.2827   8.1976    0.4  26.1   16.6   3.5299  28.7 ------	UNKNOWN
230.4463 -18.4867    2.2  44.7  -52.4   1.8756   5.2 ------	UNKNOWN
Post-slew image of 15-350 keV band
Time interval of the image:
63.596600 645.396610

# RAcent  DECcent POSerr Theta    Phi  PeakCts   SNR AngSep     Name
#  [deg]    [deg]    ['] [deg]  [deg]                   [']
254.4906  35.3580    8.3  57.9 -153.4   4.2442   1.4    1.9	Her X-1
232.6970  55.0447    4.1  54.2  177.0   5.3318   2.8 ------	UNKNOWN
196.0271   0.3009    3.4   8.2  -10.5   1.6334   3.5 ------	UNKNOWN
220.9423  20.5538    2.8  25.1 -148.4   2.0201   4.1 ------	UNKNOWN
251.3387  46.0373    2.7  59.0 -166.1  13.1148   4.3 ------	UNKNOWN
253.6401  38.2412    3.7  58.0 -156.8   9.9217   3.2 ------	UNKNOWN
197.4255 -50.5353    5.2  58.7  -25.9   7.2810   2.2 ------	UNKNOWN
209.2816 -45.2009    2.6  54.3  -36.0  12.7612   4.5 ------	UNKNOWN
244.1125   9.2356    3.7  45.3 -121.4   5.8572   3.1 ------	UNKNOWN
246.8965  14.8077    3.5  48.0 -129.1   8.1050   3.3 ------	UNKNOWN