Analysis Summary
Notes:
- 1) No attempt has been made to eliminate the non-significant decimal places.
- 2) This batgrbproduct analysis is done using the HEASARC data.
- 3) This batgrbproduct analysis is using the flight position for the mask-weighting calculation.
======================================================================
                  BAT GRB EVENT DATA PROCESSING REPORT
    Process Script Ver: batgrbproduct v2.46
    Process Start Time: Mon Jan 26 10:57:56 EST 2015
             Host Name: bat1
   Current Working Dir: /local/data/bat1/alien/Swift_3rdBATcatalog/event/batevent_reproc/trigger622476
======================================================================

  Trigger: 00622476      Segment: 000

  BAT Trigger Time: 441241280   [s; MET]
      Trigger Stop: 441241360   [s; MET]
               UTC: 2014-12-25T23:01:07.034720    [includes UTCF correction]
       Where From?: TDRSS position message

  BAT
    RA: 138.750633927598   Dec: 33.7947041860652  [deg; J2000]

     Catalogged Source?: NO
     Point Source?:      YES
     GRB Indicated?:     YES    [ by BAT flight software ]
     Image S/N Ratio:    8.93
     Image Trigger?:     YES
     Rate S/N Ratio:     0  [ if not an image trigger ]
     Image S/N Ratio:    8.93

  Analysis Position:   [ source = BAT ]
    RA: 138.750633927598   Dec: 33.7947041860652  [deg; J2000]

  Refined Position:   [ source = BAT pre-slew burst ]
    RA: 138.751   Dec: 33.7947  [deg; J2000]
        { 09h 15m 00.2s , +33d 47' 40.9" }
        +/- 2.27447699607 [arcmin] (estimated 90% radius based on SNR)
    SNR: 9.40468846122


  Angular difference between the analysis and refined position is 0.018255 arcmin

  Partial Coding Fraction: 0.2617188    [ including projection effects ]

  Duration
     T90: 86.1479999423027 +/- 45.2225830681134
        Measured from: 6.66799998283386
                   to: 92.8159999251366     [s; relative to TRIGTIME]
     T50: 15.9599999189377 +/- 10.2614862607458
        Measured from: 12.3240000009537
                   to: 28.2839999198914     [s; relative to TRIGTIME]


  Fluence
     Peak Flux  (peak 1 second)
        Measured from: 11.7519999742508
                   to: 12.7519999742508     [s; relative to TRIGTIME]
     Total Fluence
        Measured from: 5.43199998140335
                   to: 130.283999979496     [s; relative to TRIGTIME]

             Band 1     Band 2     Band 3     Band 4
              15-25      25-50     50-100    100-350     keV
 Total     0.669640   1.475394   1.158678   0.587153
           0.162771   0.168656   0.145375   0.123703 [error]
 Peak      0.023106   0.064214   0.077227   0.040101
           0.015611   0.016292   0.014907   0.012189 [error]

     [ fluence units of on-axis counts / fully illuminated detector ]

======================================================================


====== Table of the duration information =============================

        Value   tstart    tstop
T100  124.852    5.432  130.284
T90    86.148    6.668   92.816
T50    15.960   12.324   28.284
Peak    1.000   11.752   12.752


====== Spectral Analysis Summary =====================================

Model      : spectral model: simple power-law (PL) and cutoff power-law (CPL)
Ph_index   : photon index: E^{Ph_index}
Ph_90err   : 90% error of the photon index
Epeak      : Epeak in keV
Epeak_90err: 90% error of Epeak
Norm       : normalization at 50 keV in both the PL model and CPL model
Nomr_90err : 90% error of the normalization
chi2       : Chi-Squared
dof        : degree of freedo

=== Time-averaged spectral analysis ===
(Best model with acceptable fit: PL)

Model Ph_index Ph_90err_low Ph_90err_hi  Epeak  Epeak_90err_low  Epeak_90err_hi  Norm       Nomr_90err_low    Norm_90err_hi    chi2    dof
PL      -1.268    -0.210      0.218       -           -               -         2.26e-03     -2.76e-04          2.75e-04      64.720   57
CPL     -1.230    -2.567      0.673      999.974    -999.974      -999.974      2.37e-03     -3.74e-04          1.74e-04      64.800   56


=== 1-s peak spectral analysis ===
(Best model with acceptable fit: PL)

Model Ph_index Ph_90err_low Ph_90err_hi  Epeak  Epeak_90err_low  Epeak_90err_hi  Norm       Nomr_90err_low    Norm_90err_hi    chi2    dof
PL      -0.853     -0.481     0.578       -           -               -         1.17e-02     -3.92e-03          3.54e-03      50.990   57
CPL     -0.848     -0.482     0.674     9999.320    -9999.320      -9999.320      1.18e-02     -3.68e-03          2.45e-02      51.000   56


=== Fluence/Peak Flux Summary ===

              Model    Band1     Band2     Band3     Band4     Band5     Total
                       15-25     25-50    50-100    100-350    15-150    15-350    keV
Fluence         PL   2.90e-07  6.15e-07  1.02e-06  3.85e-06  2.81e-06  5.78e-06   erg/cm2
      90%_error_low -6.99e-08 -9.33e-08 -1.36e-07 -1.05e-06 -3.47e-07 -1.13e-06   erg/cm2
      90%_error_hi   7.55e-08  9.11e-08  1.34e-07  1.30e-06  3.48e-07  1.33e-06   erg/cm2
Peak flux       PL   2.61e-01  3.87e-01  4.29e-01  8.95e-01  1.35e+00  1.97e+00   ph/cm2/s
      90%_error_low -1.56e-01 -1.69e-01 -1.07e-01 -4.08e-01 -4.09e-01 -5.00e-01   ph/cm2/s
      90%_error_hi   2.12e-01  1.67e-01  1.07e-01  6.14e-01  4.22e-01  5.17e-01   ph/cm2/s

Fluence        CPL   2.90e-07  6.13e-07  1.02e-06  3.83e-06  2.82e-06  5.82e-06   erg/cm2
      90%_error_low    N/A       N/A       N/A       N/A       N/A    -2.29e-06   erg/cm2
      90%_error_hi     N/A       N/A       N/A       N/A       N/A     5.81e-07   erg/cm2
Peak flux      CPL   2.80e-01  3.94e-01  4.26e-01  9.80e-01  1.35e+00  1.98e+00   ph/cm2/s
      90%_error_low     N/A       N/A   -1.04e-01 -9.80e-01 -4.10e-01 -1.98e+00   ph/cm2/s
      90%_error_hi      N/A       N/A    1.24e-01  3.66e+00  4.20e-01  4.98e-01   ph/cm2/s

======================================================================
Image
Pre-slew 15.0-50.0 keV image (Event data)
#RAcent DECcent POSerr Theta  Phi  Peak_Cts  SNR Name
138.751 33.795 0.000 47.667 177.605 2.144 9.405 TRIG_00622476

Image time interval: 0.000 to 80.000 [sec]
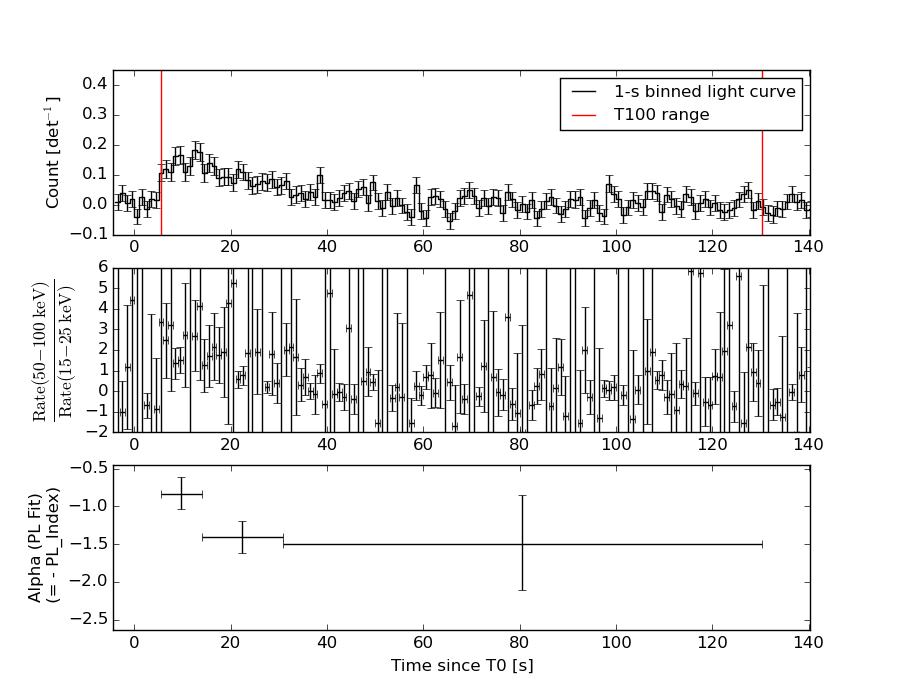
Light Curves
Note: The mask-weighted lightcurves have units of either count/det or counts/sec/det, where a det is 0.4 x 0.4 = 0.16 sq cm.
Full-time range; 1 s binning
Other quick-look light curves:
Spectra
Notes:
- 1) The fitting includes the systematic errors.
- 2) When the burst includes telescope slew time periods, the fitting uses an average response file made from multiple 5-s response files through out the slew time plus single time preiod for the non-slew times, and weighted by the total counts in the corresponding time period using addrmf. An average response file is needed becuase a spectral fit using the pre-slew DRM will introduce some errors in both a spectral shape and a normalization if the PHA file contains a lot of the slew/post-slew time interval.
- 3) For fits to more complicated models (e.g. a power-law over a cutoff power-law), the BAT team has decided to require a chi-square improvement of more than 6 for each extra dof.
Time averaged spectrum fit using the average DRM
Power-law model

Time interval is from    5.432 sec. to  130.284 sec.

Spectral model in power-law:
------------------------------------------------------------
Parameters  : value       lower 90%   higher 90%
Photon index: -1.26787     ( -0.209529   0.217572 )
Norm@50keV  : 2.26080E-03    ( -0.000276093   0.000274706 )
------------------------------------------------------------
#Fit statistic : Chi-Squared =          64.72 using 59 PHA bins.
# Reduced chi-squared =          1.135 for     57 degrees of freedom
# Null hypothesis probability =   2.253132e-01

Photon flux (15-150 keV)    in 124.9 sec: 0.268191 ( -0.035632  0.035879 ) ph/cm2/s
Energy fluence (15-150 keV)             : 2.81321e-06 ( -3.47327e-07  3.4792e-07 ) ergs/cm2
Cutoff power-law model
Time interval is from    5.432 sec. to  130.284 sec.
Spectral model in the cutoff power-law:
------------------------------------------------------------
Parameters  : value       lower 90%   higher 90%
Photon index: -1.26387     ( -2.56716   0.672569 )
Epeak [keV] : 1.00000E+04      ( -10000 -10000 )
Norm@50keV  : 2.27082E-03    ( -0.000276729   0.000271483 )
------------------------------------------------------------
#Fit statistic : Chi-Squared =          64.72 using 59 PHA bins.
# Reduced chi-squared =          1.156 for     56 degrees of freedom
# Null hypothesis probability =   1.984033e-01

Photon flux (15-150 keV)    in 124.9 sec: 0.268785 ( -0.037638  0.036631 ) ph/cm2/s
Energy fluence (15-150 keV)             : 2.81774e-06 ( 0  0 ) ergs/cm2
1-s peak spectrum fit
Power-law model
Time interval is from   11.752 sec. to   12.752 sec.

Spectral model in power-law:
------------------------------------------------------------
Parameters  : value       lower 90%   higher 90%
Photon index: -0.852884     ( -0.481055   0.578361 )
Norm@50keV  : 1.17459E-02    ( -0.00392367   0.00354011 )
------------------------------------------------------------
#Fit statistic : Chi-Squared =          50.99 using 59 PHA bins.
# Reduced chi-squared =         0.8945 for     57 degrees of freedom
# Null hypothesis probability =   6.989638e-01

Photon flux (15-150 keV)    in 1 sec: 1.34825 ( -0.408935  0.42154 ) ph/cm2/s
Energy fluence (15-150 keV)             : 1.34317e-07 ( -3.35682e-08  3.35016e-08 ) ergs/cm2
Cutoff power-law model
Time interval is from   11.752 sec. to   12.752 sec.
Spectral model in the cutoff power-law:
------------------------------------------------------------
Parameters  : value       lower 90%   higher 90%
Photon index: -0.848092     ( -0.482396   0.673746 )
Epeak [keV] : 9999.32      ( -9999.36 -9999.36 )
Norm@50keV  : 1.18366E-02    ( -0.00367771   0.0245333 )
------------------------------------------------------------
#Fit statistic : Chi-Squared =          51.00 using 59 PHA bins.
# Reduced chi-squared =         0.9106 for     56 degrees of freedom
# Null hypothesis probability =   6.643142e-01

Photon flux (15-150 keV)    in 1 sec: 1.34912 ( -0.410324  0.42041 ) ph/cm2/s
Energy fluence (15-150 keV)             : 1.34215e-07 ( -4.15598e-08  4.17312e-08 ) ergs/cm2
Time-resolved spectra
Distribution
T90 vs. Hardness ratio plot
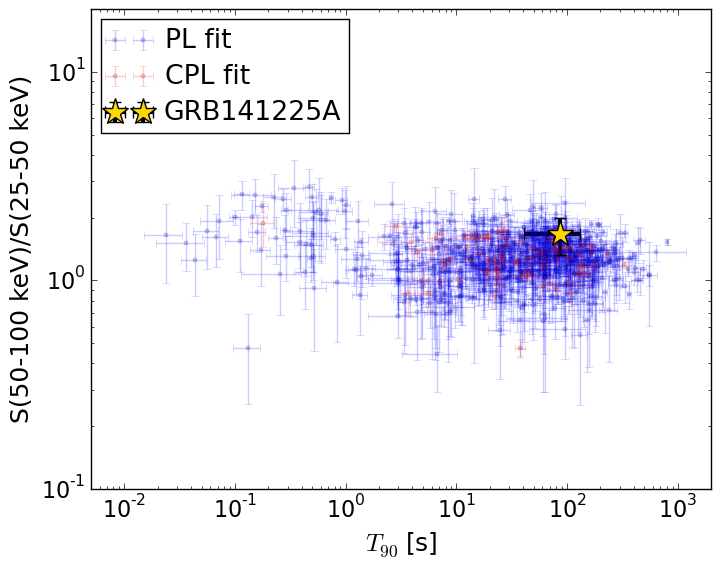
T90                                   = 86.148 sec.
Hardness ratio (energy fluence ratio) = 1.66111658872
S(15-50 keV) vs. S(50-150 keV) plot
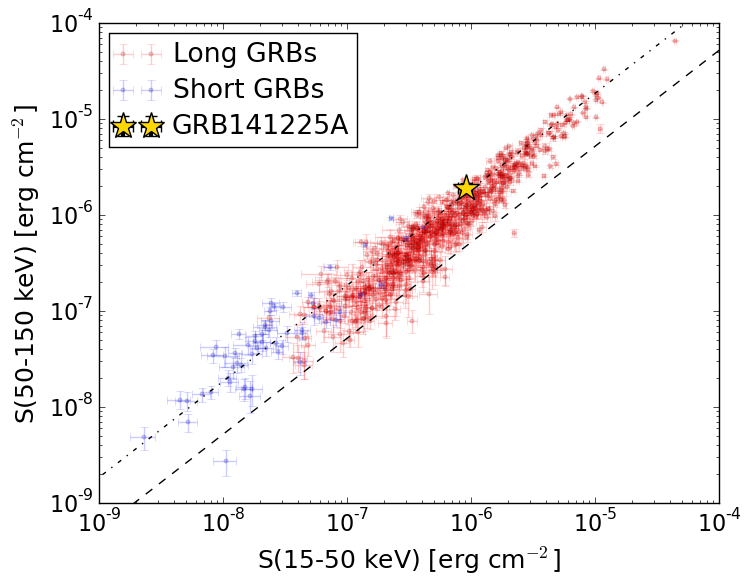
S(15-50 keV)  = 9.050296e-07
S(50-150 keV) = 1.9081731e-06
The dash-dotted line and the dashed line traces the fluences calculated from the Band function with Epeak = 15 and 150 keV, respectively. Both lines assume a canonical values of alpha = -1 and beta = -2.5.
Mask shadow pattern
IMX = -1.0967747846, IMY = -0.0458682636365
Spacecraft aspect plot
Bright source in the pre-burst/pre-slew/post-slew images
Pre-burst image of 15-350 keV band
Time interval of the image:
-15.699410 5.432000

# RAcent  DECcent POSerr Theta    Phi  PeakCts   SNR AngSep     Name
#  [deg]    [deg]    ['] [deg]  [deg]                   [']
 83.6644  22.0292    0.9  16.4   88.6   0.8499  13.3    1.9	Crab
101.1224  29.8462    2.5  21.7  141.9   0.2946   4.7 ------	UNKNOWN
 60.8816  -0.9467    2.4  34.7   20.5   0.3792   4.7 ------	UNKNOWN
 92.3813  18.8029    2.5   9.8  115.2   0.2664   4.5 ------	UNKNOWN
110.7411   9.3446    2.1  16.3 -146.5   0.2891   5.3 ------	UNKNOWN
Pre-slew background subtracted image of 15-350 keV band
Time interval of the image:
5.000000 50.000000

# RAcent  DECcent POSerr Theta    Phi  PeakCts   SNR AngSep     Name
#  [deg]    [deg]    ['] [deg]  [deg]                   [']
 83.8551  21.9865    0.0  16.3   89.0  -0.4061  -2.5   12.5	Crab
138.7590  33.7759    1.1  47.7  177.6   3.2131  10.2 ------	UNKNOWN
119.9310 -23.0162    2.1  40.8  -92.0   3.1327   5.4 ------	UNKNOWN
Post-slew image of 15-350 keV band
Time interval of the image:
405.600600 963.014700

# RAcent  DECcent POSerr Theta    Phi  PeakCts   SNR AngSep     Name
#  [deg]    [deg]    ['] [deg]  [deg]                   [']
128.1688 -10.4859    2.9  45.4   18.1   3.5153   3.9 ------	UNKNOWN
177.5889  82.6201    3.2  50.7 -170.7   3.8271   3.6 ------	UNKNOWN
160.8728 -17.4091    3.0  55.3  -22.5   5.6844   3.9 ------	UNKNOWN
228.6463  73.2451    4.7  57.8 -156.7   7.4169   2.5 ------	UNKNOWN
229.2524  73.3347    3.7  58.0 -156.9  10.6539   3.6 ------	UNKNOWN
180.9532  19.4796    2.7  40.0  -76.7   6.8764   4.3 ------	UNKNOWN
178.3298   7.6100    3.6  44.8  -60.2   6.7637   3.2 ------	UNKNOWN
197.1276  46.6697    3.4  45.3 -121.4   6.3513   3.5 ------	UNKNOWN