Analysis Summary
Notes:
- 1) No attempt has been made to eliminate the non-significant decimal places.
- 2) This batgrbproduct analysis is done using the HEASARC data.
- 3) This batgrbproduct analysis is using the flight position for the mask-weighting calculation.
======================================================================
                  BAT GRB EVENT DATA PROCESSING REPORT
    Process Script Ver: batgrbproduct v2.46
    Process Start Time: Mon Jan 26 10:56:01 EST 2015
             Host Name: bat1
   Current Working Dir: /local/data/bat1/alien/Swift_3rdBATcatalog/event/batevent_reproc/trigger623158
======================================================================

  Trigger: 00623158      Segment: 000

  BAT Trigger Time: 441786546.692   [s; MET]
      Trigger Stop: 441786546.756   [s; MET]
               UTC: 2015-01-01T06:28:53.699400    [includes UTCF correction]
       Where From?: (*SHORT BURST*) TDRSS scaled map message

  BAT
    RA: 312.631006525829   Dec: 36.727689408524  [deg; J2000]

     Catalogged Source?: NO
     Point Source?:      YES
     GRB Indicated?:     YES    [ by BAT flight software ]
     Image S/N Ratio:    7.46
     Image Trigger?:     NO
     Rate S/N Ratio:     19.4422220952236  [ if not an image trigger ]
     Image S/N Ratio:    7.46

  Analysis Position:   [ source = BAT ]
    RA: 312.631006525829   Dec: 36.727689408524  [deg; J2000]

  Refined Position:   [ source = BAT pre-slew burst ]
    RA: 312.589429830046   Dec: 36.6686981122609  [deg; J2000]
        { 20h 50m 21.5s , +36d 40' 07.3" }
         +/- 2.43699652265558 [arcmin] (estimated 90% radius based on SNR)
         +/- 1.534244329743 [arcmin] (formal 1-sigma fit error)
    SNR: 8.52056726461872

  Angular difference between the analysis and refined position is 4.065530 arcmin

  Partial Coding Fraction: 0.9140625    [ including projection effects ]

  Duration
     T90: 0.059999942779541 +/- 0.0113137314268704
        Measured from: 0.00400000810623169
                   to: 0.0639999508857727     [s; relative to TRIGTIME]
     T50: 0.031999945640564 +/- 0.0178885800721685
        Measured from: 0.0200000405311584
                   to: 0.0519999861717224     [s; relative to TRIGTIME]


  Fluence
     Peak Flux  (peak 1 second)
        Measured from: -0.46399998664856
                   to: 0.53600001335144     [s; relative to TRIGTIME]
     Total Fluence
        Measured from: 0
                   to: 0.0680000185966492     [s; relative to TRIGTIME]

             Band 1     Band 2     Band 3     Band 4
              15-25      25-50     50-100    100-350     keV
 Total     0.006769   0.016512   0.015015   0.001700
           0.002154   0.002727   0.002806   0.002121 [error]
 Peak     -0.005831   0.026621   0.014870   0.011075
           0.006811   0.007201   0.006211   0.005533 [error]

     [ fluence units of on-axis counts / fully illuminated detector ]

======================================================================


====== Table of the duration information =============================

        Value   tstart    tstop
T100    0.068    0.000    0.068
T90     0.060    0.004    0.064
T50     0.032    0.020    0.052
Peak    1.000   -0.464    0.536


====== Spectral Analysis Summary =====================================

Model      : spectral model: simple power-law (PL) and cutoff power-law (CPL)
Ph_index   : photon index: E^{Ph_index}
Ph_90err   : 90% error of the photon index
Epeak      : Epeak in keV
Epeak_90err: 90% error of Epeak
Norm       : normalization at 50 keV in both the PL model and CPL model
Nomr_90err : 90% error of the normalization
chi2       : Chi-Squared
dof        : degree of freedo

=== Time-averaged spectral analysis ===
(Best model with acceptable fit: N/A)

Model Ph_index Ph_90err_low Ph_90err_hi  Epeak  Epeak_90err_low  Epeak_90err_hi  Norm       Nomr_90err_low    Norm_90err_hi    chi2    dof
PL      -1.500    -3.136     -1.843       -           -               -         0.00e+00     8.70e-04          4.03e-03     112.410   57
CPL     -1.000     N/A        N/A          80.000      N/A           N/A         0.00e+00        N/A               N/A        112.410   56


=== 1-s peak spectral analysis ===
(Best model with acceptable fit: N/A)

Model Ph_index Ph_90err_low Ph_90err_hi  Epeak  Epeak_90err_low  Epeak_90err_hi  Norm       Nomr_90err_low    Norm_90err_hi    chi2    dof
PL      -0.849     -0.709     0.927       -           -               -         2.66e-03     -1.36e-03          1.31e-03      53.240   57
CPL      2.988     -3.543    -2.988       63.389     -21.386       172.944      2.13e-01     -2.13e-01          6.68e+03      50.820   56


=== Fluence/Peak Flux Summary ===

              Model    Band1     Band2     Band3     Band4     Band5     Total
                       15-25     25-50    50-100    100-350    15-150    15-350    keV
Fluence         PL   1.94e-09  9.23e-10  2.68e-10  9.76e-11  3.18e-09  3.23e-09   erg/cm2
      90%_error_low -8.29e-10 -4.77e-10 -1.91e-10 -8.32e-11 -1.40e-09 -1.43e-09   erg/cm2
      90%_error_hi   8.26e-10  4.54e-10  2.06e-10  1.32e-10  1.39e-09  1.43e-09   erg/cm2
Peak flux       PL   5.83e-02  8.70e-02  9.71e-02  2.05e-01  3.04e-01  4.46e-01   ph/cm2/s
      90%_error_low -5.83e-02 -5.34e-02 -4.68e-02 -2.05e-01 -1.46e-01 -2.18e-01   ph/cm2/s
      90%_error_hi   6.57e-02  5.44e-02  4.66e-02  2.89e-01  1.52e-01  2.59e-01   ph/cm2/s

Fluence        CPL   3.81e-10  6.60e-09  7.95e-09  1.99e-10  1.51e-08  1.51e-08   erg/cm2
      90%_error_low -3.10e-10 -2.05e-09 -2.99e-09 -1.55e-10 -3.41e-09 -3.39e-09   erg/cm2
      90%_error_hi   8.16e-10  1.81e-09  3.27e-09  1.96e-10  3.40e-09  3.42e-09   erg/cm2
Peak flux      CPL   8.82e-03  1.34e-01  9.34e-02  5.64e-04  2.36e-01  2.36e-01   ph/cm2/s
      90%_error_low -8.82e-03 -7.65e-02 -5.87e-02 -5.64e-04 -9.98e-02 -9.99e-02   ph/cm2/s
      90%_error_hi   7.28e-02  8.76e-02  7.64e-02  1.51e-01  1.61e-01  1.81e-01   ph/cm2/s

======================================================================
Image
Pre-slew 15.0-350.0 keV image (Event data)
#   RAcent    DECcent   POSerr    Theta     Phi              Peak Cts       SNR   Name
  312.5894    36.6687   0.0225    13.9445  -104.5282         0.0438136      8.521 TRIG_00623158

Foreground time interval of the image:
  0.000   0.068 (delta_t =   0.068 [sec])
Background time interval of the image:
-126.591   0.000 (delta_t = 126.591 [sec])
Light Curves
Note: The mask-weighted lightcurves have units of either count/det or counts/sec/det, where a det is 0.4 x 0.4 = 0.16 sq cm.
Full-time range; 1 s binning
Other quick-look light curves:
- 64 ms binning (zoomed)
- 16 ms binning (zoomed)
- 8 ms binning (zoomed)
- 2 ms binning (zoomed)
- SN=5 or 10 s binning (full-time range)
- Raw light curve
Spectra
- 64 ms binning (zoomed)
- 16 ms binning (zoomed)
- 8 ms binning (zoomed)
- 2 ms binning (zoomed)
- SN=5 or 10 s binning (full-time range)
- Raw light curve
Spectra
Notes:
- 1) The fitting includes the systematic errors.
- 2) When the burst includes telescope slew time periods, the fitting uses an average response file made from multiple 5-s response files through out the slew time plus single time preiod for the non-slew times, and weighted by the total counts in the corresponding time period using addrmf. An average response file is needed becuase a spectral fit using the pre-slew DRM will introduce some errors in both a spectral shape and a normalization if the PHA file contains a lot of the slew/post-slew time interval.
- 3) For fits to more complicated models (e.g. a power-law over a cutoff power-law), the BAT team has decided to require a chi-square improvement of more than 6 for each extra dof.
Time averaged spectrum fit using the average DRM
Power-law model
Time interval is from    0.000 sec. to    0.068 sec.

Spectral model in power-law:
------------------------------------------------------------
Parameters  : value       lower 90%   higher 90%
Photon index: -3.79848     ( -0.853731   0.439971 )
Norm@50keV  : 2.44386E-03    ( -0.00159132   0.00157306 )
------------------------------------------------------------
#Fit statistic : Chi-Squared =          97.49 using 59 PHA bins.
# Reduced chi-squared =          1.710 for     57 degrees of freedom
# Null hypothesis probability =   6.744175e-04

Photon flux (15-150 keV)    in 0.068 sec: 1.26843 ( -0.541475  0.54015 ) ph/cm2/s
Energy fluence (15-150 keV)             : 3.18397e-09 ( -1.40155e-09  1.38627e-09 ) ergs/cm2
Cutoff power-law model
Time interval is from    0.000 sec. to    0.068 sec.
Spectral model in the cutoff power-law:
------------------------------------------------------------
Parameters  : value       lower 90%   higher 90%
Photon index: -1     (       )
Epeak [keV] : 80.0000      (   )
Norm@50keV  : 0.0    (     )
------------------------------------------------------------
#Fit statistic : Chi-Squared =         112.41 using 59 PHA bins.
# Reduced chi-squared =         2.0074 for     56 degrees of freedom
# Null hypothesis probability =   1.173343e-05

Photon flux (15-150 keV)    in 0.068 sec:  (    ) ph/cm2/s
Energy fluence (15-150 keV)             : 1.51241e-08 ( -3.40702e-09  3.40436e-09 ) ergs/cm2
1-s peak spectrum fit
Power-law model
Time interval is from   -0.464 sec. to    0.536 sec.

Spectral model in power-law:
------------------------------------------------------------
Parameters  : value       lower 90%   higher 90%
Photon index: -0.84917     ( -0.71902   0.916926 )
Norm@50keV  : 2.65570E-03    ( -0.00135904   0.00131039 )
------------------------------------------------------------
#Fit statistic : Chi-Squared =          53.24 using 59 PHA bins.
# Reduced chi-squared =         0.9341 for     57 degrees of freedom
# Null hypothesis probability =   6.168036e-01

Photon flux (15-150 keV)    in 1 sec: 0.304420 ( -0.145885  0.152104 ) ph/cm2/s
Energy fluence (15-150 keV)             : 3.04502e-08 ( -1.4735e-08  1.5057e-08 ) ergs/cm2
Cutoff power-law model
Time interval is from   -0.464 sec. to    0.536 sec.
Spectral model in the cutoff power-law:
------------------------------------------------------------
Parameters  : value       lower 90%   higher 90%
Photon index: 9.57437     ( -10.0973   -9.5419 )
Epeak [keV] : 52.1721      ( -10.1821 184.148 )
Norm@50keV  : 393.047    ( -362.379   6319.03 )
------------------------------------------------------------
#Fit statistic : Chi-Squared =          50.04 using 59 PHA bins.
# Reduced chi-squared =         0.8936 for     56 degrees of freedom
# Null hypothesis probability =   6.987688e-01

Photon flux (15-150 keV)    in 1 sec: 0.236238 ( -0.099803  0.160789 ) ph/cm2/s
Energy fluence (15-150 keV)             : 1.80443e-08 ( -7.77502e-09  1.85135e-08 ) ergs/cm2
Time-resolved spectra
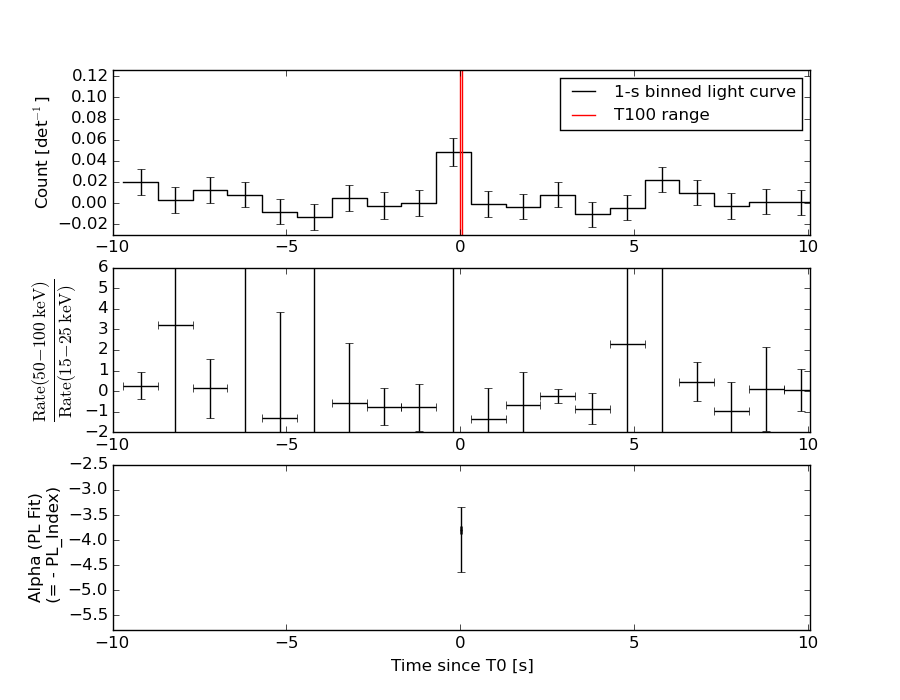
Distribution
T90 vs. Hardness ratio plot
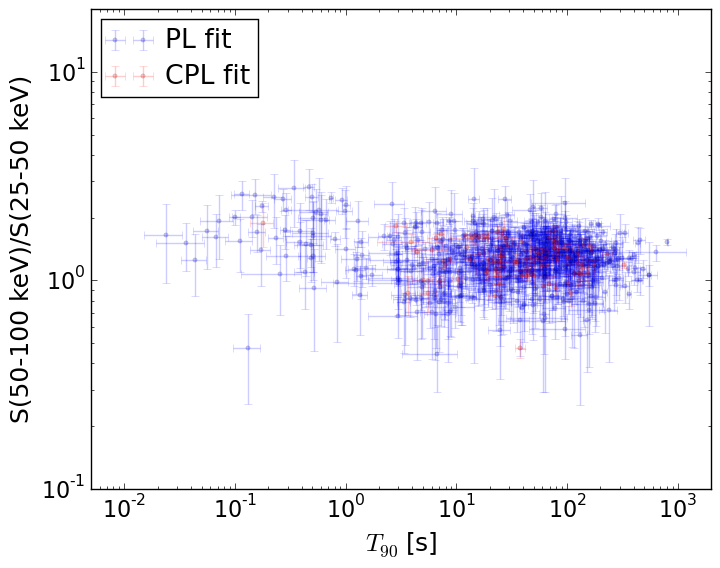
T90                                   = N/A sec.
Hardness ratio (energy fluence ratio) = N/A
S(15-50 keV) vs. S(50-150 keV) plot
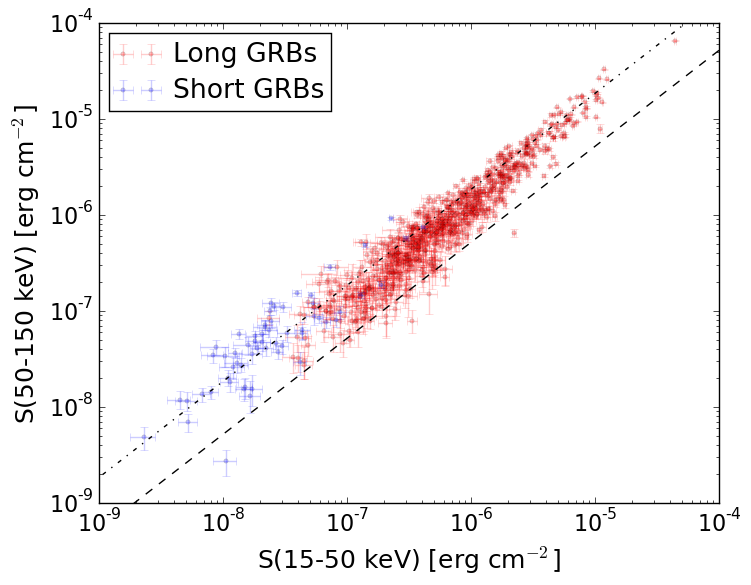
S(15-50 keV)  = N/A
S(50-150 keV) = N/A
The dash-dotted line and the dashed line traces the fluences calculated from the Band function with Epeak = 15 and 150 keV, respectively. Both lines assume a canonical values of alpha = -1 and beta = -2.5.
Mask shadow pattern
IMX = -6.228787252569472E-02, IMY = 2.403604035610543E-01
Spacecraft aspect plot
Bright source in the pre-burst/pre-slew/post-slew images
Pre-burst image of 15-350 keV band
Time interval of the image:
-126.591400 0.000000

# RAcent  DECcent POSerr Theta    Phi  PeakCts   SNR AngSep     Name
#  [deg]    [deg]    ['] [deg]  [deg]                   [']
254.3144  35.2505    4.5  48.7  -30.1  -0.8338  -2.6    8.9	Her X-1
299.5788  35.1937    0.9  20.6  -75.8   2.2278  12.7    0.7	Cyg X-1
308.1179  40.9789    2.0  11.9  -81.3   0.8808   5.6    1.6	Cyg X-3
326.4414  38.3258    0.0  12.3 -154.5   0.2138   1.4   12.7	Cyg X-2
251.3819  50.3123    2.7  42.3  -10.6   0.9179   4.3 ------	UNKNOWN
315.2856   4.1773    2.7  45.6 -122.7   2.9204   4.3 ------	UNKNOWN
Pre-slew background subtracted image of 15-350 keV band
Time interval of the image:
0.000000 0.068000

# RAcent  DECcent POSerr Theta    Phi  PeakCts   SNR AngSep     Name
#  [deg]    [deg]    ['] [deg]  [deg]                   [']
254.3378  35.2415   79.1  48.7  -30.1   0.0015   0.1    8.4	Her X-1
299.4192  35.1920    4.7  20.7  -75.5   0.0142   2.5    8.4	Cyg X-1
307.8430  40.8981    0.0  12.1  -80.8   0.0101   2.1   12.5	Cyg X-3
326.1259  38.1541    4.5  12.4 -153.1  -0.0126  -2.6   10.3	Cyg X-2
312.5893  36.6688    1.4  13.9 -104.5   0.0438   8.5 ------	UNKNOWN
Post-slew image of 15-350 keV band
Time interval of the image:
45.008590 962.468000

# RAcent  DECcent POSerr Theta    Phi  PeakCts   SNR AngSep     Name
#  [deg]    [deg]    ['] [deg]  [deg]                   [']
254.5153  35.4489    9.6  46.2  -14.4   1.3402   1.2    7.0	Her X-1
288.8030  10.9224    1.3  33.6  -75.3  11.5457   9.0    1.4	GRS 1915+105
299.5985  35.2040    0.5  10.7  -35.6  15.8463  24.9    0.4	Cyg X-1
308.1270  40.9636    0.8   5.5   20.5   8.0718  13.7    1.0	Cyg X-3
326.0537  38.2055   12.3  10.7  137.0  -0.6121  -0.9    8.9	Cyg X-2
349.8618  16.6127    3.0  38.5  170.3   4.2425   3.9 ------	UNKNOWN
252.7736  45.2190    2.4  44.9   -0.7   5.1426   4.8 ------	UNKNOWN
317.8324  15.1451    2.3  22.1 -134.6   3.1364   5.1 ------	UNKNOWN
264.5164  20.8621    3.4  44.5  -38.3   3.8242   3.4 ------	UNKNOWN
343.2530 -13.5566    4.5  58.0 -156.8  11.4962   2.6 ------	UNKNOWN
311.9059   0.1435    3.6  36.6 -119.9   3.1364   3.2 ------	UNKNOWN
246.1302  21.7507    4.4  58.8  -26.1  11.1074   2.6 ------	UNKNOWN
267.5494  11.5206    2.7  47.6  -51.2  12.0001   4.2 ------	UNKNOWN