Analysis Summary
Notes:
- 1) No attempt has been made to eliminate the non-significant decimal places.
- 2) This batgrbproduct analysis is done using the HEASARC data.
- 3) This batgrbproduct analysis is using the flight position for the mask-weighting calculation.
======================================================================
                  BAT GRB EVENT DATA PROCESSING REPORT
    Process Script Ver: batgrbproduct v2.46
    Process Start Time: Mon Jan 26 10:54:33 EST 2015
             Host Name: bat1
   Current Working Dir: /local/data/bat1/alien/Swift_3rdBATcatalog/event/batevent_reproc/trigger623368
======================================================================

  Trigger: 00623368      Segment: 000

  BAT Trigger Time: 442008152   [s; MET]
      Trigger Stop: 442008216   [s; MET]
               UTC: 2015-01-03T20:02:18.996300    [includes UTCF correction]
       Where From?: TDRSS position message

  BAT
    RA: 131.639444320183   Dec: -48.8904166081603  [deg; J2000]

     Catalogged Source?: NO
     Point Source?:      YES
     GRB Indicated?:     YES    [ by BAT flight software ]
     Image S/N Ratio:    10.36
     Image Trigger?:     YES
     Rate S/N Ratio:     0  [ if not an image trigger ]
     Image S/N Ratio:    10.36

  Analysis Position:   [ source = BAT ]
    RA: 131.639444320183   Dec: -48.8904166081603  [deg; J2000]

  Refined Position:   [ source = BAT pre-slew burst ]
    RA: 131.674629550024   Dec: -48.8959299935529  [deg; J2000]
        { 08h 46m 41.9s , -48d 53' 45.3" }
         +/- 2.04400974050566 [arcmin] (estimated 90% radius based on SNR)
         +/- 0.673770831603855 [arcmin] (formal 1-sigma fit error)
    SNR: 10.9539635832532

  Angular difference between the analysis and refined position is 1.426860 arcmin

  Partial Coding Fraction: 0.671875    [ including projection effects ]

  Duration
     T90: 49.0879999995232 +/- 9.80709947303509
        Measured from: 10.6000000238419
                   to: 59.688000023365     [s; relative to TRIGTIME]
     T50: 21.8880000114441 +/- 6.18287702713734
        Measured from: 24.0400000214577
                   to: 45.9280000329018     [s; relative to TRIGTIME]


  Fluence
     Peak Flux  (peak 1 second)
        Measured from: 26.3240000009537
                   to: 27.3240000009537     [s; relative to TRIGTIME]
     Total Fluence
        Measured from: 6.05599999427795
                   to: 64.6800000071526     [s; relative to TRIGTIME]

             Band 1     Band 2     Band 3     Band 4
              15-25      25-50     50-100    100-350     keV
 Total     0.427388   0.694458   0.431790   0.007791
           0.061332   0.062491   0.052902   0.045711 [error]
 Peak      0.029518   0.025162   0.008190   0.004967
           0.008221   0.008289   0.006887   0.006067 [error]

     [ fluence units of on-axis counts / fully illuminated detector ]

======================================================================


====== Table of the duration information =============================

        Value   tstart    tstop
T100   58.624    6.056   64.680
T90    49.088   10.600   59.688
T50    21.888   24.040   45.928
Peak    1.000   26.324   27.324


====== Spectral Analysis Summary =====================================

Model      : spectral model: simple power-law (PL) and cutoff power-law (CPL)
Ph_index   : photon index: E^{Ph_index}
Ph_90err   : 90% error of the photon index
Epeak      : Epeak in keV
Epeak_90err: 90% error of Epeak
Norm       : normalization at 50 keV in both the PL model and CPL model
Nomr_90err : 90% error of the normalization
chi2       : Chi-Squared
dof        : degree of freedo

=== Time-averaged spectral analysis ===
(Best model with acceptable fit: PL)

Model Ph_index Ph_90err_low Ph_90err_hi  Epeak  Epeak_90err_low  Epeak_90err_hi  Norm       Nomr_90err_low    Norm_90err_hi    chi2    dof
PL      -1.605    -0.178      0.175       -           -               -         1.74e-03     -2.06e-04          2.04e-04      66.370   57
CPL      0.032    -0.891      1.123       54.238      -8.448        17.225      1.43e-02     -1.43e-02          4.66e-02      54.690   56


=== 1-s peak spectral analysis ===
(Best model with acceptable fit: N/A)

Model Ph_index Ph_90err_low Ph_90err_hi  Epeak  Epeak_90err_low  Epeak_90err_hi  Norm       Nomr_90err_low    Norm_90err_hi    chi2    dof
PL      -2.147     -0.681     0.536       -           -               -         3.18e-03     -1.54e-03          1.52e-03      50.870   57
CPL      1.103     -2.711    -1.103       35.012      N/A           N/A         3.51e-01        N/A               N/A         46.490   56


=== Fluence/Peak Flux Summary ===

              Model    Band1     Band2     Band3     Band4     Band5     Total
                       15-25     25-50    50-100    100-350    15-150    15-350    keV
Fluence         PL   1.44e-07  2.48e-07  3.26e-07  8.71e-07  9.53e-07  1.59e-06   erg/cm2
      90%_error_low -2.33e-08 -2.75e-08 -4.95e-08 -2.39e-07 -1.20e-07 -2.93e-07   erg/cm2
      90%_error_hi   2.40e-08  2.75e-08  4.98e-08  2.93e-07  1.22e-07  3.35e-07   erg/cm2
Peak flux       PL   2.45e-01  1.68e-01  7.53e-02  4.72e-02  5.12e-01  5.36e-01   ph/cm2/s
      90%_error_low -1.03e-01 -6.38e-02 -4.23e-02 -4.72e-02 -1.87e-01 -1.98e-01   ph/cm2/s
      90%_error_hi   1.08e-01  6.33e-02  4.86e-02  6.76e-02  1.87e-01  2.01e-01   ph/cm2/s

Fluence        CPL   1.22e-07  3.00e-07  3.17e-07  1.10e-07  8.25e-07  8.49e-07   erg/cm2
      90%_error_low -2.69e-08 -3.91e-08 -6.72e-08 -7.39e-08 -1.22e-07 -1.41e-07   erg/cm2
      90%_error_hi   2.73e-08  4.09e-08  6.25e-08  1.83e-07  1.33e-07  2.12e-07   erg/cm2
Peak flux      CPL   2.13e-01  2.51e-01  5.45e-02  9.54e-04  5.20e-01  5.20e-01   ph/cm2/s
      90%_error_low -1.16e-01 -9.42e-02 -5.45e-02 -9.54e-04 -1.78e-01 -1.78e-01   ph/cm2/s
      90%_error_hi   1.21e-01  9.96e-02  6.66e-02  2.61e-02  1.80e-01  1.80e-01   ph/cm2/s

======================================================================
Image
Pre-slew 15.0-350.0 keV image (Event data)
#   RAcent    DECcent   POSerr    Theta     Phi              Peak Cts       SNR   Name
  131.6746   -48.8959   0.0176    20.0977    65.9568         1.4338336     10.954 TRIG_00623368

Foreground time interval of the image:
  6.056  64.680 (delta_t =  58.624 [sec])
Background time interval of the image:
-239.000   6.056 (delta_t = 245.056 [sec])
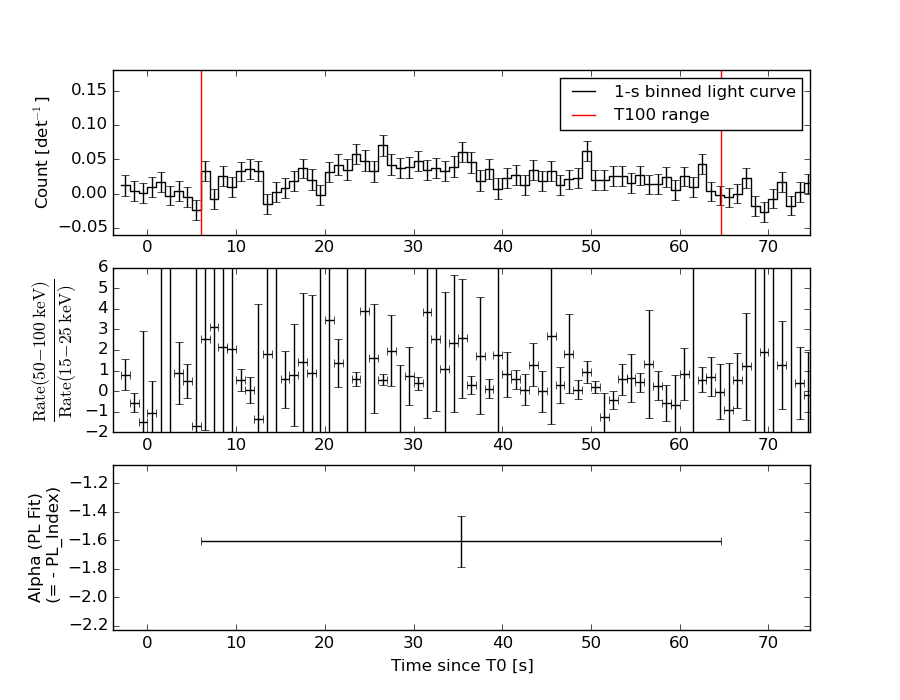
Light Curves
Note: The mask-weighted lightcurves have units of either count/det or counts/sec/det, where a det is 0.4 x 0.4 = 0.16 sq cm.
Full-time range; 1 s binning
Other quick-look light curves:
- 64 ms binning (zoomed)
- 16 ms binning (zoomed)
- 8 ms binning (zoomed)
- 2 ms binning (zoomed)
- SN=5 or 10 s binning (full-time range)
- Raw light curve
Spectra
- 64 ms binning (zoomed)
- 16 ms binning (zoomed)
- 8 ms binning (zoomed)
- 2 ms binning (zoomed)
- SN=5 or 10 s binning (full-time range)
- Raw light curve
Spectra
Notes:
- 1) The fitting includes the systematic errors.
- 2) When the burst includes telescope slew time periods, the fitting uses an average response file made from multiple 5-s response files through out the slew time plus single time preiod for the non-slew times, and weighted by the total counts in the corresponding time period using addrmf. An average response file is needed becuase a spectral fit using the pre-slew DRM will introduce some errors in both a spectral shape and a normalization if the PHA file contains a lot of the slew/post-slew time interval.
- 3) For fits to more complicated models (e.g. a power-law over a cutoff power-law), the BAT team has decided to require a chi-square improvement of more than 6 for each extra dof.
Time averaged spectrum fit using the average DRM
Power-law model
Time interval is from    6.056 sec. to   64.680 sec.

Spectral model in power-law:
------------------------------------------------------------
Parameters  : value       lower 90%   higher 90%
Photon index: -1.60502     ( -0.178122   0.175265 )
Norm@50keV  : 1.73961E-03    ( -0.000205705   0.000204003 )
------------------------------------------------------------
#Fit statistic : Chi-Squared =          66.37 using 59 PHA bins.
# Reduced chi-squared =          1.164 for     57 degrees of freedom
# Null hypothesis probability =   1.853684e-01

Photon flux (15-150 keV)    in 58.62 sec: 0.223903 ( -0.024741  0.024755 ) ph/cm2/s
Energy fluence (15-150 keV)             : 9.5329e-07 ( -1.19867e-07  1.21679e-07 ) ergs/cm2
Cutoff power-law model
Time interval is from    6.056 sec. to   64.680 sec.
Spectral model in the cutoff power-law:
------------------------------------------------------------
Parameters  : value       lower 90%   higher 90%
Photon index: 0.0324951     ( -0.890549   1.12314 )
Epeak [keV] : 54.2377      ( -8.44761 17.2256 )
Norm@50keV  : 1.42552E-02    ( -0.0142558   0.0465513 )
------------------------------------------------------------
#Fit statistic : Chi-Squared =          54.69 using 59 PHA bins.
# Reduced chi-squared =         0.9766 for     56 degrees of freedom
# Null hypothesis probability =   5.246134e-01

Photon flux (15-150 keV)    in 58.62 sec: 0.213020 ( -0.025143  0.025249 ) ph/cm2/s
Energy fluence (15-150 keV)             : 8.24854e-07 ( -1.22452e-07  1.32508e-07 ) ergs/cm2
1-s peak spectrum fit
Power-law model
Time interval is from   26.324 sec. to   27.324 sec.

Spectral model in power-law:
------------------------------------------------------------
Parameters  : value       lower 90%   higher 90%
Photon index: -2.14673     ( -0.668697   0.548754 )
Norm@50keV  : 3.17762E-03    ( -0.00153036   0.00152652 )
------------------------------------------------------------
#Fit statistic : Chi-Squared =          50.87 using 59 PHA bins.
# Reduced chi-squared =         0.8924 for     57 degrees of freedom
# Null hypothesis probability =   7.031567e-01

Photon flux (15-150 keV)    in 1 sec: 0.511649 ( -0.186887  0.187464 ) ph/cm2/s
Energy fluence (15-150 keV)             : 2.95726e-08 ( -1.24823e-08  1.35992e-08 ) ergs/cm2
Cutoff power-law model
Time interval is from   26.324 sec. to   27.324 sec.
Spectral model in the cutoff power-law:
------------------------------------------------------------
Parameters  : value       lower 90%   higher 90%
Photon index: 1.10317     ( -2.76109   -1.15335 )
Epeak [keV] : 35.0124      (   )
Norm@50keV  : 0.351311    (     )
------------------------------------------------------------
#Fit statistic : Chi-Squared =          46.49 using 59 PHA bins.
# Reduced chi-squared =         0.8301 for     56 degrees of freedom
# Null hypothesis probability =   8.136660e-01

Photon flux (15-150 keV)    in 1 sec: 0.519888 ( -0.177628  0.179904 ) ph/cm2/s
Energy fluence (15-150 keV)             : 2.62349e-08 ( -1.01899e-08  1.16303e-08 ) ergs/cm2
Time-resolved spectra
Distribution
T90 vs. Hardness ratio plot
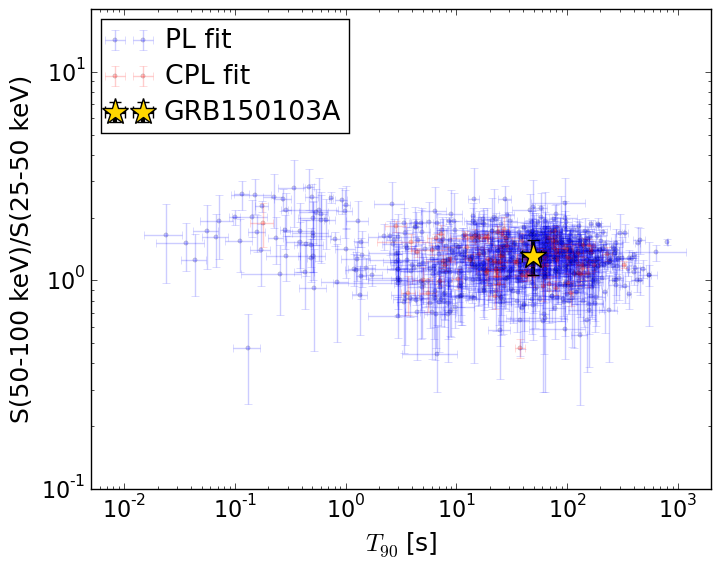
T90                                   = 49.088 sec.
Hardness ratio (energy fluence ratio) = 1.31507311704
S(15-50 keV) vs. S(50-150 keV) plot
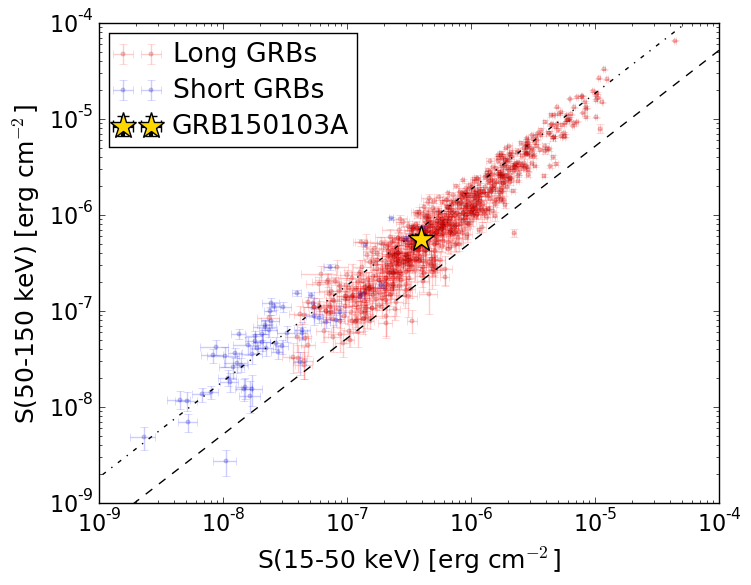
S(15-50 keV)  = 3.913711e-07
S(50-150 keV) = 5.619201e-07
The dash-dotted line and the dashed line traces the fluences calculated from the Band function with Epeak = 15 and 150 keV, respectively. Both lines assume a canonical values of alpha = -1 and beta = -2.5.
Mask shadow pattern
IMX = 1.490781412126486E-01, IMY = -3.341563400959436E-01
Spacecraft aspect plot
Bright source in the pre-burst/pre-slew/post-slew images
Pre-burst image of 15-350 keV band
Time interval of the image:
-239.000000 6.056000

# RAcent  DECcent POSerr Theta    Phi  PeakCts   SNR AngSep     Name
#  [deg]    [deg]    ['] [deg]  [deg]                   [']
135.4557 -40.7513    0.0  24.8   84.9   0.6168   1.7   12.3	Vela X-1
170.2589 -60.6566    1.5   4.6 -116.7   1.9247   7.9    2.6	Cen X-3
186.5106 -62.7968    2.0  12.5 -107.8   1.3545   5.9    4.3	GX 301-2
171.0256  -9.6052    2.4  50.6  149.3   6.2049   4.8 ------	UNKNOWN
169.6193 -17.1487    2.7  42.9  148.6   2.6864   4.3 ------	UNKNOWN
178.3621 -13.3757    2.7  48.0  159.4   3.2106   4.2 ------	UNKNOWN
 35.6032 -57.7234    2.2  55.1  -11.3   3.8517   5.2 ------	UNKNOWN
323.1878 -71.8634    2.2  47.9  -50.7   5.5100   5.2 ------	UNKNOWN
Pre-slew background subtracted image of 15-350 keV band
Time interval of the image:
6.056000 64.680000

# RAcent  DECcent POSerr Theta    Phi  PeakCts   SNR AngSep     Name
#  [deg]    [deg]    ['] [deg]  [deg]                   [']
135.6317 -40.4061    5.6  25.0   85.6  -0.3284  -2.1   10.1	Vela X-1
170.3524 -60.4522    6.4   4.6 -119.4   0.1902   1.8   10.3	Cen X-3
186.7299 -62.7751    3.3  12.6 -108.0  -0.3634  -3.5    2.0	GX 301-2
 90.9759 -47.9042    2.7  41.0   30.9   0.8740   4.3 ------	UNKNOWN
131.6747 -48.8959    1.1  20.1   66.0   1.4338  11.0 ------	UNKNOWN
170.9116 -41.0083    2.7  19.6  159.0   0.4150   4.3 ------	UNKNOWN
 40.9499 -80.1244    2.7  36.2  -28.7   0.5551   4.3 ------	UNKNOWN
214.9057 -36.1717    2.6  41.3 -143.2   0.7777   4.4 ------	UNKNOWN
222.5152 -61.7894    2.0  28.9 -102.2   0.7915   5.7 ------	UNKNOWN
242.4844 -54.6694    2.1  41.5 -102.7   2.2884   5.5 ------	UNKNOWN
Post-slew image of 15-350 keV band
Time interval of the image:
114.900600 963.014200

# RAcent  DECcent POSerr Theta    Phi  PeakCts   SNR AngSep     Name
#  [deg]    [deg]    ['] [deg]  [deg]                   [']
135.3294 -40.5895   10.5   8.7  134.9   0.6917   1.1    9.3	Vela X-1
170.3374 -60.6165    1.5  24.7 -111.1   5.7401   7.7    0.7	Cen X-3
186.7635 -62.6661    4.2  32.6 -108.2   2.9722   2.8    6.9	GX 301-2
 50.1470 -40.5634    3.8  55.7    1.6   9.7065   3.0 ------	UNKNOWN
 44.2272 -42.3414    3.5  58.0   -3.3  13.8634   3.3 ------	UNKNOWN
149.6663 -48.2358    3.6  11.9 -150.3   1.8101   3.2 ------	UNKNOWN
128.3648 -62.1663    2.3  13.4  -57.2   3.0303   5.0 ------	UNKNOWN
 24.0355 -56.5301    4.6  58.7  -25.9  11.2422   2.6 ------	UNKNOWN