Analysis Summary
Notes:
- 1) No attempt has been made to eliminate the non-significant decimal places.
- 2) This batgrbproduct analysis is done using the HEASARC data.
- 3) This batgrbproduct analysis is using the flight position for the mask-weighting calculation.
======================================================================
BAT GRB EVENT DATA PROCESSING REPORT
Process Script Ver: batgrbproduct v2.46
Process Start Time: Mon Jan 26 10:52:51 EST 2015
Host Name: bat1
Current Working Dir: /local/data/bat1/alien/Swift_3rdBATcatalog/event/batevent_reproc/trigger624606
======================================================================
Trigger: 00624606 Segment: 000
BAT Trigger Time: 442620523.072 [s; MET]
Trigger Stop: 442620524.096 [s; MET]
UTC: 2015-01-10T22:08:30.037560 [includes UTCF correction]
Where From?: TDRSS position message
BAT
RA: 289.359743492699 Dec: 32.5222624222269 [deg; J2000]
Catalogged Source?: NO
Point Source?: YES
GRB Indicated?: YES [ by BAT flight software ]
Image S/N Ratio: 10.76
Image Trigger?: NO
Rate S/N Ratio: 15.4272486205415 [ if not an image trigger ]
Image S/N Ratio: 10.76
Analysis Position: [ source = BAT ]
RA: 289.359743492699 Dec: 32.5222624222269 [deg; J2000]
Refined Position: [ source = BAT pre-slew burst ]
RA: 289.37338688361 Dec: 32.5282052322741 [deg; J2000]
{ 19h 17m 29.6s , +32d 31' 41.5" }
+/- 1.22751743157288 [arcmin] (estimated 90% radius based on SNR)
+/- 0.496412747048057 [arcmin] (formal 1-sigma fit error)
SNR: 22.695303610433
Angular difference between the analysis and refined position is 0.776872 arcmin
Partial Coding Fraction: 0.9609375 [ including projection effects ]
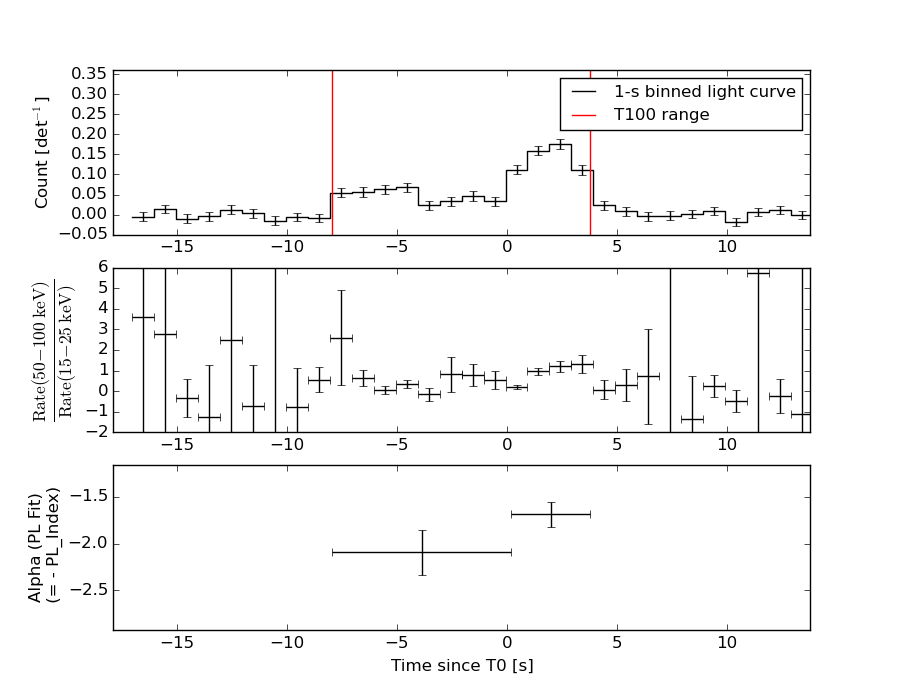
Duration
T90: 10.5799999833107 +/- 0.950166307490648
Measured from: -7.25200003385544
to: 3.32799994945526 [s; relative to TRIGTIME]
T50: 6.45199996232986 +/- 1.43298848937098
Measured from: -4.21200001239777
to: 2.2399999499321 [s; relative to TRIGTIME]
Fluence
Peak Flux (peak 1 second)
Measured from: 1.73600000143051
to: 2.73600000143051 [s; relative to TRIGTIME]
Total Fluence
Measured from: -7.93999999761581
to: 3.77199995517731 [s; relative to TRIGTIME]
Band 1 Band 2 Band 3 Band 4
15-25 25-50 50-100 100-350 keV
Total 0.320475 0.372016 0.203824 0.043985
0.022214 0.022588 0.018939 0.015142 [error]
Peak 0.041141 0.067549 0.052036 0.021915
0.006744 0.007139 0.006311 0.004824 [error]
[ fluence units of on-axis counts / fully illuminated detector ]
======================================================================
====== Table of the duration information =============================
Value tstart tstop
T100 11.712 -7.940 3.772
T90 10.580 -7.252 3.328
T50 6.452 -4.212 2.240
Peak 1.000 1.736 2.736
====== Spectral Analysis Summary =====================================
Model : spectral model: simple power-law (PL) and cutoff power-law (CPL)
Ph_index : photon index: E^{Ph_index}
Ph_90err : 90% error of the photon index
Epeak : Epeak in keV
Epeak_90err: 90% error of Epeak
Norm : normalization at 50 keV in both the PL model and CPL model
Nomr_90err : 90% error of the normalization
chi2 : Chi-Squared
dof : degree of freedo
=== Time-averaged spectral analysis ===
(Best model with acceptable fit: PL)
Model Ph_index Ph_90err_low Ph_90err_hi Epeak Epeak_90err_low Epeak_90err_hi Norm Nomr_90err_low Norm_90err_hi chi2 dof
PL -1.887 -0.135 0.131 - - - 4.57e-03 -3.89e-04 3.83e-04 49.710 57
CPL -1.294 -0.543 0.624 51.654 -11.391 73.733 9.82e-03 -4.86e-03 1.21e-02 46.190 56
=== 1-s peak spectral analysis ===
(Best model with acceptable fit: PL)
Model Ph_index Ph_90err_low Ph_90err_hi Epeak Epeak_90err_low Epeak_90err_hi Norm Nomr_90err_low Norm_90err_hi chi2 dof
PL -1.358 -0.196 0.196 - - - 1.13e-02 -1.32e-03 1.31e-03 44.840 57
CPL -0.947 -0.512 0.901 126.855 -60.512 -126.855 1.84e-02 -8.14e-03 3.37e-02 44.000 56
=== Fluence/Peak Flux Summary ===
Model Band1 Band2 Band3 Band4 Band5 Total
15-25 25-50 50-100 100-350 15-150 15-350 keV
Fluence PL 9.83e-08 1.43e-07 1.54e-07 3.12e-07 4.92e-07 7.07e-07 erg/cm2
90%_error_low -1.04e-08 -1.02e-08 -1.79e-08 -6.73e-08 -4.11e-08 -8.67e-08 erg/cm2
90%_error_hi 1.07e-08 1.02e-08 1.80e-08 7.89e-08 4.17e-08 9.55e-08 erg/cm2
Peak flux PL 4.06e-01 4.45e-01 3.47e-01 4.45e-01 1.36e+00 1.64e+00 ph/cm2/s
90%_error_low -7.92e-02 -5.57e-02 -4.98e-02 -1.18e-01 -1.58e-01 -1.96e-01 ph/cm2/s
90%_error_hi 8.35e-02 5.51e-02 4.93e-02 1.43e-01 1.58e-01 1.99e-01 ph/cm2/s
Fluence CPL 9.23e-08 1.53e-07 1.52e-07 1.19e-07 4.63e-07 5.17e-07 erg/cm2
90%_error_low -1.19e-08 -1.35e-08 -2.04e-08 -6.61e-08 -4.73e-08 -8.30e-08 erg/cm2
90%_error_hi 1.20e-08 1.39e-08 1.98e-08 1.63e-07 4.87e-08 1.68e-07 erg/cm2
Peak flux CPL 3.80e-01 4.64e-01 3.59e-01 2.73e-01 1.34e+00 1.48e+00 ph/cm2/s
90%_error_low -9.36e-02 -6.58e-02 -5.47e-02 -1.59e-01 -1.64e-01 -2.37e-01 ph/cm2/s
90%_error_hi 9.62e-02 6.87e-02 5.64e-02 2.15e-01 1.63e-01 2.87e-01 ph/cm2/s
======================================================================
Image
Pre-slew 15.0-350.0 keV image (Event data)
#   RAcent    DECcent   POSerr    Theta     Phi              Peak Cts       SNR   Name
  289.3734    32.5282   0.0085    13.0251    25.8165         0.9308752     22.695 TRIG_00624606

Foreground time interval of the image:
 -7.940   3.772 (delta_t =  11.712 [sec])
Background time interval of the image:
-239.072  -7.940 (delta_t = 231.132 [sec])
Light Curves
Note: The mask-weighted lightcurves have units of either count/det or counts/sec/det, where a det is 0.4 x 0.4 = 0.16 sq cm.
Full-time range; 1 s binning
Other quick-look light curves:
- 64 ms binning (zoomed)
- 16 ms binning (zoomed)
- 8 ms binning (zoomed)
- 2 ms binning (zoomed)
- SN=5 or 10 s binning (full-time range)
- Raw light curve
Spectra
- 64 ms binning (zoomed)
- 16 ms binning (zoomed)
- 8 ms binning (zoomed)
- 2 ms binning (zoomed)
- SN=5 or 10 s binning (full-time range)
- Raw light curve
Spectra
Notes:
- 1) The fitting includes the systematic errors.
- 2) When the burst includes telescope slew time periods, the fitting uses an average response file made from multiple 5-s response files through out the slew time plus single time preiod for the non-slew times, and weighted by the total counts in the corresponding time period using addrmf. An average response file is needed becuase a spectral fit using the pre-slew DRM will introduce some errors in both a spectral shape and a normalization if the PHA file contains a lot of the slew/post-slew time interval.
- 3) For fits to more complicated models (e.g. a power-law over a cutoff power-law), the BAT team has decided to require a chi-square improvement of more than 6 for each extra dof.
Time averaged spectrum fit using the average DRM
Power-law model
Time interval is from   -7.940 sec. to    3.772 sec.

Spectral model in power-law:
------------------------------------------------------------
Parameters  : value       lower 90%   higher 90%
Photon index: -1.88697     ( -0.135232   0.131264 )
Norm@50keV  : 4.56756E-03    ( -0.000388535   0.000383116 )
------------------------------------------------------------
#Fit statistic : Chi-Squared =          49.71 using 59 PHA bins.
# Reduced chi-squared =         0.8722 for     57 degrees of freedom
# Null hypothesis probability =   7.424069e-01

Photon flux (15-150 keV)    in 11.71 sec: 0.651936 ( -0.046876  0.046904 ) ph/cm2/s
Energy fluence (15-150 keV)             : 4.91776e-07 ( -4.10969e-08  4.16662e-08 ) ergs/cm2
Cutoff power-law model
Time interval is from   -7.940 sec. to    3.772 sec.
Spectral model in the cutoff power-law:
------------------------------------------------------------
Parameters  : value       lower 90%   higher 90%
Photon index: -1.29384     ( -0.542652   0.624436 )
Epeak [keV] : 51.6540      ( -11.3913 73.7335 )
Norm@50keV  : 9.81822E-03    ( -0.00486011   0.0120564 )
------------------------------------------------------------
#Fit statistic : Chi-Squared =          46.19 using 59 PHA bins.
# Reduced chi-squared =         0.8249 for     56 degrees of freedom
# Null hypothesis probability =   8.219657e-01

Photon flux (15-150 keV)    in 11.71 sec: 0.634781 ( -0.049339  0.049343 ) ph/cm2/s
Energy fluence (15-150 keV)             : 4.62964e-07 ( -4.73151e-08  4.86551e-08 ) ergs/cm2
1-s peak spectrum fit
Power-law model
Time interval is from    1.736 sec. to    2.736 sec.

Spectral model in power-law:
------------------------------------------------------------
Parameters  : value       lower 90%   higher 90%
Photon index: -1.35791     ( -0.195974   0.195977 )
Norm@50keV  : 1.13097E-02    ( -0.00131682   0.00131204 )
------------------------------------------------------------
#Fit statistic : Chi-Squared =          44.84 using 59 PHA bins.
# Reduced chi-squared =         0.7866 for     57 degrees of freedom
# Null hypothesis probability =   8.786311e-01

Photon flux (15-150 keV)    in 1 sec: 1.36475 ( -0.15813  0.15829 ) ph/cm2/s
Energy fluence (15-150 keV)             : 1.10278e-07 ( -1.43556e-08  1.45236e-08 ) ergs/cm2
Cutoff power-law model
Time interval is from    1.736 sec. to    2.736 sec.
Spectral model in the cutoff power-law:
------------------------------------------------------------
Parameters  : value       lower 90%   higher 90%
Photon index: -0.946622     ( -0.512143   0.900917 )
Epeak [keV] : 126.855      ( -60.5327 -126.875 )
Norm@50keV  : 1.83879E-02    ( -0.00813626   0.0337032 )
------------------------------------------------------------
#Fit statistic : Chi-Squared =          44.00 using 59 PHA bins.
# Reduced chi-squared =         0.7857 for     56 degrees of freedom
# Null hypothesis probability =   8.774929e-01

Photon flux (15-150 keV)    in 1 sec: 1.34379 ( -0.16357  0.16305 ) ph/cm2/s
Energy fluence (15-150 keV)             : 1.06574e-07 ( -1.62091e-08  1.60428e-08 ) ergs/cm2
Time-resolved spectra
Distribution
T90 vs. Hardness ratio plot
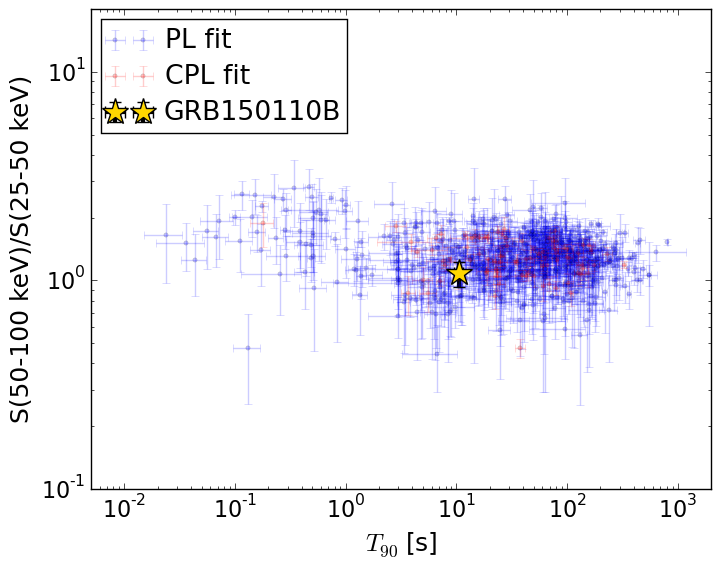
T90                                   = 10.58 sec.
Hardness ratio (energy fluence ratio) = 1.08153326449
S(15-50 keV) vs. S(50-150 keV) plot
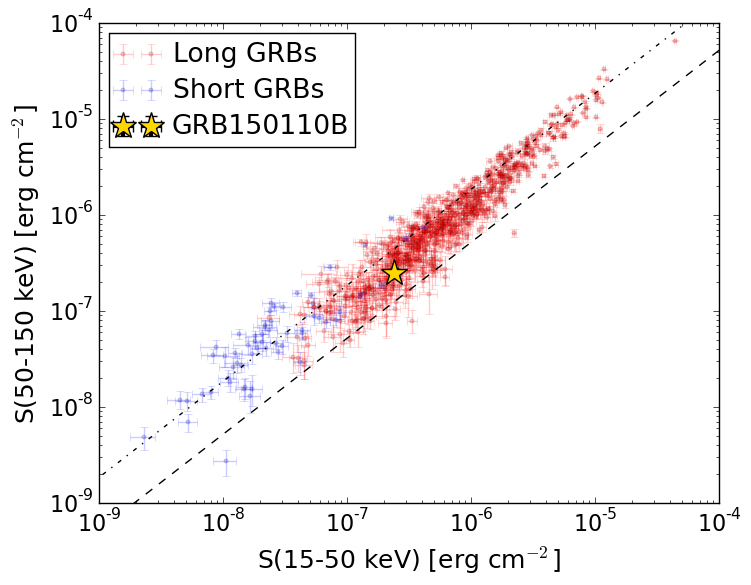
S(15-50 keV)  = 2.4116949e-07
S(50-150 keV) = 2.5061207e-07
The dash-dotted line and the dashed line traces the fluences calculated from the Band function with Epeak = 15 and 150 keV, respectively. Both lines assume a canonical values of alpha = -1 and beta = -2.5.
Mask shadow pattern
IMX = 2.082417405171726E-01, IMY = -1.007420848035764E-01
Spacecraft aspect plot
Bright source in the pre-burst/pre-slew/post-slew images
Pre-burst image of 15-350 keV band
Time interval of the image:
-239.072000 -7.940000

# RAcent  DECcent POSerr Theta    Phi  PeakCts   SNR AngSep     Name
#  [deg]    [deg]    ['] [deg]  [deg]                   [']
254.4765  35.3722    2.9  41.9   20.8   1.7946   4.0    2.0	Her X-1
268.2726  -1.4290   22.1  43.7  -37.9   0.1813   0.5    5.9	SW J1753.5-0127
288.7918  10.9322    0.7  20.7  -50.7   3.3020  15.6    0.9	GRS 1915+105
299.5873  35.2032    0.4   8.8   68.9   6.5573  30.5    0.2	Cyg X-1
308.1246  40.9526    1.9  14.7  102.5   1.3552   6.2    0.7	Cyg X-3
326.0878  38.4050    4.1  22.6  140.3   0.7052   2.8    6.4	Cyg X-2
329.7395  -2.6541    2.2  39.3 -138.6   1.6248   5.2 ------	UNKNOWN
305.0155  -3.3717    2.6  30.3  -97.4   1.3518   4.5 ------	UNKNOWN
354.4824  -4.2992    3.4  58.7 -159.3   4.9156   3.4  419.4	UNKNOWN
Pre-slew background subtracted image of 15-350 keV band
Time interval of the image:
-7.940000 3.772000

# RAcent  DECcent POSerr Theta    Phi  PeakCts   SNR AngSep     Name
#  [deg]    [deg]    ['] [deg]  [deg]                   [']
254.4088  35.1861    6.1  42.0   20.6  -0.1588  -1.9    9.7	Her X-1
268.3603  -1.5783    6.8  43.8  -38.2   0.1273   1.7    7.6	SW J1753.5-0127
288.7335  10.8525    3.9  20.8  -50.7  -0.1225  -3.0    6.8	GRS 1915+105
299.4592  35.2830    3.0   8.9   68.4   0.1545   3.9    8.1	Cyg X-1
308.0074  41.1122    6.1  14.9  102.0   0.0826   1.9   10.6	Cyg X-3
326.2841  38.4434    5.7  22.7  140.3  -0.0979  -2.0    9.0	Cyg X-2
289.3734  32.5282    0.5  13.0   25.8   0.9310  22.7 ------	UNKNOWN
348.6143   7.5567    2.4  47.4 -167.8   0.3569   4.8 ------	UNKNOWN
256.3014   1.6397    1.8  51.3  -24.6   0.6413   6.4 ------	UNKNOWN
Post-slew image of 15-350 keV band
Time interval of the image:
45.028600 962.975100

# RAcent  DECcent POSerr Theta    Phi  PeakCts   SNR AngSep     Name
#  [deg]    [deg]    ['] [deg]  [deg]                   [']
254.4730  35.3656    1.5  28.9   18.6   6.1520   7.8    1.6	Her X-1
268.3487  -1.4498    9.2  39.3  -52.4   1.4489   1.3    1.2	SW J1753.5-0127
288.7940  10.9596    0.7  21.6  -85.3  12.7646  17.1    0.9	GRS 1915+105
299.5864  35.2051    0.3   8.9  162.8  24.9694  43.1    0.3	Cyg X-1
308.0607  40.9494    1.5  17.1  148.4   5.2745   7.8    2.3	Cyg X-3
326.1675  38.2737    2.3  30.3  161.8   4.6631   5.1    2.9	Cyg X-2
301.8170  36.6465    2.6  11.0  157.8   2.5384   4.5 ------	UNKNOWN
347.7662   8.3058    4.0  59.0 -166.3  12.5741   2.9 ------	UNKNOWN
319.4540  -6.0340    3.1  48.0 -128.9   9.9584   3.8 ------	UNKNOWN