Analysis Summary
Notes:
- 1) No attempt has been made to eliminate the non-significant decimal places.
- 2) This batgrbproduct analysis is done using the HEASARC data.
- 3) This batgrbproduct analysis is using the flight position for the mask-weighting calculation.
======================================================================
BAT GRB EVENT DATA PROCESSING REPORT
Process Script Ver: batgrbproduct v2.46
Process Start Time: Wed Feb 11 07:43:34 EST 2015
Host Name: bat1
Current Working Dir: /local/data/bat1/alien/Swift_3rdBATcatalog/event/batevent_reproc/trigger627137
======================================================================
Trigger: 00627137 Segment: 000
BAT Trigger Time: 443415479.488 [s; MET]
Trigger Stop: 443415479.744 [s; MET]
UTC: 2015-01-20T02:57:46.413400 [includes UTCF correction]
Where From?: TDRSS position message
BAT
RA: 10.3079848360545 Dec: 33.9812565264564 [deg; J2000]
Catalogged Source?: NO
Point Source?: YES
GRB Indicated?: YES [ by BAT flight software ]
Image S/N Ratio: 7.25
Image Trigger?: NO
Rate S/N Ratio: 16.1554944214035 [ if not an image trigger ]
Image S/N Ratio: 7.25
Analysis Position: [ source = BAT ]
RA: 10.3079848360545 Dec: 33.9812565264564 [deg; J2000]
Refined Position: [ source = BAT pre-slew burst ]
RA: 10.3286724302852 Dec: 33.9801583936293 [deg; J2000]
{ 00h 41m 18.9s , +33d 58' 48.6" }
+/- 1.51256016579608 [arcmin] (estimated 90% radius based on SNR)
+/- 0.644721664444355 [arcmin] (formal 1-sigma fit error)
SNR: 16.8417032281939
Angular difference between the analysis and refined position is 1.031388 arcmin
Partial Coding Fraction: 0.71875 [ including projection effects ]
Duration
T90: 1.19599992036819 +/- 0.153674948708428
Measured from: -0.311999976634979
to: 0.883999943733215 [s; relative to TRIGTIME]
T50: 0.559999942779541 +/- 0.11207141806269
Measured from: 0.0320000052452087
to: 0.59199994802475 [s; relative to TRIGTIME]
Fluence
Peak Flux (peak 1 second)
Measured from: -0.0639999508857727
to: 0.936000049114227 [s; relative to TRIGTIME]
Total Fluence
Measured from: -0.403999984264374
to: 0.952000021934509 [s; relative to TRIGTIME]
Band 1 Band 2 Band 3 Band 4
15-25 25-50 50-100 100-350 keV
Total 0.083572 0.091116 0.062003 0.004866
0.007757 0.007979 0.007163 0.005841 [error]
Peak 0.067195 0.073615 0.052034 0.001745
0.006792 0.007060 0.006342 0.005051 [error]
[ fluence units of on-axis counts / fully illuminated detector ]
======================================================================
====== Table of the duration information =============================
Value tstart tstop
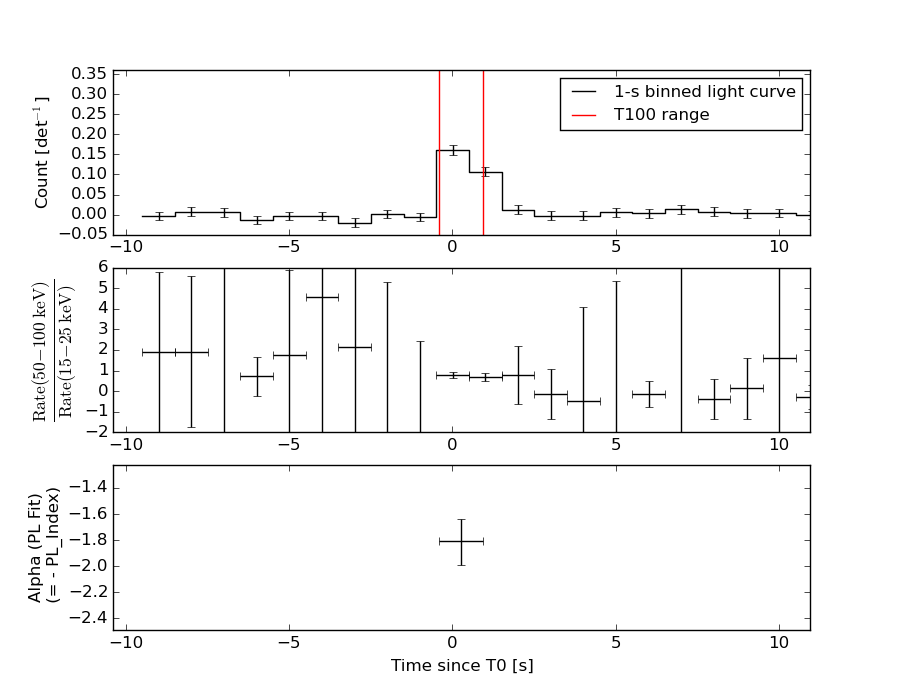
T100 1.356 -0.404 0.952
T90 1.196 -0.312 0.884
T50 0.560 0.032 0.592
Peak 1.000 -0.064 0.936
====== Spectral Analysis Summary =====================================
Model : spectral model: simple power-law (PL) and cutoff power-law (CPL)
Ph_index : photon index: E^{Ph_index}
Ph_90err : 90% error of the photon index
Epeak : Epeak in keV
Epeak_90err: 90% error of Epeak
Norm : normalization at 50 keV in both the PL model and CPL model
Nomr_90err : 90% error of the normalization
chi2 : Chi-Squared
dof : degree of freedo
=== Time-averaged spectral analysis ===
(Best model with acceptable fit: PL)
Model Ph_index Ph_90err_low Ph_90err_hi Epeak Epeak_90err_low Epeak_90err_hi Norm Nomr_90err_low Norm_90err_hi chi2 dof
PL -1.810 -0.182 0.176 - - - 1.16e-02 -1.29e-03 1.27e-03 47.090 57
CPL -1.814 -0.230 0.600 9999.360 N/A N/A 1.15e-02 N/A N/A 47.090 56
=== 1-s peak spectral analysis ===
(Best model with acceptable fit: PL)
Model Ph_index Ph_90err_low Ph_90err_hi Epeak Epeak_90err_low Epeak_90err_hi Norm Nomr_90err_low Norm_90err_hi chi2 dof
PL -1.794 -0.192 0.185 - - - 1.29e-02 -1.54e-03 1.50e-03 42.240 57
CPL -1.797 -0.189 0.650 9999.360 -9999.350 -9999.360 1.28e-02 -6.27e-03 1.60e-02 42.240 56
=== Fluence/Peak Flux Summary ===
Model Band1 Band2 Band3 Band4 Band5 Total
15-25 25-50 50-100 100-350 15-150 15-350 keV
Fluence PL 2.68e-08 4.08e-08 4.65e-08 1.01e-07 1.44e-07 2.15e-07 erg/cm2
90%_error_low -3.84e-09 -3.84e-09 -7.09e-09 -2.84e-08 -1.63e-08 -3.59e-08 erg/cm2
90%_error_hi 3.94e-09 3.85e-09 7.14e-09 3.50e-08 1.65e-08 4.12e-08 erg/cm2
Peak flux PL 7.02e-01 5.94e-01 3.43e-01 2.94e-01 1.77e+00 1.93e+00 ph/cm2/s
90%_error_low -1.09e-01 -6.05e-02 -5.38e-02 -8.20e-02 -1.80e-01 -1.98e-01 ph/cm2/s
90%_error_hi 1.12e-01 6.04e-02 5.38e-02 9.93e-02 1.80e-01 1.99e-01 ph/cm2/s
Fluence CPL 2.69e-08 4.06e-08 4.65e-08 1.03e-07 1.45e-07 2.16e-07 erg/cm2
90%_error_low -4.14e-09 -3.65e-09 -7.43e-09 -5.31e-08 -1.91e-08 -6.92e-08 erg/cm2
90%_error_hi 3.99e-09 2.62e-09 7.52e-09 1.85e-08 1.66e-08 2.07e-08 erg/cm2
Peak flux CPL 7.05e-01 5.93e-01 3.42e-01 2.98e-01 1.77e+00 1.93e+00 ph/cm2/s
90%_error_low -1.13e-01 -5.95e-02 -5.28e-02 N/A -1.84e-01 -2.64e-01 ph/cm2/s
90%_error_hi 1.12e-01 6.63e-02 5.50e-02 N/A 1.80e-01 1.95e-01 ph/cm2/s
======================================================================
Image
Pre-slew 15.0-350.0 keV image (Event data)
#   RAcent    DECcent   POSerr    Theta     Phi              Peak Cts       SNR   Name
   10.3287    33.9802   0.0114    29.6482  -143.7181         0.2466740     16.842 TRIG_00627137

Foreground time interval of the image:
 -0.404   0.952 (delta_t =   1.356 [sec])
Background time interval of the image:
-239.488  -0.404 (delta_t = 239.084 [sec])
Light Curves
Note: The mask-weighted lightcurves have units of either count/det or counts/sec/det, where a det is 0.4 x 0.4 = 0.16 sq cm.
Full-time range; 1 s binning
Other quick-look light curves:
- 64 ms binning (zoomed)
- 16 ms binning (zoomed)
- 8 ms binning (zoomed)
- 2 ms binning (zoomed)
- SN=5 or 10 s binning (full-time range)
- Raw light curve
Spectra
- 64 ms binning (zoomed)
- 16 ms binning (zoomed)
- 8 ms binning (zoomed)
- 2 ms binning (zoomed)
- SN=5 or 10 s binning (full-time range)
- Raw light curve
Spectra
Notes:
- 1) The fitting includes the systematic errors.
- 2) When the burst includes telescope slew time periods, the fitting uses an average response file made from multiple 5-s response files through out the slew time plus single time preiod for the non-slew times, and weighted by the total counts in the corresponding time period using addrmf. An average response file is needed becuase a spectral fit using the pre-slew DRM will introduce some errors in both a spectral shape and a normalization if the PHA file contains a lot of the slew/post-slew time interval.
- 3) For fits to more complicated models (e.g. a power-law over a cutoff power-law), the BAT team has decided to require a chi-square improvement of more than 6 for each extra dof.
Time averaged spectrum fit using the average DRM
Power-law model

Time interval is from   -0.404 sec. to    0.952 sec.

Spectral model in power-law:
------------------------------------------------------------
Parameters  : value       lower 90%   higher 90%
Photon index: -1.81034     ( -0.181887   0.175711 )
Norm@50keV  : 1.15570E-02    ( -0.0012939   0.00126674 )
------------------------------------------------------------
#Fit statistic : Chi-Squared =          47.09 using 59 PHA bins.
# Reduced chi-squared =         0.8261 for     57 degrees of freedom
# Null hypothesis probability =   8.225449e-01

Photon flux (15-150 keV)    in 1.356 sec: 1.59905 ( -0.15213  0.15222 ) ph/cm2/s
Energy fluence (15-150 keV)             : 1.44245e-07 ( -1.62534e-08  1.6505e-08 ) ergs/cm2
Cutoff power-law model
Time interval is from   -0.404 sec. to    0.952 sec.
Spectral model in the cutoff power-law:
------------------------------------------------------------
Parameters  : value       lower 90%   higher 90%
Photon index: -1.81367     ( -0.231553   0.598642 )
Epeak [keV] : 9999.36      (   )
Norm@50keV  : 1.15426E-02    (     )
------------------------------------------------------------
#Fit statistic : Chi-Squared =          47.09 using 59 PHA bins.
# Reduced chi-squared =         0.8409 for     56 degrees of freedom
# Null hypothesis probability =   7.960353e-01

Photon flux (15-150 keV)    in 1.356 sec: 1.60155 ( -0.16008  0.15262 ) ph/cm2/s
Energy fluence (15-150 keV)             : 1.44757e-07 ( -1.90761e-08  1.66044e-08 ) ergs/cm2
1-s peak spectrum fit
Power-law model

Time interval is from   -0.064 sec. to    0.936 sec.

Spectral model in power-law:
------------------------------------------------------------
Parameters  : value       lower 90%   higher 90%
Photon index: -1.79356     ( -0.19248   0.185342 )
Norm@50keV  : 1.28511E-02    ( -0.00153735   0.00150326 )
------------------------------------------------------------
#Fit statistic : Chi-Squared =          42.24 using 59 PHA bins.
# Reduced chi-squared =         0.7411 for     57 degrees of freedom
# Null hypothesis probability =   9.278323e-01

Photon flux (15-150 keV)    in 1 sec: 1.76654 ( -0.17987  0.17996 ) ph/cm2/s
Energy fluence (15-150 keV)             : 1.18353e-07 ( -1.43179e-08  1.45455e-08 ) ergs/cm2
Cutoff power-law model
Time interval is from   -0.064 sec. to    0.936 sec.
Spectral model in the cutoff power-law:
------------------------------------------------------------
Parameters  : value       lower 90%   higher 90%
Photon index: -1.797     ( -0.190788   0.64814 )
Epeak [keV] : 9999.36      ( -9999.35 -9999.36 )
Norm@50keV  : 1.28349E-02    ( -0.00628587   0.0160024 )
------------------------------------------------------------
#Fit statistic : Chi-Squared =          42.24 using 59 PHA bins.
# Reduced chi-squared =         0.7543 for     56 degrees of freedom
# Null hypothesis probability =   9.131550e-01

Photon flux (15-150 keV)    in 1 sec: 1.76785 ( -0.18369  0.17968 ) ph/cm2/s
Energy fluence (15-150 keV)             : 1.18738e-07 ( -1.65923e-08  1.14167e-08 ) ergs/cm2
Time-resolved spectra
Distribution
T90 vs. Hardness ratio plot
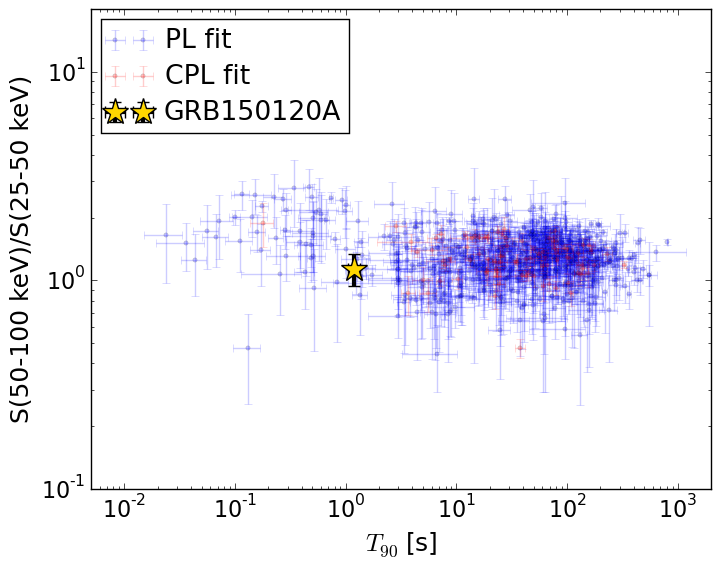
T90                                   = 1.196 sec.
Hardness ratio (energy fluence ratio) = 1.14051210408
S(15-50 keV) vs. S(50-150 keV) plot
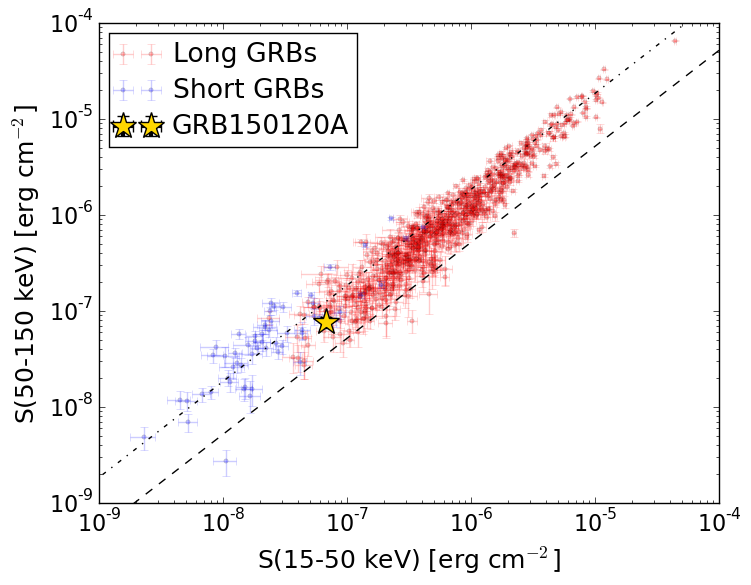
S(15-50 keV)  = 6.757024e-08
S(50-150 keV) = 7.66731e-08
The dash-dotted line and the dashed line traces the fluences calculated from the Band function with Epeak = 15 and 150 keV, respectively. Both lines assume a canonical values of alpha = -1 and beta = -2.5.
Mask shadow pattern
IMX = -4.588351045099284E-01, IMY = 3.368247373716360E-01
Spacecraft aspect plot
Bright source in the pre-burst/pre-slew/post-slew images
Pre-burst image of 15-350 keV band
Time interval of the image:
-239.488000 -0.404000

# RAcent  DECcent POSerr Theta    Phi  PeakCts   SNR AngSep     Name
#  [deg]    [deg]    ['] [deg]  [deg]                   [']
108.4751  55.1024    2.9  40.5   69.1   2.6193   4.0 ------	UNKNOWN
 75.7641  41.2146    2.8  35.6  110.4   1.6672   4.1 ------	UNKNOWN
163.8134  63.3381    2.9  50.8   31.5   4.2473   3.9 ------	UNKNOWN
286.0614  51.0506    3.4  50.9  -44.5   3.1512   3.4 ------	UNKNOWN
Pre-slew background subtracted image of 15-350 keV band
Time interval of the image:
-0.404000 0.952000

# RAcent  DECcent POSerr Theta    Phi  PeakCts   SNR AngSep     Name
#  [deg]    [deg]    ['] [deg]  [deg]                   [']
 63.6726  28.5954    2.2  41.2  134.7   0.1597   5.1 ------	UNKNOWN
 10.3287  33.9802    0.7  29.6 -143.7   0.2467  16.8 ------	UNKNOWN
Post-slew image of 15-350 keV band
Time interval of the image:
60.012600 951.612590

# RAcent  DECcent POSerr Theta    Phi  PeakCts   SNR AngSep     Name
#  [deg]    [deg]    ['] [deg]  [deg]                   [']
308.2540  40.7948    4.8  48.7  -33.9  -3.3332  -2.4   11.5	Cyg X-3
326.1607  38.4284    3.8  35.6  -40.8   2.2703   3.0    6.4	Cyg X-2
 33.3273  30.9798    3.2  19.6  121.5   1.8118   3.6 ------	UNKNOWN
 39.4941  -2.4553    2.6  45.6  166.0   5.1768   4.5 ------	UNKNOWN
 40.2452 -15.1838    2.8  56.8  173.9  12.0407   4.2 ------	UNKNOWN
 13.3758  47.5355    2.7  13.7   37.7   2.0835   4.3 ------	UNKNOWN
 32.1173 -20.4664    2.5  58.3 -175.2  12.4038   4.5 ------	UNKNOWN
294.4851  61.6310    3.2  54.0   -5.8   5.7764   3.6 ------	UNKNOWN
322.1646  22.0135    3.7  43.8  -63.9   8.8235   3.2 ------	UNKNOWN
353.8118 -11.3685    2.2  48.0 -129.0  12.7139   5.1 ------	UNKNOWN