Analysis Summary
Notes:
- 1) No attempt has been made to eliminate the non-significant decimal places.
- 2) This batgrbproduct analysis is done using the HEASARC data.
- 3) This batgrbproduct analysis is using the flight position for the mask-weighting calculation.
======================================================================
BAT GRB EVENT DATA PROCESSING REPORT
Process Script Ver: batgrbproduct v2.46
Process Start Time: Thu Dec 17 11:51:11 EST 2015
Host Name: bat1
Current Working Dir: /local/data/bat1/alien/Swift_3rdBATcatalog/event/batevent_reproc/trigger629302
======================================================================
Trigger: 00629302 Segment: 000
BAT Trigger Time: 444491232.832 [s; MET]
Trigger Stop: 444491233.856 [s; MET]
UTC: 2015-02-01T13:46:59.703120 [includes UTCF correction]
Where From?: TDRSS position message
BAT
RA: 11.8321794763577 Dec: -37.625024756673 [deg; J2000]
Catalogged Source?: NO
Point Source?: YES
GRB Indicated?: YES [ by BAT flight software ]
Image S/N Ratio: 6.54
Image Trigger?: NO
Rate S/N Ratio: 204.347742830695 [ if not an image trigger ]
Image S/N Ratio: 6.54
Analysis Position: [ source = BAT ]
RA: 11.8321794763577 Dec: -37.625024756673 [deg; J2000]
Refined Position: [ source = BAT pre-slew burst ]
RA: 11.8205780215697 Dec: -37.620817654918 [deg; J2000]
{ 00h 47m 16.9s , -37d 37' 14.9" }
+/- 1.70021337656754 [arcmin] (estimated 90% radius based on SNR)
+/- 0.731045387137309 [arcmin] (formal 1-sigma fit error)
SNR: 14.2504233843337
Angular difference between the analysis and refined position is 0.606372 arcmin
Partial Coding Fraction: 0.03417969 [ including projection effects ]
Duration
T90: 26.5919999480247 +/- 4.78816578195441
Measured from: -2.77200001478195
to: 23.8199999332428 [s; relative to TRIGTIME]
T50: 6.78399991989136 +/- 0.879945443259033
Measured from: -0.944000005722046
to: 5.83999991416931 [s; relative to TRIGTIME]
======================================================================
====== Table of the duration information =============================
Value tstart tstop
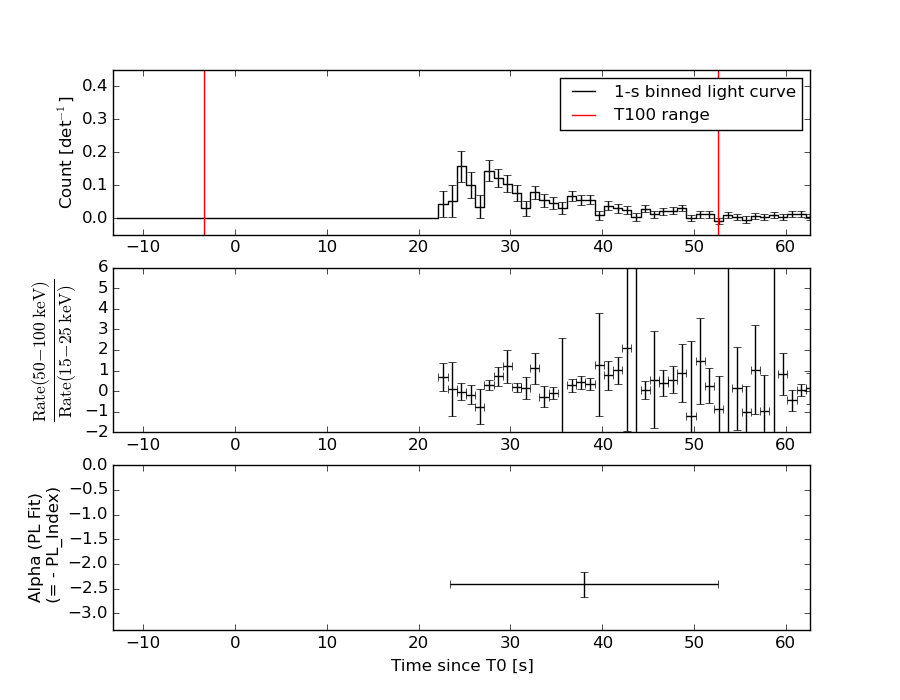
T100 55.952 -3.328 52.624
T90 26.592 -2.772 23.820
T50 6.784 -0.944 5.840
Peak 1.000 -0.004 0.996
====== Spectral Analysis Summary =====================================
Model : spectral model: simple power-law (PL) and cutoff power-law (CPL)
Ph_index : photon index: E^{Ph_index}
Ph_90err : 90% error of the photon index
Epeak : Epeak in keV
Epeak_90err: 90% error of Epeak
Norm : normalization at 50 keV in both the PL model and CPL model
Nomr_90err : 90% error of the normalization
chi2 : Chi-Squared
dof : degree of freedo
=== Time-averaged spectral analysis ===
(Best model with acceptable fit: PL)
Model Ph_index Ph_90err_low Ph_90err_hi Epeak Epeak_90err_low Epeak_90err_hi Norm Nomr_90err_low Norm_90err_hi chi2 dof
PL -2.350 -0.272 0.247 - - - 2.69e-03 -5.26e-04 5.17e-04 52.970 57
CPL -0.976 -0.905 1.679 27.339 -26.960 8.798 1.93e-02 -1.93e-02 2.11e-01 49.190 56
=== 1-s peak spectral analysis ===
(Best model with acceptable fit: N/A)
Model Ph_index Ph_90err_low Ph_90err_hi Epeak Epeak_90err_low Epeak_90err_hi Norm Nomr_90err_low Norm_90err_hi chi2 dof
PL N/A N/A N/A - - - N/A N/A N/A N/A N/A
CPL N/A N/A N/A N/A N/A N/A N/A N/A N/A N/A N/A
=== Fluence/Peak Flux Summary ===
Model Band1 Band2 Band3 Band4 Band5 Total
15-25 25-50 50-100 100-350 15-150 15-350 keV
Fluence PL 2.30e-07 2.53e-07 1.99e-07 2.57e-07 7.78e-07 9.40e-07 erg/cm2
90%_error_low -3.73e-08 -3.57e-08 -5.08e-08 -1.06e-07 -1.22e-07 -1.85e-07 erg/cm2
90%_error_hi 3.79e-08 3.51e-08 5.39e-08 1.48e-07 1.25e-07 2.15e-07 erg/cm2
Peak flux PL N/A N/A N/A N/A N/A N/A ph/cm2/s
Image
15.0-350.0 keV image (Event data with DETECTION mask)
#   RAcent    DECcent   POSerr    Theta     Phi              Peak Cts       SNR   Name
   11.8206   -37.6208   0.0134    46.4541   -63.7561        22.6352214     14.250 TRIG_00629302

Foreground time interval of the image:
 -3.328  11.469 (delta_t =  14.797 [sec])
Background time interval of the image:
-239.832  -3.328 (delta_t = 236.504 [sec])
Light Curves
Note: The mask-weighted lightcurves have units of either count/det or counts/sec/det, where a det is 0.4 x 0.4 = 0.16 sq cm.
Full-time range; 1 s binning
Other quick-look light curves:
- 64 ms binning (zoomed)
- 16 ms binning (zoomed)
- 8 ms binning (zoomed)
- 2 ms binning (zoomed)
- SN=5 or 10 s binning (full-time range)
- Raw light curve
Spectra
- 64 ms binning (zoomed)
- 16 ms binning (zoomed)
- 8 ms binning (zoomed)
- 2 ms binning (zoomed)
- SN=5 or 10 s binning (full-time range)
- Raw light curve
Spectra
Notes:
- 1) The fitting includes the systematic errors.
- 2) When the burst includes telescope slew time periods, the fitting uses an average response file made from multiple 5-s response files through out the slew time plus single time preiod for the non-slew times, and weighted by the total counts in the corresponding time period using addrmf. An average response file is needed becuase a spectral fit using the pre-slew DRM will introduce some errors in both a spectral shape and a normalization if the PHA file contains a lot of the slew/post-slew time interval.
- 3) For fits to more complicated models (e.g. a power-law over a cutoff power-law), the BAT team has decided to require a chi-square improvement of more than 6 for each extra dof.
Time averaged spectrum fit using the average DRM
Power-law model
Time interval is from   22.592 sec. to   52.624 sec.

Spectral model in power-law:
------------------------------------------------------------
Parameters  : value       lower 90%   higher 90%
Photon index: -2.34999     ( -0.271947   0.246928 )
Norm@50keV  : 2.68540E-03    ( -0.000526324   0.000517181 )
------------------------------------------------------------
#Fit statistic : Chi-Squared =          52.97 using 59 PHA bins.
# Reduced chi-squared =         0.9293 for     57 degrees of freedom
# Null hypothesis probability =   6.270367e-01

Photon flux (15-150 keV)    in 30.03 sec: 0.482764 ( -0.062334  0.062334 ) ph/cm2/s
Energy fluence (15-150 keV)             : 7.78351e-07 ( -1.21653e-07  1.25456e-07 ) ergs/cm2
Cutoff power-law model
Time interval is from   22.592 sec. to   52.624 sec.
Spectral model in the cutoff power-law:
------------------------------------------------------------
Parameters  : value       lower 90%   higher 90%
Photon index: -0.976336     ( -0.905442   1.67935 )
Epeak [keV] : 27.3386      ( -26.9599 8.79762 )
Norm@50keV  : 1.93182E-02    ( -0.0193181   0.211489 )
------------------------------------------------------------
#Fit statistic : Chi-Squared =          49.19 using 59 PHA bins.
# Reduced chi-squared =         0.8784 for     56 degrees of freedom
# Null hypothesis probability =   7.283677e-01

Photon flux (15-150 keV)    in 30.03 sec: 0.467359 ( -0.063053  0.063457 ) ph/cm2/s
Energy fluence (15-150 keV)             : 6.97471e-07 ( -1.17247e-07  1.35722e-07 ) ergs/cm2
1-s peak spectrum fit
1-s peak spectrum unavailable, likely because there are no event data in the 1-s peak range.
Time-resolved spectra
Distribution
T90 vs. Hardness ratio plot
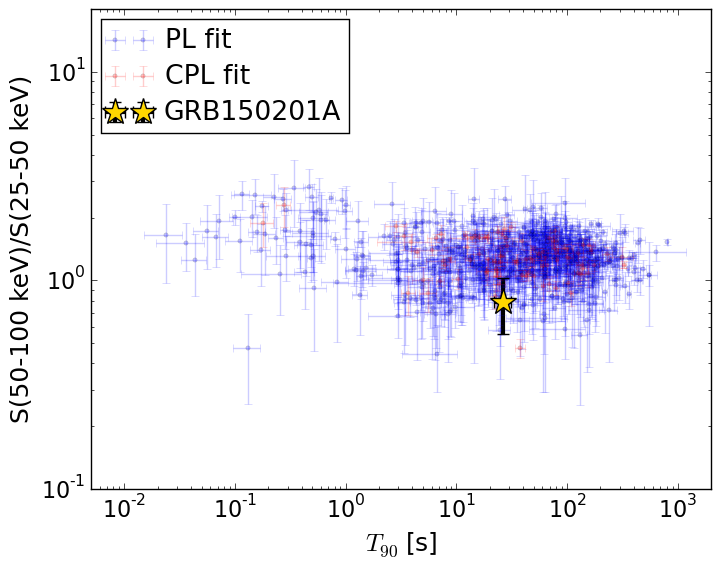
T90                                   = 26.592 sec.
Hardness ratio (energy fluence ratio) = 0.784639298893
S(15-50 keV) vs. S(50-150 keV) plot
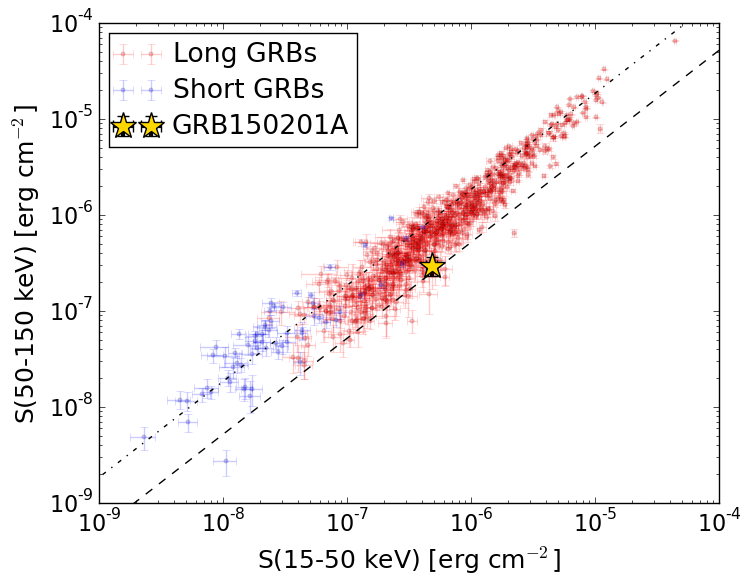
S(15-50 keV)  = 4.837217e-07
S(50-150 keV) = 2.9464259e-07
The dash-dotted line and the dashed line traces the fluences calculated from the Band function with Epeak = 15 and 150 keV, respectively. Both lines assume a canonical values of alpha = -1 and beta = -2.5.
Mask shadow pattern (with DETECTION mask)
IMX = 4.652280271245856E-01, IMY = 9.436413695620746E-01
Spacecraft aspect plot
Bright source in the event data image
Event data image of 15-350 keV band
Time interval of the image:
-3.328000 11.468580

# RAcent  DECcent POSerr Theta    Phi  PeakCts   SNR AngSep     Name
#  [deg]    [deg]    ['] [deg]  [deg]                   [']
135.3554 -40.3769    0.0  41.9  137.8   0.0826   0.6   13.3	Vela X-1
170.6851 -60.6323    0.0  50.5  177.6  -0.2488  -1.1   10.9	Cen X-3
186.7517 -62.8401    3.9  55.2 -174.4   0.8958   3.0    4.9	GX 301-2
 11.8206 -37.6208    0.9  46.5  -63.8  22.6448  13.4 ------	UNKNOWN
Webpage updated on:
Thu Dec 17 12:25:35 EST 2015