Analysis Summary
Notes:
- 1) No attempt has been made to eliminate the non-significant decimal places.
- 2) This batgrbproduct analysis is done using the HEASARC data.
- 3) This batgrbproduct analysis is using the flight position for the mask-weighting calculation.
======================================================================
BAT GRB EVENT DATA PROCESSING REPORT
Process Script Ver: batgrbproduct v2.46
Process Start Time: Tue Feb 17 21:25:53 EST 2015
Host Name: bat1
Current Working Dir: /local/data/bat1/alien/Swift_3rdBATcatalog/event/batevent_reproc/trigger629578
======================================================================
Trigger: 00629578 Segment: 000
BAT Trigger Time: 444629360.64 [s; MET]
Trigger Stop: 444629361.664 [s; MET]
UTC: 2015-02-03T04:09:07.504140 [includes UTCF correction]
Where From?: TDRSS position message
BAT
RA: 98.4145772413157 Dec: 6.96780251737358 [deg; J2000]
Catalogged Source?: NO
Point Source?: YES
GRB Indicated?: YES [ by BAT flight software ]
Image S/N Ratio: 7.19
Image Trigger?: NO
Rate S/N Ratio: 13.856406460551 [ if not an image trigger ]
Image S/N Ratio: 7.19
Analysis Position: [ source = BAT ]
RA: 98.4145772413157 Dec: 6.96780251737358 [deg; J2000]
Refined Position: [ source = BAT pre-slew burst ]
RA: 98.3948712817831 Dec: 6.9510764827439 [deg; J2000]
{ 06h 33m 34.8s , +06d 57' 03.9" }
+/- 1.11590455607559 [arcmin] (estimated 90% radius based on SNR)
+/- 0.387282757125004 [arcmin] (formal 1-sigma fit error)
SNR: 26.0063699387057
Angular difference between the analysis and refined position is 1.544209 arcmin
Partial Coding Fraction: 0.84375 [ including projection effects ]
Duration
T90: 24.4359999299049 +/- 2.7678207947542
Measured from: 0.396000027656555
to: 24.8319999575615 [s; relative to TRIGTIME]
T50: 13.2559999227524 +/- 1.49024562519048
Measured from: 5.28400003910065
to: 18.539999961853 [s; relative to TRIGTIME]
Fluence
Peak Flux (peak 1 second)
Measured from: 16.772000014782
to: 17.772000014782 [s; relative to TRIGTIME]
Total Fluence
Measured from: -0.803999960422516
to: 28.7240000367165 [s; relative to TRIGTIME]
Band 1 Band 2 Band 3 Band 4
15-25 25-50 50-100 100-350 keV
Total 0.561944 0.668993 0.360419 0.082240
0.032057 0.032469 0.027036 0.021738 [error]
Peak 0.034862 0.049194 0.025098 0.004147
0.006059 0.006359 0.005213 0.004077 [error]
[ fluence units of on-axis counts / fully illuminated detector ]
======================================================================
====== Table of the duration information =============================
Value tstart tstop
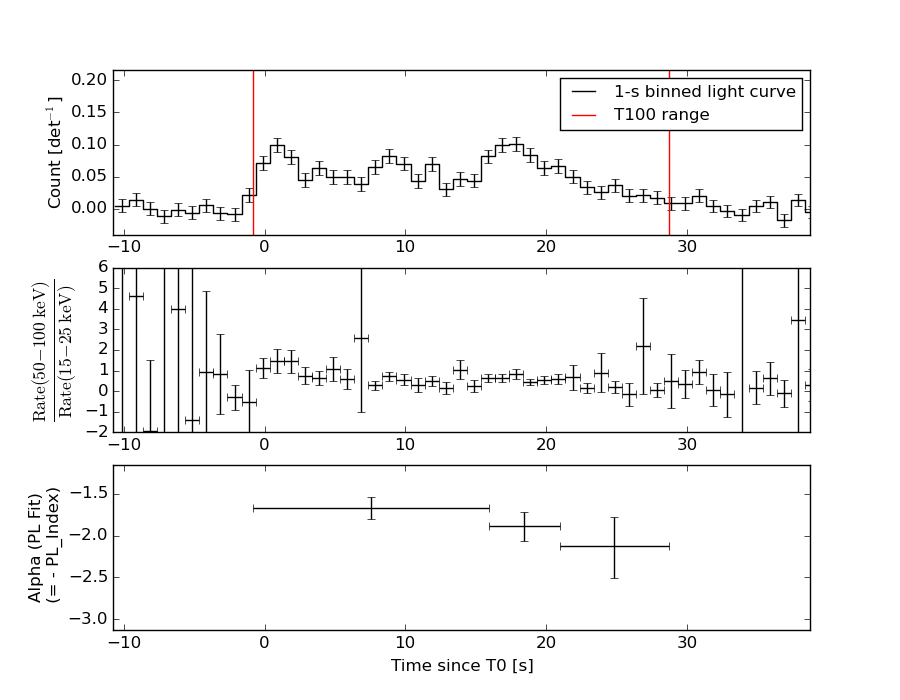
T100 29.528 -0.804 28.724
T90 24.436 0.396 24.832
T50 13.256 5.284 18.540
Peak 1.000 16.772 17.772
====== Spectral Analysis Summary =====================================
Model : spectral model: simple power-law (PL) and cutoff power-law (CPL)
Ph_index : photon index: E^{Ph_index}
Ph_90err : 90% error of the photon index
Epeak : Epeak in keV
Epeak_90err: 90% error of Epeak
Norm : normalization at 50 keV in both the PL model and CPL model
Nomr_90err : 90% error of the normalization
chi2 : Chi-Squared
dof : degree of freedo
=== Time-averaged spectral analysis ===
(Best model with acceptable fit: PL)
Model Ph_index Ph_90err_low Ph_90err_hi Epeak Epeak_90err_low Epeak_90err_hi Norm Nomr_90err_low Norm_90err_hi chi2 dof
PL -1.810 -0.111 0.109 - - - 3.44e-03 -2.25e-04 2.23e-04 47.400 57
CPL -1.611 -0.211 0.445 89.610 -32.258 -89.610 4.41e-03 -1.16e-03 3.18e-03 46.710 56
=== 1-s peak spectral analysis ===
(Best model with acceptable fit: PL)
Model Ph_index Ph_90err_low Ph_90err_hi Epeak Epeak_90err_low Epeak_90err_hi Norm Nomr_90err_low Norm_90err_hi chi2 dof
PL -1.753 -0.277 0.262 - - - 6.79e-03 -1.24e-03 1.21e-03 56.600 57
CPL -0.885 -1.015 1.459 56.739 -17.222 -56.739 2.08e-02 -2.08e-02 1.18e-01 54.740 56
=== Fluence/Peak Flux Summary ===
Model Band1 Band2 Band3 Band4 Band5 Total
15-25 25-50 50-100 100-350 15-150 15-350 keV
Fluence PL 1.74e-07 2.64e-07 3.02e-07 6.57e-07 9.36e-07 1.40e-06 erg/cm2
90%_error_low -1.63e-08 -1.56e-08 -2.69e-08 -1.14e-07 -6.21e-08 -1.40e-07 erg/cm2
90%_error_hi 1.67e-08 1.56e-08 2.70e-08 1.30e-07 6.26e-08 1.52e-07 erg/cm2
Peak flux PL 3.57e-01 3.09e-01 1.83e-01 1.64e-01 9.19e-01 1.01e+00 ph/cm2/s
90%_error_low -8.06e-02 -4.90e-02 -4.24e-02 -6.28e-02 -1.45e-01 -1.63e-01 ph/cm2/s
90%_error_hi 8.43e-02 4.89e-02 4.26e-02 8.23e-02 1.45e-01 1.64e-01 ph/cm2/s
Fluence CPL 1.69e-07 2.70e-07 3.02e-07 4.65e-07 9.17e-07 1.21e-06 erg/cm2
90%_error_low -1.88e-08 -1.89e-08 -2.78e-08 -2.27e-07 -7.23e-08 -2.40e-07 erg/cm2
90%_error_hi 1.89e-08 1.99e-08 2.79e-08 2.25e-07 7.23e-08 2.48e-07 erg/cm2
Peak flux CPL 3.24e-01 3.43e-01 1.88e-01 5.96e-02 8.98e-01 9.15e-01 ph/cm2/s
90%_error_low -9.30e-02 -6.46e-02 -5.00e-02 -5.96e-02 -1.48e-01 -1.58e-01 ph/cm2/s
90%_error_hi 9.41e-02 6.93e-02 4.84e-02 1.32e-01 1.48e-01 1.89e-01 ph/cm2/s
======================================================================
Image
Pre-slew 15.0-350.0 keV image (Event data)
#   RAcent    DECcent   POSerr    Theta     Phi              Peak Cts       SNR   Name
   98.3949     6.9511   0.0074    20.7333   148.5971         1.3842848     26.006 TRIG_00629578

Foreground time interval of the image:
 -0.804  20.061 (delta_t =  20.865 [sec])
Background time interval of the image:
-119.640  -0.804 (delta_t = 118.836 [sec])
Light Curves
Note: The mask-weighted lightcurves have units of either count/det or counts/sec/det, where a det is 0.4 x 0.4 = 0.16 sq cm.
Full-time range; 1 s binning
Other quick-look light curves:
- 64 ms binning (zoomed)
- 16 ms binning (zoomed)
- 8 ms binning (zoomed)
- 2 ms binning (zoomed)
- SN=5 or 10 s binning (full-time range)
- Raw light curve
Spectra
- 64 ms binning (zoomed)
- 16 ms binning (zoomed)
- 8 ms binning (zoomed)
- 2 ms binning (zoomed)
- SN=5 or 10 s binning (full-time range)
- Raw light curve
Spectra
Notes:
- 1) The fitting includes the systematic errors.
- 2) When the burst includes telescope slew time periods, the fitting uses an average response file made from multiple 5-s response files through out the slew time plus single time preiod for the non-slew times, and weighted by the total counts in the corresponding time period using addrmf. An average response file is needed becuase a spectral fit using the pre-slew DRM will introduce some errors in both a spectral shape and a normalization if the PHA file contains a lot of the slew/post-slew time interval.
- 3) For fits to more complicated models (e.g. a power-law over a cutoff power-law), the BAT team has decided to require a chi-square improvement of more than 6 for each extra dof.
Time averaged spectrum fit using the average DRM
Power-law model
Time interval is from   -0.804 sec. to   28.724 sec.

Spectral model in power-law:
------------------------------------------------------------
Parameters  : value       lower 90%   higher 90%
Photon index: -1.81     ( -0.111008   0.109235 )
Norm@50keV  : 3.44253E-03    ( -0.000225158   0.000223035 )
------------------------------------------------------------
#Fit statistic : Chi-Squared =          47.40 using 59 PHA bins.
# Reduced chi-squared =         0.8316 for     57 degrees of freedom
# Null hypothesis probability =   8.137181e-01

Photon flux (15-150 keV)    in 29.53 sec: 0.476251 ( -0.028643  0.028682 ) ph/cm2/s
Energy fluence (15-150 keV)             : 9.35693e-07 ( -6.20517e-08  6.25891e-08 ) ergs/cm2
Cutoff power-law model
Time interval is from   -0.804 sec. to   28.724 sec.
Spectral model in the cutoff power-law:
------------------------------------------------------------
Parameters  : value       lower 90%   higher 90%
Photon index: -1.61104     ( -0.210637   0.445195 )
Epeak [keV] : 89.6103      ( -32.2589 -89.6107 )
Norm@50keV  : 4.40758E-03    ( -0.00115635   0.0031757 )
------------------------------------------------------------
#Fit statistic : Chi-Squared =          46.71 using 59 PHA bins.
# Reduced chi-squared =         0.8341 for     56 degrees of freedom
# Null hypothesis probability =   8.072900e-01

Photon flux (15-150 keV)    in 29.53 sec: 0.471347 ( -0.030315  0.030289 ) ph/cm2/s
Energy fluence (15-150 keV)             : 9.17367e-07 ( -7.23346e-08  7.22871e-08 ) ergs/cm2
1-s peak spectrum fit
Power-law model
Time interval is from   16.772 sec. to   17.772 sec.

Spectral model in power-law:
------------------------------------------------------------
Parameters  : value       lower 90%   higher 90%
Photon index: -1.75268     ( -0.277169   0.26219 )
Norm@50keV  : 6.79267E-03    ( -0.00123847   0.00120833 )
------------------------------------------------------------
#Fit statistic : Chi-Squared =          56.60 using 59 PHA bins.
# Reduced chi-squared =         0.9930 for     57 degrees of freedom
# Null hypothesis probability =   4.899358e-01

Photon flux (15-150 keV)    in 1 sec: 0.919435 ( -0.1453  0.145335 ) ph/cm2/s
Energy fluence (15-150 keV)             : 6.26787e-08 ( -1.15988e-08  1.18528e-08 ) ergs/cm2
Cutoff power-law model
Time interval is from   16.772 sec. to   17.772 sec.
Spectral model in the cutoff power-law:
------------------------------------------------------------
Parameters  : value       lower 90%   higher 90%
Photon index: -0.885249     ( -1.01492   1.45856 )
Epeak [keV] : 56.7388      ( -17.2221 -56.7388 )
Norm@50keV  : 2.07868E-02    ( -0.0207868   0.118489 )
------------------------------------------------------------
#Fit statistic : Chi-Squared =          54.74 using 59 PHA bins.
# Reduced chi-squared =         0.9776 for     56 degrees of freedom
# Null hypothesis probability =   5.224987e-01

Photon flux (15-150 keV)    in 1 sec: 0.898229 ( -0.147872  0.147831 ) ph/cm2/s
Energy fluence (15-150 keV)             : 5.83324e-08 ( -1.2276e-08  1.29792e-08 ) ergs/cm2
Time-resolved spectra
Distribution
T90 vs. Hardness ratio plot
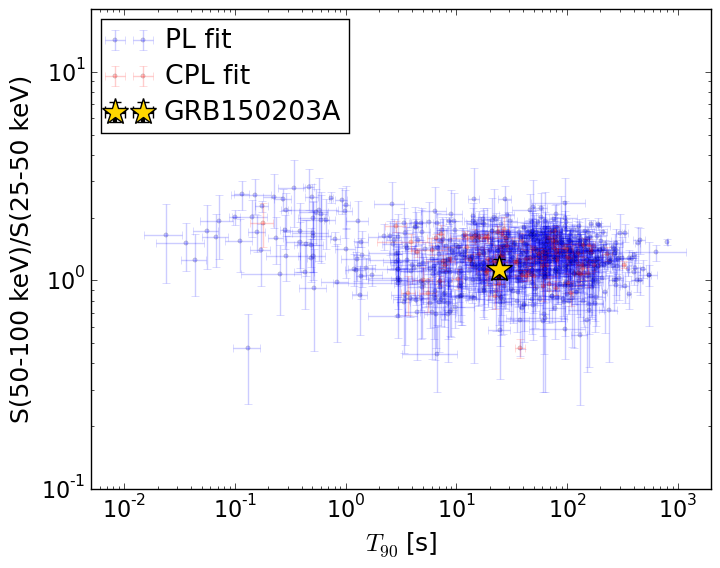
T90                                   = 24.436 sec.
Hardness ratio (energy fluence ratio) = 1.14080096079
S(15-50 keV) vs. S(50-150 keV) plot
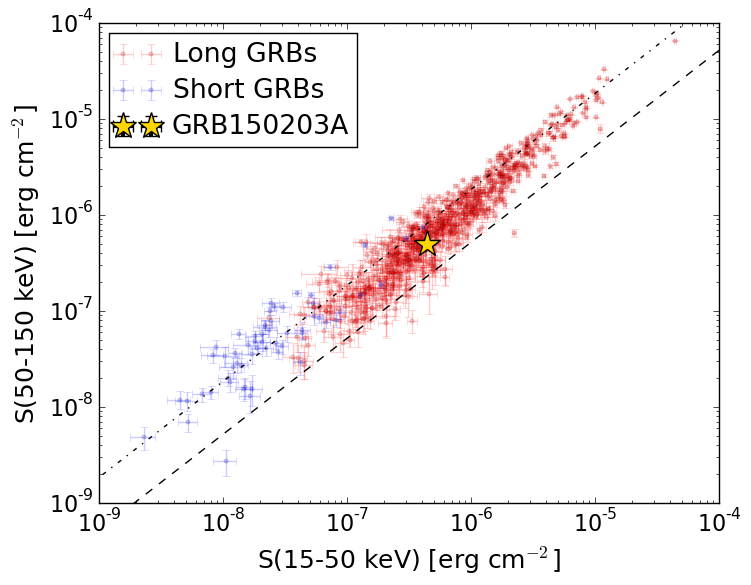
S(15-50 keV)  = 4.382354e-07
S(50-150 keV) = 4.974715e-07
The dash-dotted line and the dashed line traces the fluences calculated from the Band function with Epeak = 15 and 150 keV, respectively. Both lines assume a canonical values of alpha = -1 and beta = -2.5.
Mask shadow pattern
IMX = -3.230877964462633E-01, IMY = -1.972357388319213E-01
Spacecraft aspect plot
Bright source in the pre-burst/pre-slew/post-slew images
Pre-burst image of 15-350 keV band
Time interval of the image:
-119.640000 -0.804000

# RAcent  DECcent POSerr Theta    Phi  PeakCts   SNR AngSep     Name
#  [deg]    [deg]    ['] [deg]  [deg]                   [']
 83.6613  22.0330    0.3   0.0   87.3   5.0002  43.2    1.9	Crab
110.9537  24.5736    2.7  25.2   93.0   0.7037   4.2 ------	UNKNOWN
 84.7452  26.3256    0.9   4.4   27.1   1.5542  12.6 ------	UNKNOWN
Pre-slew background subtracted image of 15-350 keV band
Time interval of the image:
-0.804000 20.060600

# RAcent  DECcent POSerr Theta    Phi  PeakCts   SNR AngSep     Name
#  [deg]    [deg]    ['] [deg]  [deg]                   [']
 83.5383  21.9260    4.4   0.1 -122.7   0.1216   2.6    7.5	Crab
122.0222   7.9792    2.0  39.5  119.0   0.9148   5.6 ------	UNKNOWN
 98.3949   6.9511    0.4  20.7  148.6   1.3842  26.0 ------	UNKNOWN
 74.9797  10.0263    2.7  14.6 -129.8   0.2185   4.4 ------	UNKNOWN
Post-slew image of 15-350 keV band
Time interval of the image:
63.260580 1190.439600

# RAcent  DECcent POSerr Theta    Phi  PeakCts   SNR AngSep     Name
#  [deg]    [deg]    ['] [deg]  [deg]                   [']
 83.6342  22.0187    0.2  20.7  -23.6  46.4916  66.9    0.3	Crab
126.9250 -43.6270    3.0  56.8  173.9  16.0683   3.8 ------	UNKNOWN
103.0736  19.9358    2.7  13.7   37.1   2.7952   4.3 ------	UNKNOWN
102.9902 -10.2670    2.8  17.8 -176.6   2.6607   4.1 ------	UNKNOWN
118.1328 -44.0618    3.8  54.1 -179.2   8.0858   3.1 ------	UNKNOWN
 84.7342  26.3177    0.5  23.3  -14.1  17.0734  22.1 ------	UNKNOWN
109.6577 -49.5359    3.4  57.4 -170.4  10.7976   3.4 ------	UNKNOWN