Analysis Summary
Notes:
- 1) No attempt has been made to eliminate the non-significant decimal places.
- 2) This batgrbproduct analysis is done using the HEASARC data.
- 3) This batgrbproduct analysis is using the flight position for the mask-weighting calculation.
==========================================================================
           BAT GROUND-DETECTED GRB DATA PROCESSING REPORT
            (This burst occurred during telescope slew)
    Process Script Ver: batgrbproduct v2.46
    Process Start Time: Sat Mar 28 18:22:36 EDT 2015
             Host Name: bat1
   Current Working Dir: /local/data/bat1/alien/Swift_3rdBATcatalog/event/batevent_reproc/GRB150204A
======================================================================

  Trigger: 00084702      Segment: 002

  BAT Trigger Time: 444724275.001
               UTC: 2015-02-04T06:31:01.860   [includes UTCF correction]
       Where From?: Ground analysis (best_duration.txt)
  NOTE: BAT trigger time for ground-detected burst during slew is the T100 start time.

  Refined Position:   [ source = BAT mosaic image ]
    RA: 160.275031221435   Dec: -64.043129166788  [deg; J2000]
        { 10h 41m 06.0s , -64d -2' -35.3" }
        +/- 1.05407795563 [arcmin] (estimated 90% radius based on SNR)
    SNR: 28.2162872478


  Angular difference between the analysis and refined position is Usage: arcmin

  Partial Coding Fraction: Unavailable because the burst occurred during slew.

  Duration
     T90: 14. +/- 2.23606797749979
        Measured from: 1
                   to: 15     [s; relative to TRIGTIME]
     T50: 4. +/- 1.4142135623731
        Measured from: 5
                   to: 9     [s; relative to TRIGTIME]


====== Table of the duration information =============================

        Value   tstart    tstop
T100   19.000    0.000   19.000
T90    14.000    1.000   15.000
T50     4.000    5.000    9.000
Peak    1.000    6.000    7.000


====== Spectral Analysis Summary =====================================

Model      : spectral model: simple power-law (PL) and cutoff power-law (CPL)
Ph_index   : photon index: E^{Ph_index}
Ph_90err   : 90% error of the photon index
Epeak      : Epeak in keV
Epeak_90err: 90% error of Epeak
Norm       : normalization at 50 keV in both the PL model and CPL model
Nomr_90err : 90% error of the normalization
chi2       : Chi-Squared
dof        : degree of freedo

=== Time-averaged spectral analysis ===
(Best model with acceptable fit: PL)

Model Ph_index Ph_90err_low Ph_90err_hi  Epeak  Epeak_90err_low  Epeak_90err_hi  Norm       Nomr_90err_low    Norm_90err_hi    chi2    dof
PL      -1.610    -0.106      0.105       -           -               -         4.95e-03     -2.92e-04          2.91e-04      46.880   57
CPL     -1.549    -0.161      0.355      367.607    -367.607      -367.607      5.32e-03     -1.43e-03          2.60e-03      46.920   56


=== 1-s peak spectral analysis ===
(Best model with acceptable fit: CPL)

Model Ph_index Ph_90err_low Ph_90err_hi  Epeak  Epeak_90err_low  Epeak_90err_hi  Norm       Nomr_90err_low    Norm_90err_hi    chi2    dof
PL      -1.506     -0.152     0.150       -           -               -         1.48e-02     -1.41e-03          1.41e-03      67.230   57
CPL     -0.358     -0.673     0.786       72.007     -12.589        32.885      5.56e-02     -2.95e-02          7.79e-02      57.940   56


=== Fluence/Peak Flux Summary ===

              Model    Band1     Band2     Band3     Band4     Band5     Total
                       15-25     25-50    50-100    100-350    15-150    15-350    keV
Fluence         PL   1.33e-07  2.29e-07  3.00e-07  7.98e-07  8.79e-07  1.46e-06   erg/cm2
      90%_error_low -1.31e-08 -1.36e-08 -2.36e-08 -1.28e-07 -5.55e-08 -1.47e-07   erg/cm2
      90%_error_hi   1.35e-08  1.36e-08  2.35e-08  1.44e-07  5.58e-08  1.60e-07   erg/cm2
Peak flux       PL   6.11e-01  6.13e-01  4.32e-01  4.82e-01  1.85e+00  2.14e+00   ph/cm2/s
      90%_error_low -9.11e-02 -6.02e-02 -5.08e-02 -1.04e-01 -1.74e-01 -2.01e-01   ph/cm2/s
      90%_error_hi   9.50e-02  5.99e-02  5.05e-02  1.19e-01  1.74e-01  2.02e-01   ph/cm2/s

Fluence        CPL   1.33e-07  2.29e-07  3.00e-07  7.93e-07  8.78e-07  1.44e-06   erg/cm2
      90%_error_low -1.55e-08 -1.38e-08 -2.24e-08 -3.70e-07 -6.20e-08 -3.68e-07   erg/cm2
      90%_error_hi   1.11e-08  1.62e-08  2.47e-08  8.87e-08  5.66e-08  1.73e-07   erg/cm2
Peak flux      CPL   4.95e-01  6.78e-01  4.74e-01  1.73e-01  1.77e+00  1.82e+00   ph/cm2/s
      90%_error_low -1.11e-01 -7.34e-02 -6.03e-02 -7.70e-02 -1.80e-01 -1.99e-01   ph/cm2/s
      90%_error_hi   1.14e-01  7.53e-02  6.15e-02  1.32e-01  1.80e-01  2.14e-01   ph/cm2/s

======================================================================
Image
Note1: The mosaic image is made with timebin = 0.10 s; energybin = 15-350 keV
Note2: The mosaic image uses Galactic coordinate.
#RAcent DECcent POSerr Theta  Phi  Peak_Cts  SNR Name
160.275 -64.043 0.002 18.970 13.971 0.063 28.216 UNKNOWN

Image time interval: 0.000 to 19.000 [sec]
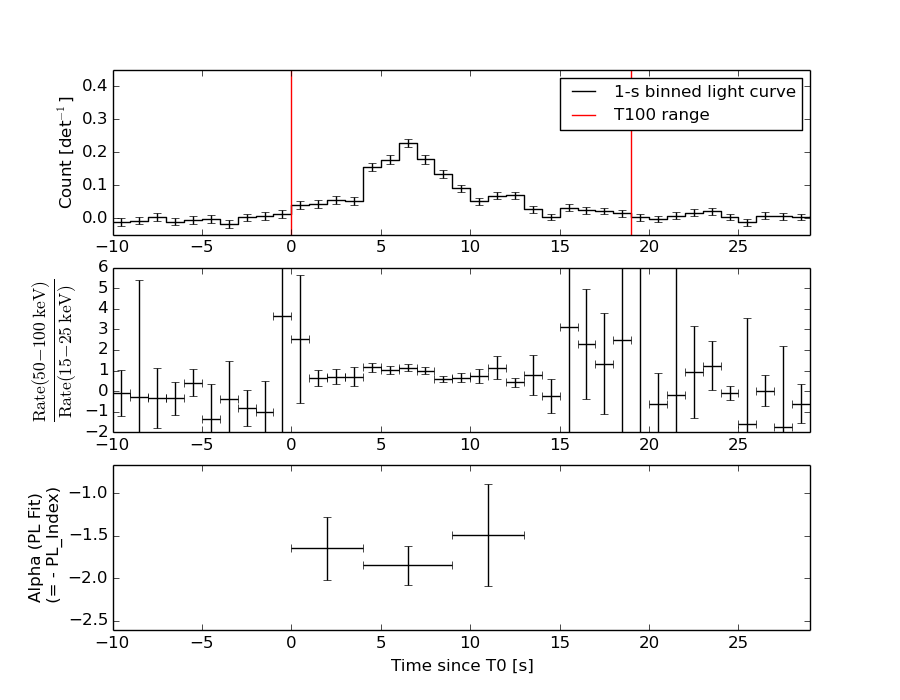
Light Curves
Note: The mask-weighted lightcurves have units of either count/det or counts/sec/det, where a det is 0.4 x 0.4 = 0.16 sq cm.
Best duration plot
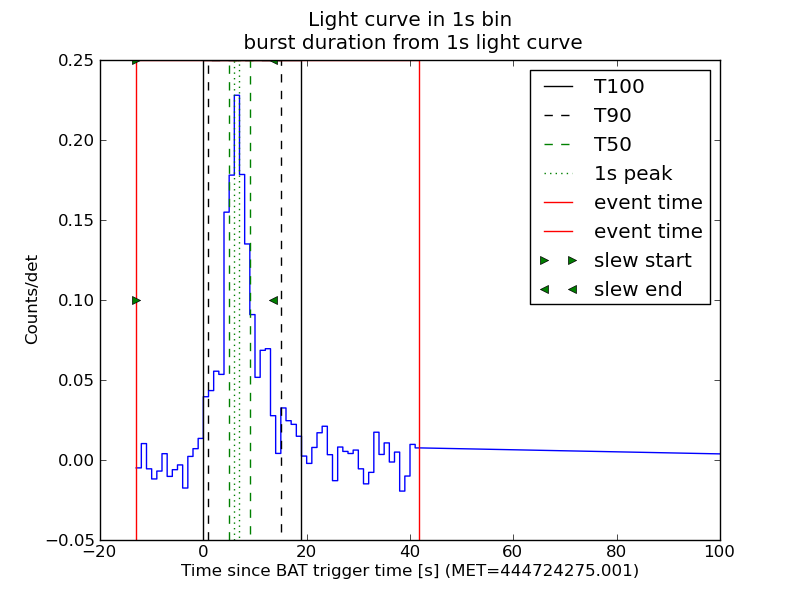
Full-time range; 1 s binning
Other quick-look light curves:
- 64 ms binning (zoomed)
- 16 ms binning (zoomed)
- 8 ms binning (zoomed)
- 2 ms binning (zoomed)
- SN=5 or 10 s binning (full-time range)
- Raw light curve
Spectra
- 64 ms binning (zoomed)
- 16 ms binning (zoomed)
- 8 ms binning (zoomed)
- 2 ms binning (zoomed)
- SN=5 or 10 s binning (full-time range)
- Raw light curve
Spectra
Notes:
- 1) The fitting includes the systematic errors.
- 2) When the burst includes telescope slew time periods, the fitting uses an average response file made from multiple 5-s response files through out the slew time plus single time preiod for the non-slew times, and weighted by the total counts in the corresponding time period using addrmf. An average response file is needed becuase a spectral fit using the pre-slew DRM will introduce some errors in both a spectral shape and a normalization if the PHA file contains a lot of the slew/post-slew time interval.
- 3) For fits to more complicated models (e.g. a power-law over a cutoff power-law), the BAT team has decided to require a chi-square improvement of more than 6 for each extra dof.
Time averaged spectrum fit using the average DRM
Power-law model

Time interval is from    0.000 sec. to   19.000 sec.

Spectral model in power-law:
------------------------------------------------------------
Parameters  : value       lower 90%   higher 90%
Photon index: -1.61012     ( -0.10579   0.10497 )
Norm@50keV  : 4.95371E-03    ( -0.000291834   0.000290503 )
------------------------------------------------------------
#Fit statistic : Chi-Squared =          46.88 using 59 PHA bins.
# Reduced chi-squared =         0.8224 for     57 degrees of freedom
# Null hypothesis probability =   8.282827e-01

Photon flux (15-150 keV)    in 19 sec: 0.638608 ( -0.037497  0.037595 ) ph/cm2/s
Energy fluence (15-150 keV)             : 8.79293e-07 ( -5.54899e-08  5.584e-08 ) ergs/cm2
Cutoff power-law model
Time interval is from    0.000 sec. to   19.000 sec.
Spectral model in the cutoff power-law:
------------------------------------------------------------
Parameters  : value       lower 90%   higher 90%
Photon index: -1.60813     ( -0.156697   0.359049 )
Epeak [keV] : 9947.80      ( -9229.63 -9229.63 )
Norm@50keV  : 4.96562E-03    ( -0.00107244   0.00295013 )
------------------------------------------------------------
#Fit statistic : Chi-Squared =          46.88 using 59 PHA bins.
# Reduced chi-squared =         0.8371 for     56 degrees of freedom
# Null hypothesis probability =   8.023376e-01

Photon flux (15-150 keV)    in 19 sec: 0.638289 ( -0.039993  0.037779 ) ph/cm2/s
Energy fluence (15-150 keV)             : 8.78058e-07 ( -6.20143e-08  5.66445e-08 ) ergs/cm2
1-s peak spectrum fit
Power-law model
Time interval is from    6.000 sec. to    7.000 sec.

Spectral model in power-law:
------------------------------------------------------------
Parameters  : value       lower 90%   higher 90%
Photon index: -1.506     ( -0.152011   0.150004 )
Norm@50keV  : 1.47640E-02    ( -0.00141149   0.00140542 )
------------------------------------------------------------
#Fit statistic : Chi-Squared =          67.23 using 59 PHA bins.
# Reduced chi-squared =          1.179 for     57 degrees of freedom
# Null hypothesis probability =   1.666258e-01

Photon flux (15-150 keV)    in 1 sec: 1.84616 ( -0.17388  0.17406 ) ph/cm2/s
Energy fluence (15-150 keV)             : 1.39943e-07 ( -1.44787e-08  1.45896e-08 ) ergs/cm2
Cutoff power-law model
Time interval is from    6.000 sec. to    7.000 sec.
Spectral model in the cutoff power-law:
------------------------------------------------------------
Parameters  : value       lower 90%   higher 90%
Photon index: -0.357834     ( -0.672622   0.785879 )
Epeak [keV] : 72.0074      ( -12.589 32.8845 )
Norm@50keV  : 5.56208E-02    ( -0.0295145   0.077921 )
------------------------------------------------------------
#Fit statistic : Chi-Squared =          57.94 using 59 PHA bins.
# Reduced chi-squared =          1.035 for     56 degrees of freedom
# Null hypothesis probability =   4.035353e-01

Photon flux (15-150 keV)    in 1 sec: 1.77102 ( -0.17968  0.17968 ) ph/cm2/s
Energy fluence (15-150 keV)             : 1.31018e-07 ( -1.51056e-08  1.5412e-08 ) ergs/cm2
Time-resolved spectra
Distribution
T90 vs. Hardness ratio plot
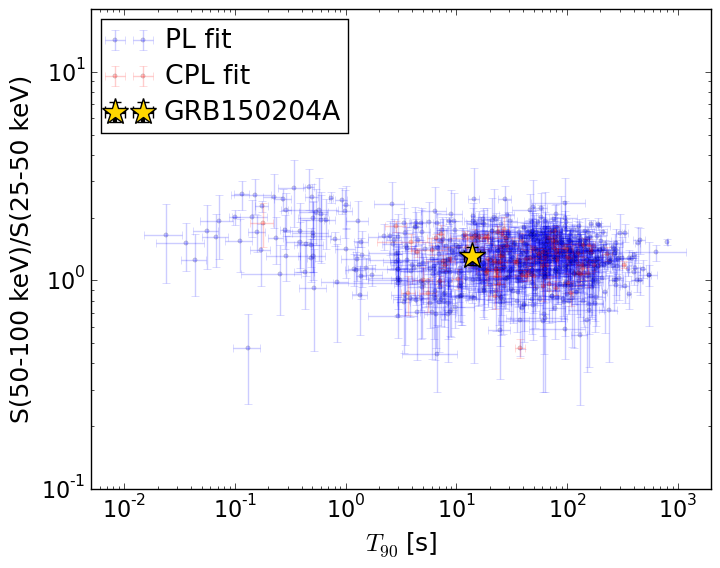
T90                                   = 14.0 sec.
Hardness ratio (energy fluence ratio) = 1.31032743436
S(15-50 keV) vs. S(50-150 keV) plot
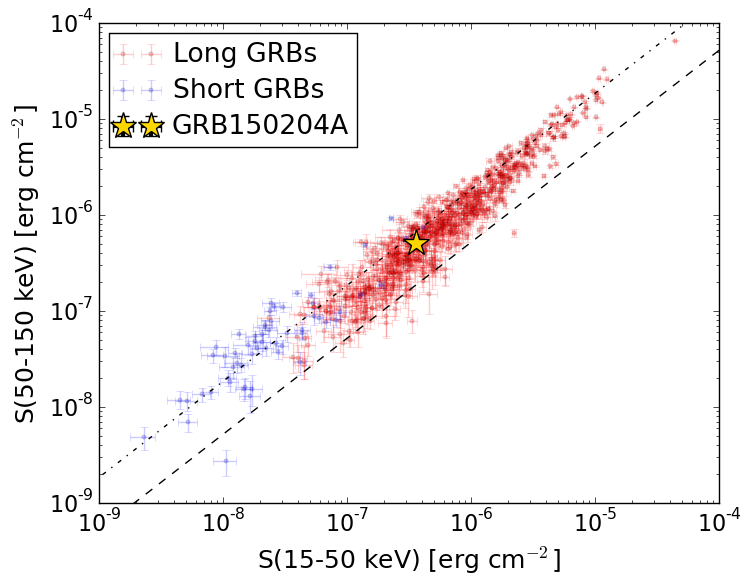
S(15-50 keV)  = 3.622567e-07
S(50-150 keV) = 5.170301e-07
The dash-dotted line and the dashed line traces the fluences calculated from the Band function with Epeak = 15 and 150 keV, respectively. Both lines assume a canonical values of alpha = -1 and beta = -2.5.
Mask shadow pattern
Mask shadow pattern unavailable because this burst occurs during telescope slews.Spacecraft aspect plot