Analysis Summary
Notes:
- 1) No attempt has been made to eliminate the non-significant decimal places.
- 2) This batgrbproduct analysis is done using the HEASARC data.
- 3) This batgrbproduct analysis is using the flight position for the mask-weighting calculation.
======================================================================
                  BAT GRB EVENT DATA PROCESSING REPORT
    Process Script Ver: batgrbproduct v2.46
    Process Start Time: Tue Apr 28 14:24:22 EDT 2015
             Host Name: bat1
   Current Working Dir: /local/data/bat1/alien/Swift_3rdBATcatalog/event/batevent_reproc/trigger630019
======================================================================

  Trigger: 00630019      Segment: 000

  BAT Trigger Time: 444925816   [s; MET]
      Trigger Stop: 444925880   [s; MET]
               UTC: 2015-02-06T14:30:02.849200    [includes UTCF correction]
       Where From?: TDRSS position message

  BAT
    RA: 10.0880618864819   Dec: -63.1818740676982  [deg; J2000]

     Catalogged Source?: NO
     Point Source?:      YES
     GRB Indicated?:     YES    [ by BAT flight software ]
     Image S/N Ratio:    9.92
     Image Trigger?:     YES
     Rate S/N Ratio:     0  [ if not an image trigger ]
     Image S/N Ratio:    9.92

  Analysis Position:   [ source = BAT ]
    RA: 10.0880618864819   Dec: -63.1818740676982  [deg; J2000]

  Refined Position:   [ source = BAT pre-slew burst ]
    RA: 10.0691697736614   Dec: -63.1811761425725  [deg; J2000]
        { 00h 40m 16.6s , -63d 10' 52.2" }
         +/- 0.792446780784545 [arcmin] (estimated 90% radius based on SNR)
         +/- 0.158320096073308 [arcmin] (formal 1-sigma fit error)
    SNR: 42.4079032809026

  Angular difference between the analysis and refined position is 0.513120 arcmin

  Partial Coding Fraction: 0.484375    [ including projection effects ]

  Duration
     T90: 74.9999999403954 +/- 12.6854177495456
        Measured from: 37.4039999842644
                   to: 112.40399992466     [s; relative to TRIGTIME]
     T50: 18.12399995327 +/- 0.482277862930446
        Measured from: 81.1359999775887
                   to: 99.2599999308586     [s; relative to TRIGTIME]


  Fluence
     Peak Flux  (peak 1 second)
        Measured from: 98.8159999847412
                   to: 99.8159999847412     [s; relative to TRIGTIME]
     Total Fluence
        Measured from: -22.2519999742508
                   to: 389.663999974728     [s; relative to TRIGTIME]

             Band 1     Band 2     Band 3     Band 4
              15-25      25-50     50-100    100-350     keV
 Total     4.792999   7.534194   6.936831   2.081269
           0.163744   0.167607   0.146547   0.128034 [error]
 Peak      0.221955   0.418096   0.436553   0.136672
           0.012197   0.014786   0.015354   0.011554 [error]

     [ fluence units of on-axis counts / fully illuminated detector ]

======================================================================


====== Table of the duration information =============================

        Value   tstart    tstop
T100  411.916  -22.252  389.664
T90    75.000   37.404  112.404
T50    18.124   81.136   99.260
Peak    1.000   98.816   99.816


====== Spectral Analysis Summary =====================================

Model      : spectral model: simple power-law (PL) and cutoff power-law (CPL)
Ph_index   : photon index: E^{Ph_index}
Ph_90err   : 90% error of the photon index
Epeak      : Epeak in keV
Epeak_90err: 90% error of Epeak
Norm       : normalization at 50 keV in both the PL model and CPL model
Nomr_90err : 90% error of the normalization
chi2       : Chi-Squared
dof        : degree of freedo

=== Time-averaged spectral analysis ===
(Best model with acceptable fit: PL)

Model Ph_index Ph_90err_low Ph_90err_hi  Epeak  Epeak_90err_low  Epeak_90err_hi  Norm       Nomr_90err_low    Norm_90err_hi    chi2    dof
PL      -1.337    -0.048      0.048       -           -               -         3.67e-03     -9.41e-05          9.41e-05      52.220   57
CPL     -1.161    -0.095      0.192      275.321    -112.838      -275.321      4.39e-03     -6.20e-04          9.04e-04      49.560   56


=== 1-s peak spectral analysis ===
(Best model with acceptable fit: PL)

Model Ph_index Ph_90err_low Ph_90err_hi  Epeak  Epeak_90err_low  Epeak_90err_hi  Norm       Nomr_90err_low    Norm_90err_hi    chi2    dof
PL      -1.121     -0.068     0.068       -           -               -         8.65e-02     -3.34e-03          3.34e-03      56.600   57
CPL     -0.834     -0.260     0.280      234.260     -87.566       765.689      1.16e-01     -2.60e-02          3.73e-02      53.130   56


=== Fluence/Peak Flux Summary ===

              Model    Band1     Band2     Band3     Band4     Band5     Total
                       15-25     25-50    50-100    100-350    15-150    15-350    keV
Fluence         PL   1.66e-06  3.37e-06  5.33e-06  1.87e-05  1.48e-05  2.91e-05   erg/cm2
      90%_error_low -8.98e-08 -1.07e-07 -1.55e-07 -1.25e-06 -3.90e-07 -1.32e-06   erg/cm2
      90%_error_hi   9.18e-08  1.07e-07  1.54e-07  1.31e-06  3.90e-07  1.37e-06   erg/cm2
Peak flux       PL   2.48e+00  3.13e+00  2.88e+00  4.62e+00  1.01e+01  1.31e+01   ph/cm2/s
      90%_error_low -1.91e-01 -1.48e-01 -1.24e-01 -4.17e-01 -4.01e-01 -5.37e-01   ph/cm2/s
      90%_error_hi   1.96e-01  1.47e-01  1.24e-01  4.42e-01  4.01e-01  5.41e-01   ph/cm2/s

Fluence        CPL   1.58e-06  3.40e-06  5.43e-06  1.50e-05  1.47e-05  2.54e-05   erg/cm2
      90%_error_low -1.18e-07 -1.12e-07 -1.81e-07 -3.03e-06 -4.19e-07 -3.03e-06   erg/cm2
      90%_error_hi   1.20e-07  1.12e-07  1.83e-07  1.85e-06  4.18e-07  3.44e-06   erg/cm2
Peak flux      CPL   2.30e+00  3.18e+00  2.98e+00  3.49e+00  9.94e+00  1.20e+01   ph/cm2/s
      90%_error_low -2.45e-01 -1.57e-01 -1.55e-01 -7.74e-01 -4.16e-01 -8.95e-01   ph/cm2/s
      90%_error_hi   2.51e-01  1.58e-01  1.56e-01  1.04e+00  4.16e-01  1.12e+00   ph/cm2/s

======================================================================
Image
Pre-slew 15.0-350.0 keV image (Event data)
#   RAcent    DECcent   POSerr    Theta     Phi              Peak Cts       SNR   Name
   10.0692   -63.1812   0.0045    34.9501   -46.4975        21.9194497     42.408 TRIG_00630019

Foreground time interval of the image:
-13.699 389.664 (delta_t = 403.363 [sec])
Background time interval of the image:
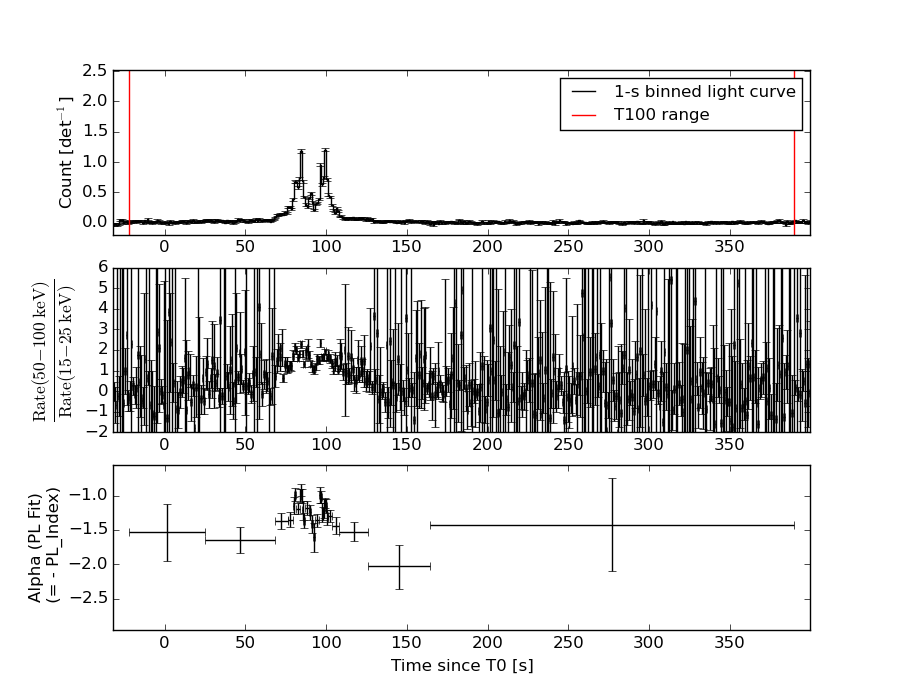
Light Curves
Note: The mask-weighted lightcurves have units of either count/det or counts/sec/det, where a det is 0.4 x 0.4 = 0.16 sq cm.
Full-time range; 1 s binning
Other quick-look light curves:
- 64 ms binning (zoomed)
- 16 ms binning (zoomed)
- 8 ms binning (zoomed)
- 2 ms binning (zoomed)
- SN=5 or 10 s binning (full-time range)
- Raw light curve
Spectra
- 64 ms binning (zoomed)
- 16 ms binning (zoomed)
- 8 ms binning (zoomed)
- 2 ms binning (zoomed)
- SN=5 or 10 s binning (full-time range)
- Raw light curve
Spectra
Notes:
- 1) The fitting includes the systematic errors.
- 2) When the burst includes telescope slew time periods, the fitting uses an average response file made from multiple 5-s response files through out the slew time plus single time preiod for the non-slew times, and weighted by the total counts in the corresponding time period using addrmf. An average response file is needed becuase a spectral fit using the pre-slew DRM will introduce some errors in both a spectral shape and a normalization if the PHA file contains a lot of the slew/post-slew time interval.
- 3) For fits to more complicated models (e.g. a power-law over a cutoff power-law), the BAT team has decided to require a chi-square improvement of more than 6 for each extra dof.
Time averaged spectrum fit using the average DRM
Power-law model
Time interval is from  -22.252 sec. to  389.664 sec.

Spectral model in power-law:
------------------------------------------------------------
Parameters  : value       lower 90%   higher 90%
Photon index: -1.33698     ( -0.0477609   0.0479666 )
Norm@50keV  : 3.67437E-03    ( -9.41332e-05   9.40437e-05 )
------------------------------------------------------------
#Fit statistic : Chi-Squared =          52.22 using 59 PHA bins.
# Reduced chi-squared =         0.9161 for     57 degrees of freedom
# Null hypothesis probability =   6.547072e-01

Photon flux (15-150 keV)    in 411.9 sec: 0.441494 ( -0.012624  0.012664 ) ph/cm2/s
Energy fluence (15-150 keV)             : 1.48273e-05 ( -3.89795e-07  3.90159e-07 ) ergs/cm2
Cutoff power-law model

Time interval is from  -22.252 sec. to  389.664 sec.
Spectral model in the cutoff power-law:
------------------------------------------------------------
Parameters  : value       lower 90%   higher 90%
Photon index: -1.16078     ( -0.0953506   0.192315 )
Epeak [keV] : 275.321      ( -112.838 -275.321 )
Norm@50keV  : 4.38647E-03    ( -0.000619908   0.000904371 )
------------------------------------------------------------
#Fit statistic : Chi-Squared =          49.56 using 59 PHA bins.
# Reduced chi-squared =         0.8849 for     56 degrees of freedom
# Null hypothesis probability =   7.157514e-01

Photon flux (15-150 keV)    in 411.9 sec: 0.435907 ( -0.013802  0.01385 ) ph/cm2/s
Energy fluence (15-150 keV)             : 1.46832e-05 ( -4.19232e-07  4.17963e-07 ) ergs/cm2
1-s peak spectrum fit
Power-law model
Time interval is from   98.816 sec. to   99.816 sec.

Spectral model in power-law:
------------------------------------------------------------
Parameters  : value       lower 90%   higher 90%
Photon index: -1.12129     ( -0.0675631   0.0677749 )
Norm@50keV  : 8.65484E-02    ( -0.00333714   0.00333618 )
------------------------------------------------------------
#Fit statistic : Chi-Squared =          56.60 using 59 PHA bins.
# Reduced chi-squared =         0.9931 for     57 degrees of freedom
# Null hypothesis probability =   4.898917e-01

Photon flux (15-150 keV)    in 1 sec: 10.0608 ( -0.40083  0.4012 ) ph/cm2/s
Energy fluence (15-150 keV)             : 8.98918e-07 ( -3.78648e-08  3.7975e-08 ) ergs/cm2
Cutoff power-law model
Time interval is from   98.816 sec. to   99.816 sec.
Spectral model in the cutoff power-law:
------------------------------------------------------------
Parameters  : value       lower 90%   higher 90%
Photon index: -0.83443     ( -0.259973   0.28013 )
Epeak [keV] : 234.260      ( -87.5664 765.689 )
Norm@50keV  : 0.116145    ( -0.0260213   0.0372644 )
------------------------------------------------------------
#Fit statistic : Chi-Squared =          53.13 using 59 PHA bins.
# Reduced chi-squared =         0.9488 for     56 degrees of freedom
# Null hypothesis probability =   5.840350e-01

Photon flux (15-150 keV)    in 1 sec: 9.93654 ( -0.41578  0.41626 ) ph/cm2/s
Energy fluence (15-150 keV)             : 8.88158e-07 ( -3.97007e-08  3.95472e-08 ) ergs/cm2
Time-resolved spectra
Distribution
T90 vs. Hardness ratio plot
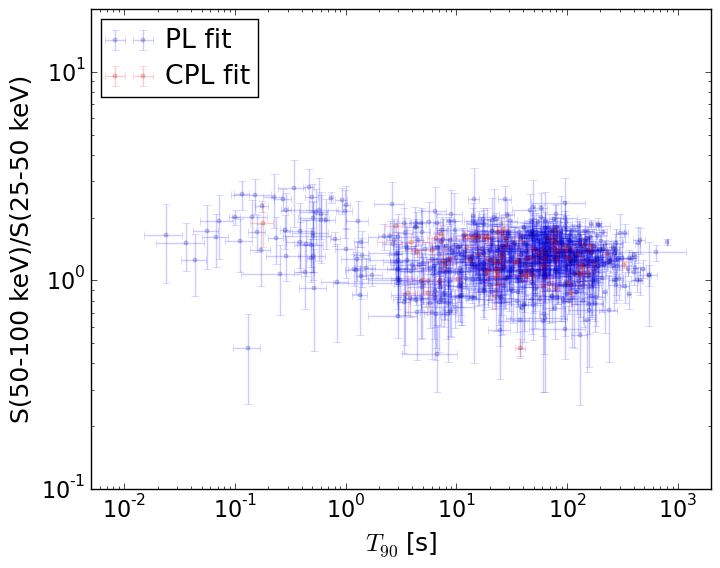
T90                                   = N/A sec.
Hardness ratio (energy fluence ratio) = N/A
S(15-50 keV) vs. S(50-150 keV) plot
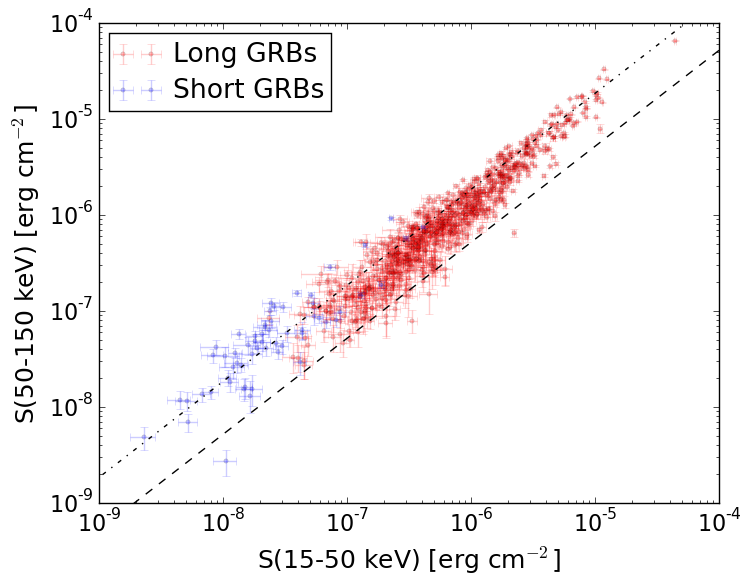
S(15-50 keV)  = N/A
S(50-150 keV) = N/A
The dash-dotted line and the dashed line traces the fluences calculated from the Band function with Epeak = 15 and 150 keV, respectively. Both lines assume a canonical values of alpha = -1 and beta = -2.5.
Mask shadow pattern
IMX = 4.811215238076407E-01, IMY = 5.069512404961517E-01
Spacecraft aspect plot
Bright source in the pre-burst/pre-slew/post-slew images
Pre-burst image of 15-350 keV band
Time interval of the image:
Pre-slew background subtracted image of 15-350 keV band
Time interval of the image:
-13.699410 389.664000

# RAcent  DECcent POSerr Theta    Phi  PeakCts   SNR AngSep     Name
#  [deg]    [deg]    ['] [deg]  [deg]                   [']
170.2853 -60.6169    2.2  22.2  104.6   1.9740   5.2    1.0	Cen X-3
186.5497 -62.8086    3.8  19.2  125.7   1.1065   3.1    3.7	GX 301-2
256.0009 -37.8447    1.1  48.6 -155.5   8.5864  10.2    0.7	4U 1700-377
256.4793 -36.4374    4.1  50.1 -155.3   2.5207   2.8    2.3	GX 349+2
264.7341 -44.4617   14.5  43.3 -144.8   0.4872   0.8    0.8	4U 1735-44
262.7774 -33.7753    4.3  53.5 -149.4  -3.4112  -2.7   11.1	GX 354-0
152.4546 -58.2719    1.7  26.2   83.9   3.3575   6.6 ------	UNKNOWN
106.2200 -68.9351    2.8  22.3   28.3   1.2390   4.1 ------	UNKNOWN
 73.3987 -58.0484    3.1  36.8    6.2   1.9628   4.9 ------	UNKNOWN
 73.5688 -58.3047    3.5  36.5    6.2   2.0162   5.0 ------	UNKNOWN
238.7790 -26.0091    4.1  58.3 -175.6   5.0058   2.8 ------	UNKNOWN
301.8411 -67.3693    2.8  26.1  -99.4   1.7310   4.1 ------	UNKNOWN
292.4410 -64.8603    2.7  27.4 -109.1   1.9843   4.4 ------	UNKNOWN
 10.0692 -63.1812    0.3  35.0  -46.5  21.9193  42.4 ------	UNKNOWN
349.5917 -53.4857    3.0  44.0  -64.2   5.2677   3.9 ------	UNKNOWN
Post-slew image of 15-350 keV band
Time interval of the image:
462.900610 723.130000

# RAcent  DECcent POSerr Theta    Phi  PeakCts   SNR AngSep     Name
#  [deg]    [deg]    ['] [deg]  [deg]                   [']
264.6526 -44.4997    6.8  57.3 -155.2 -10.4894  -1.7    4.9	4U 1735-44
 69.0436 -35.7619    2.9  44.7   51.1  15.0558   3.9 ------	UNKNOWN
 99.5654 -66.2553    3.8  35.1  105.5   7.5586   3.0 ------	UNKNOWN
 59.5884 -44.6462    3.3  33.3   50.1   5.9997   3.5 ------	UNKNOWN
223.6405 -69.0244    3.5  45.7  166.1   7.5030   3.3 ------	UNKNOWN
 32.7840 -55.7211    2.7  13.6   37.4   4.1513   4.2 ------	UNKNOWN
330.0365 -74.7166    2.5  17.9 -176.4   4.3078   4.6 ------	UNKNOWN
 31.8256 -16.0679    2.7  49.5   -2.0   9.3965   4.2 ------	UNKNOWN
337.0099 -57.2749    3.1  17.2 -115.2   3.9535   3.7 ------	UNKNOWN
 18.0017  -7.0134    2.2  56.4  -20.5  21.6216   5.2 ------	UNKNOWN
295.1384 -40.5270    3.1  48.0 -129.0  18.1512   3.8 ------	UNKNOWN