Analysis Summary
Notes:
- 1) No attempt has been made to eliminate the non-significant decimal places.
- 2) This batgrbproduct analysis is done using the HEASARC data.
- 3) This batgrbproduct analysis is using the flight position for the mask-weighting calculation.
======================================================================
                  BAT GRB EVENT DATA PROCESSING REPORT
    Process Script Ver: batgrbproduct v2.46
    Process Start Time: Sun Mar  1 21:54:20 EST 2015
             Host Name: bat1
   Current Working Dir: /local/data/bat1/alien/Swift_3rdBATcatalog/event/batevent_reproc/trigger630876
======================================================================

  Trigger: 00630876      Segment: 000

  BAT Trigger Time: 445431452.224   [s; MET]
      Trigger Stop: 445431452.736   [s; MET]
               UTC: 2015-02-12T10:57:19.047700    [includes UTCF correction]
       Where From?: TDRSS position message

  BAT
    RA: 285.521339180983   Dec: 47.407424552007  [deg; J2000]

     Catalogged Source?: NO
     Point Source?:      YES
     GRB Indicated?:     YES    [ by BAT flight software ]
     Image S/N Ratio:    7.9
     Image Trigger?:     NO
     Rate S/N Ratio:     18.5472369909914  [ if not an image trigger ]
     Image S/N Ratio:    7.9

  Analysis Position:   [ source = BAT ]
    RA: 285.521339180983   Dec: 47.407424552007  [deg; J2000]

  Refined Position:   [ source = BAT pre-slew burst ]
    RA: 285.491082509229   Dec: 47.3849489444433  [deg; J2000]
        { 19h 01m 57.9s , +47d 23' 05.8" }
         +/- 1.11809868000682 [arcmin] (estimated 90% radius based on SNR)
         +/- 0.481010145479992 [arcmin] (formal 1-sigma fit error)
    SNR: 25.9334947009701

  Angular difference between the analysis and refined position is 1.824478 arcmin

  Partial Coding Fraction: 0.7109375    [ including projection effects ]

  Duration
     T90: 15.4880000352859 +/- 3.3182935415225
        Measured from: 0.248000025749207
                   to: 15.7360000610352     [s; relative to TRIGTIME]
     T50: 5.216000020504 +/- 0.769332189989922
        Measured from: 1.6240000128746
                   to: 6.8400000333786     [s; relative to TRIGTIME]


  Fluence
     Peak Flux  (peak 1 second)
        Measured from: 0.828000009059906
                   to: 1.82800000905991     [s; relative to TRIGTIME]
     Total Fluence
        Measured from: -0.296000003814697
                   to: 19.4800000190735     [s; relative to TRIGTIME]

             Band 1     Band 2     Band 3     Band 4
              15-25      25-50     50-100    100-350     keV
 Total     0.371080   0.552233   0.430091   0.085263
           0.027038   0.028766   0.025620   0.021862 [error]
 Peak      0.046813   0.102168   0.073321   0.015536
           0.006580   0.007581   0.006913   0.005503 [error]

     [ fluence units of on-axis counts / fully illuminated detector ]

======================================================================


====== Table of the duration information =============================

        Value   tstart    tstop
T100   19.776   -0.296   19.480
T90    15.488    0.248   15.736
T50     5.216    1.624    6.840
Peak    1.000    0.828    1.828


====== Spectral Analysis Summary =====================================

Model      : spectral model: simple power-law (PL) and cutoff power-law (CPL)
Ph_index   : photon index: E^{Ph_index}
Ph_90err   : 90% error of the photon index
Epeak      : Epeak in keV
Epeak_90err: 90% error of Epeak
Norm       : normalization at 50 keV in both the PL model and CPL model
Nomr_90err : 90% error of the normalization
chi2       : Chi-Squared
dof        : degree of freedo

=== Time-averaged spectral analysis ===
(Best model with acceptable fit: PL)

Model Ph_index Ph_90err_low Ph_90err_hi  Epeak  Epeak_90err_low  Epeak_90err_hi  Norm       Nomr_90err_low    Norm_90err_hi    chi2    dof
PL      -1.493    -0.108      0.107       -           -               -         4.79e-03     -2.92e-04          2.91e-04      49.190   57
CPL     -1.282    -0.266      0.431      171.848      N/A           N/A         6.11e-03        N/A               N/A         48.380   56


=== 1-s peak spectral analysis ===
(Best model with acceptable fit: PL)

Model Ph_index Ph_90err_low Ph_90err_hi  Epeak  Epeak_90err_low  Epeak_90err_hi  Norm       Nomr_90err_low    Norm_90err_hi    chi2    dof
PL      -1.259     -0.153     0.154       -           -               -         1.60e-02     -1.45e-03          1.45e-03      62.760   57
CPL     -1.055     -0.285     0.656      235.804    -235.804      -235.804      2.03e-02     -5.57e-03          2.23e-02      62.420   56


=== Fluence/Peak Flux Summary ===

              Model    Band1     Band2     Band3     Band4     Band5     Total
                       15-25     25-50    50-100    100-350    15-150    15-350    keV
Fluence         PL   1.20e-07  2.22e-07  3.15e-07  9.45e-07  9.00e-07  1.60e-06   erg/cm2
      90%_error_low -1.23e-08 -1.38e-08 -2.52e-08 -1.54e-07 -6.03e-08 -1.75e-07   erg/cm2
      90%_error_hi   1.27e-08  1.38e-08  2.51e-08  1.74e-07  6.08e-08  1.91e-07   erg/cm2
Peak flux       PL   5.24e-01  6.09e-01  5.09e-01  7.16e-01  1.90e+00  2.36e+00   ph/cm2/s
      90%_error_low -8.37e-02 -6.16e-02 -5.55e-02 -1.50e-01 -1.73e-01 -2.25e-01   ph/cm2/s
      90%_error_hi   8.74e-02  6.09e-02  5.50e-02  1.74e-01  1.73e-01  2.28e-01   ph/cm2/s

Fluence        CPL   1.16e-07  2.26e-07  3.19e-07  6.80e-07  8.85e-07  1.34e-06   erg/cm2
      90%_error_low -1.47e-08 -1.63e-08 -2.66e-08 -3.01e-07 -6.73e-08 -3.07e-07   erg/cm2
      90%_error_hi   1.49e-08  1.66e-08  2.71e-08  3.10e-07  6.71e-08  3.27e-07   erg/cm2
Peak flux      CPL   5.06e-01  6.22e-01  5.19e-01  5.56e-01  1.89e+00  2.20e+00   ph/cm2/s
      90%_error_low -9.87e-02 -6.92e-02 -6.18e-02 -2.78e-01 -1.78e-01 -3.35e-01   ph/cm2/s
      90%_error_hi   9.23e-02  7.36e-02  6.37e-02  2.05e-01  1.77e-01  3.04e-01   ph/cm2/s

======================================================================
Image
Pre-slew 15.0-350.0 keV image (Event data)
#   RAcent    DECcent   POSerr    Theta     Phi              Peak Cts       SNR   Name
  285.4911    47.3849   0.0075    20.5249   -94.3089         1.4508378     25.933 TRIG_00630876

Foreground time interval of the image:
 -0.296  19.480 (delta_t =  19.776 [sec])
Background time interval of the image:
-239.224  -0.296 (delta_t = 238.928 [sec])
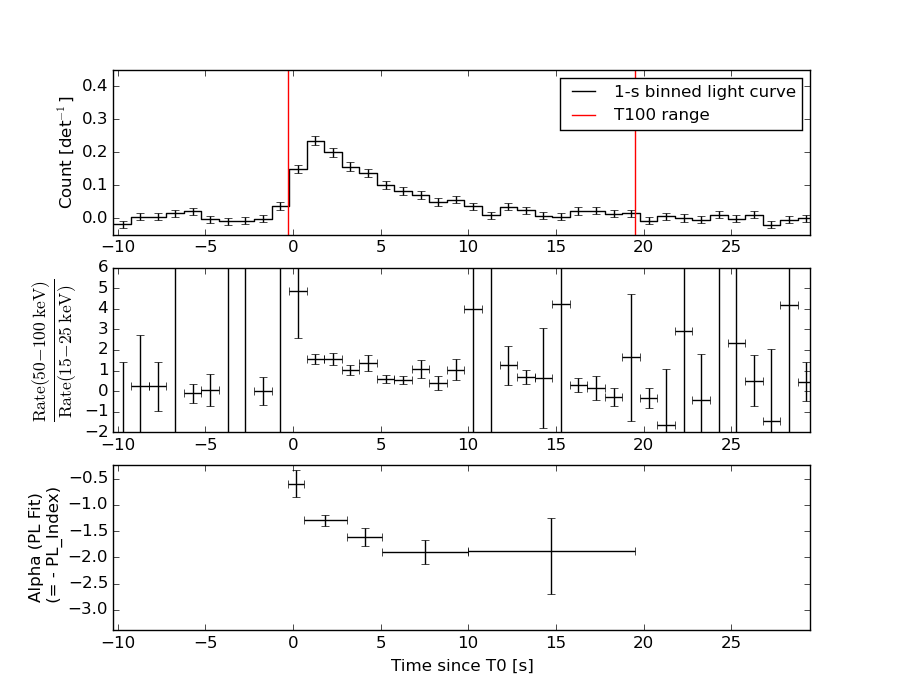
Light Curves
Note: The mask-weighted lightcurves have units of either count/det or counts/sec/det, where a det is 0.4 x 0.4 = 0.16 sq cm.
Full-time range; 1 s binning
Other quick-look light curves:
- 64 ms binning (zoomed)
- 16 ms binning (zoomed)
- 8 ms binning (zoomed)
- 2 ms binning (zoomed)
- SN=5 or 10 s binning (full-time range)
- Raw light curve
Spectra
- 64 ms binning (zoomed)
- 16 ms binning (zoomed)
- 8 ms binning (zoomed)
- 2 ms binning (zoomed)
- SN=5 or 10 s binning (full-time range)
- Raw light curve
Spectra
Notes:
- 1) The fitting includes the systematic errors.
- 2) When the burst includes telescope slew time periods, the fitting uses an average response file made from multiple 5-s response files through out the slew time plus single time preiod for the non-slew times, and weighted by the total counts in the corresponding time period using addrmf. An average response file is needed becuase a spectral fit using the pre-slew DRM will introduce some errors in both a spectral shape and a normalization if the PHA file contains a lot of the slew/post-slew time interval.
- 3) For fits to more complicated models (e.g. a power-law over a cutoff power-law), the BAT team has decided to require a chi-square improvement of more than 6 for each extra dof.
Time averaged spectrum fit using the average DRM
Power-law model
Time interval is from   -0.296 sec. to   19.480 sec.

Spectral model in power-law:
------------------------------------------------------------
Parameters  : value       lower 90%   higher 90%
Photon index: -1.49259     ( -0.107551   0.106851 )
Norm@50keV  : 4.79094E-03    ( -0.000291598   0.000290601 )
------------------------------------------------------------
#Fit statistic : Chi-Squared =          49.19 using 59 PHA bins.
# Reduced chi-squared =         0.8629 for     57 degrees of freedom
# Null hypothesis probability =   7.595896e-01

Photon flux (15-150 keV)    in 19.78 sec: 0.596928 ( -0.036122  0.036164 ) ph/cm2/s
Energy fluence (15-150 keV)             : 9.00194e-07 ( -6.03349e-08  6.07905e-08 ) ergs/cm2
Cutoff power-law model

Time interval is from   -0.296 sec. to   19.480 sec.
Spectral model in the cutoff power-law:
------------------------------------------------------------
Parameters  : value       lower 90%   higher 90%
Photon index: -1.28219     ( -0.265955   0.431355 )
Epeak [keV] : 171.848      (   )
Norm@50keV  : 6.10932E-03    (     )
------------------------------------------------------------
#Fit statistic : Chi-Squared =          48.38 using 59 PHA bins.
# Reduced chi-squared =         0.8640 for     56 degrees of freedom
# Null hypothesis probability =   7.553575e-01

Photon flux (15-150 keV)    in 19.78 sec: 0.590480 ( -0.038097  0.038074 ) ph/cm2/s
Energy fluence (15-150 keV)             : 8.84842e-07 ( -6.72512e-08  6.70904e-08 ) ergs/cm2
1-s peak spectrum fit
Power-law model
Time interval is from    0.828 sec. to    1.828 sec.

Spectral model in power-law:
------------------------------------------------------------
Parameters  : value       lower 90%   higher 90%
Photon index: -1.25949     ( -0.153424   0.154234 )
Norm@50keV  : 1.60366E-02    ( -0.00145105   0.00144809 )
------------------------------------------------------------
#Fit statistic : Chi-Squared =          62.76 using 59 PHA bins.
# Reduced chi-squared =          1.101 for     57 degrees of freedom
# Null hypothesis probability =   2.794857e-01

Photon flux (15-150 keV)    in 1 sec: 1.89968 ( -0.17322  0.17334 ) ph/cm2/s
Energy fluence (15-150 keV)             : 1.60111e-07 ( -1.63139e-08  1.64725e-08 ) ergs/cm2
Cutoff power-law model
Time interval is from    0.828 sec. to    1.828 sec.
Spectral model in the cutoff power-law:
------------------------------------------------------------
Parameters  : value       lower 90%   higher 90%
Photon index: -1.05486     ( -0.285305   0.656398 )
Epeak [keV] : 235.804      ( -235.869 -235.869 )
Norm@50keV  : 2.03307E-02    ( -0.00556783   0.0223217 )
------------------------------------------------------------
#Fit statistic : Chi-Squared =          62.42 using 59 PHA bins.
# Reduced chi-squared =          1.115 for     56 degrees of freedom
# Null hypothesis probability =   2.588426e-01

Photon flux (15-150 keV)    in 1 sec: 1.88655 ( -0.17759  0.17728 ) ph/cm2/s
Energy fluence (15-150 keV)             : 5.84104e-08 ( -1.80942e-08  1.60217e-08 ) ergs/cm2
Time-resolved spectra
Distribution
T90 vs. Hardness ratio plot
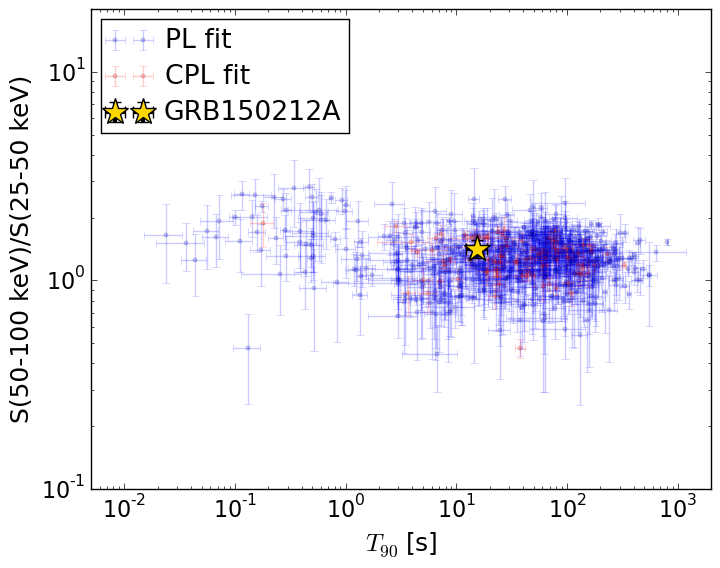
T90                                   = 15.488 sec.
Hardness ratio (energy fluence ratio) = 1.42154213893
S(15-50 keV) vs. S(50-150 keV) plot
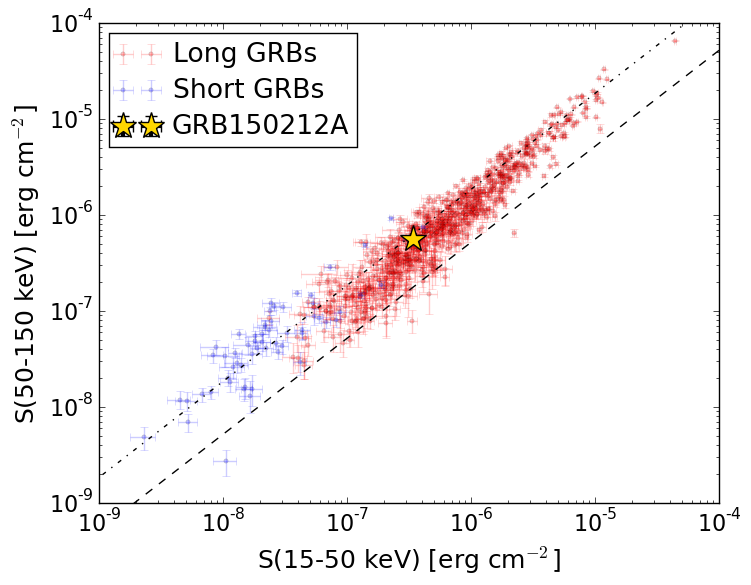
S(15-50 keV)  = 3.4198e-07
S(50-150 keV) = 5.58221e-07
The dash-dotted line and the dashed line traces the fluences calculated from the Band function with Epeak = 15 and 150 keV, respectively. Both lines assume a canonical values of alpha = -1 and beta = -2.5.
Mask shadow pattern
IMX = -2.812855980010357E-02, IMY = 3.733217457240708E-01
Spacecraft aspect plot
Bright source in the pre-burst/pre-slew/post-slew images
Pre-burst image of 15-350 keV band
Time interval of the image:
-239.224000 -0.296000

# RAcent  DECcent POSerr Theta    Phi  PeakCts   SNR AngSep     Name
#  [deg]    [deg]    ['] [deg]  [deg]                   [']
254.4621  35.3655    2.1  20.0  -13.5   1.0125   5.6    1.4	Her X-1
299.5619  35.2264    3.2  36.4  -89.8   2.0389   3.6    2.0	Cyg X-1
308.1079  41.0677    8.1  37.2 -104.6   0.7448   1.4    6.9	Cyg X-3
148.6109  73.0882    2.4  42.2  141.0   2.3280   4.8 ------	UNKNOWN
229.8842  27.8002    2.4  32.9   29.0   1.1288   4.7 ------	UNKNOWN
 33.6154  66.6898    4.1  54.1 -175.6   1.8896   3.3 ------	UNKNOWN
 33.6663  66.5227    4.0  54.2 -175.5   2.3375   3.9 ------	UNKNOWN
250.7563  10.6427    2.9  44.9   -8.7   1.1350   4.0 ------	UNKNOWN
321.9477  42.5494    2.9  44.0 -116.7   3.1052   4.0 ------	UNKNOWN
326.3319  44.0717    2.9  45.4 -121.3   3.1702   4.0 ------	UNKNOWN
Pre-slew background subtracted image of 15-350 keV band
Time interval of the image:
-0.296000 19.480000

# RAcent  DECcent POSerr Theta    Phi  PeakCts   SNR AngSep     Name
#  [deg]    [deg]    ['] [deg]  [deg]                   [']
254.5337  35.4560   18.8  19.9  -13.7   0.0281   0.6    7.8	Her X-1
299.5412  35.1610   13.1  36.5  -89.7  -0.1087  -0.9    3.4	Cyg X-1
307.9865  40.9247   21.3  37.2 -104.3   0.0644   0.5    5.9	Cyg X-3
 10.0311  71.6610    2.8  45.2 -170.7   0.3316   4.1 ------	UNKNOWN
285.4911  47.3849    0.4  20.5  -94.3   1.4507  25.9 ------	UNKNOWN
283.1896  43.4638    2.4  21.7  -83.0   0.2719   4.8 ------	UNKNOWN
308.6136  49.5152    2.3  32.4 -116.9   0.3529   4.9 ------	UNKNOWN
Post-slew image of 15-350 keV band
Time interval of the image:
337.876600 422.876000

# RAcent  DECcent POSerr Theta    Phi  PeakCts   SNR AngSep     Name
#  [deg]    [deg]    ['] [deg]  [deg]                   [']
254.5212  35.1435    4.7  26.1   25.0  -2.6852  -2.4   12.3	Her X-1
268.5411  -1.3943    8.7  51.0  -26.2   3.4258   1.3   11.0	SW J1753.5-0127
288.9160  11.0171    6.8  36.5  -53.9   2.7558   1.7    8.1	GRS 1915+105
299.6754  35.0681    8.6  16.3  -94.0  -1.3723  -1.3    9.0	Cyg X-1
308.1789  41.0101    6.0  17.4 -125.0  -2.0494  -1.9    4.6	Cyg X-3
326.1677  38.3140  204.2  30.8 -136.1  -0.0752  -0.1    0.5	Cyg X-2
277.2423  67.3413    2.8  20.4  122.7   4.4349   4.1 ------	UNKNOWN
327.8847  68.7809    3.6  29.9  161.2   3.6608   3.2 ------	UNKNOWN
266.2253  44.6534    2.6  13.6   37.2   3.9103   4.4 ------	UNKNOWN
262.6061  -5.3124    2.5  56.4  -20.5  17.8770   4.7 ------	UNKNOWN
290.5685   1.2534    2.1  46.4  -55.2  26.6171   5.5 ------	UNKNOWN