Analysis Summary
Notes:
- 1) No attempt has been made to eliminate the non-significant decimal places.
- 2) This batgrbproduct analysis is done using the HEASARC data.
- 3) This batgrbproduct analysis is using the flight position for the mask-weighting calculation.
======================================================================
BAT GRB EVENT DATA PROCESSING REPORT
Process Script Ver: batgrbproduct v2.46
Process Start Time: Sun Mar 1 23:02:15 EST 2015
Host Name: bat1
Current Working Dir: /local/data/bat1/alien/Swift_3rdBATcatalog/event/batevent_reproc/trigger631051
======================================================================
Trigger: 00631051 Segment: 000
BAT Trigger Time: 445559504 [s; MET]
Trigger Stop: 445559568 [s; MET]
UTC: 2015-02-13T22:31:30.817240 [includes UTCF correction]
Where From?: TDRSS position message
BAT
RA: 253.42510590632 Dec: 34.1786965238723 [deg; J2000]
Catalogged Source?: NO
Point Source?: YES
GRB Indicated?: YES [ by BAT flight software ]
Image S/N Ratio: 8.03
Image Trigger?: YES
Rate S/N Ratio: 0 [ if not an image trigger ]
Image S/N Ratio: 8.03
Analysis Position: [ source = BAT ]
RA: 253.42510590632 Dec: 34.1786965238723 [deg; J2000]
Refined Position: [ source = BAT pre-slew burst ]
RA: 253.447648236967 Dec: 34.1630797570746 [deg; J2000]
{ 16h 53m 47.4s , +34d 09' 47.1" }
+/- 1.80899661834305 [arcmin] (estimated 90% radius based on SNR)
+/- 0.869108927567478 [arcmin] (formal 1-sigma fit error)
SNR: 13.0421790621574
Angular difference between the analysis and refined position is 1.459535 arcmin
Partial Coding Fraction: 0.1367188 [ including projection effects ]
Duration
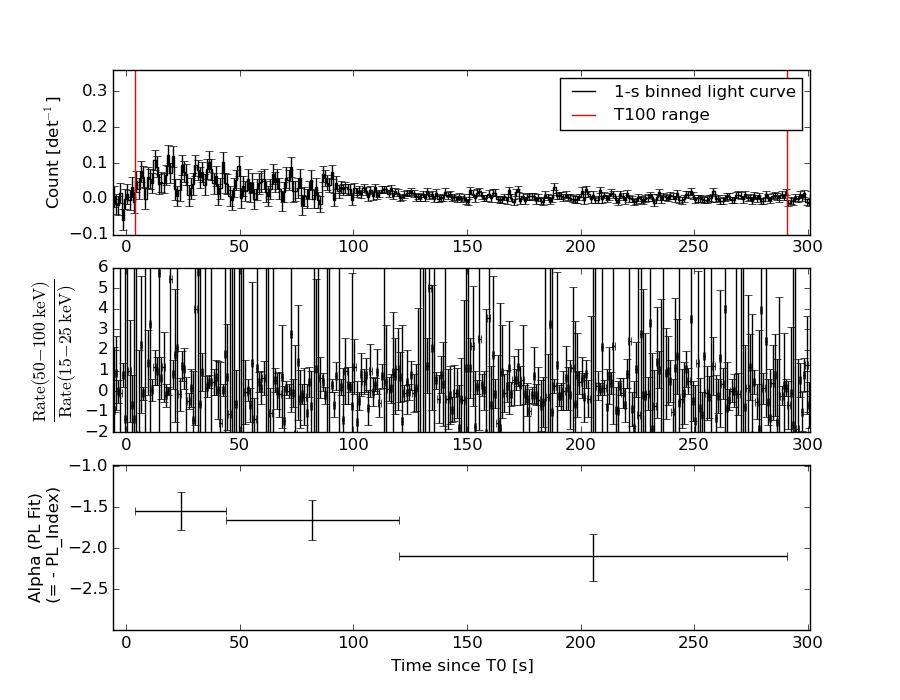
T90: 209 +/- 74.2428447730823
Measured from: 9
to: 218 [s; relative to TRIGTIME]
T50: 74 +/- 15.2315462117278
Measured from: 26
to: 100 [s; relative to TRIGTIME]
Fluence
Peak Flux (peak 1 second)
Measured from: 18
to: 19 [s; relative to TRIGTIME]
Total Fluence
Measured from: 4
to: 291 [s; relative to TRIGTIME]
Band 1 Band 2 Band 3 Band 4
15-25 25-50 50-100 100-350 keV
Total 1.458925 2.391896 1.173747 0.509223
0.167675 0.163898 0.137259 0.111195 [error]
Peak 0.068577 0.035709 0.000135 0.017264
0.016608 0.016114 0.012700 0.011725 [error]
[ fluence units of on-axis counts / fully illuminated detector ]
======================================================================
====== Table of the duration information =============================
Value tstart tstop
T100 287.000 4.000 291.000
T90 209.000 9.000 218.000
T50 74.000 26.000 100.000
Peak 1.000 18.000 19.000
====== Spectral Analysis Summary =====================================
Model : spectral model: simple power-law (PL) and cutoff power-law (CPL)
Ph_index : photon index: E^{Ph_index}
Ph_90err : 90% error of the photon index
Epeak : Epeak in keV
Epeak_90err: 90% error of Epeak
Norm : normalization at 50 keV in both the PL model and CPL model
Nomr_90err : 90% error of the normalization
chi2 : Chi-Squared
dof : degree of freedo
=== Time-averaged spectral analysis ===
(Best model with acceptable fit: PL)
Model Ph_index Ph_90err_low Ph_90err_hi Epeak Epeak_90err_low Epeak_90err_hi Norm Nomr_90err_low Norm_90err_hi chi2 dof
PL -1.744 -0.150 0.147 - - - 1.21e-03 -1.15e-04 1.14e-04 65.930 57
CPL -0.645 -0.731 0.948 53.620 -9.224 25.044 4.99e-03 -3.02e-03 1.24e-02 58.700 56
=== 1-s peak spectral analysis ===
(Best model with acceptable fit: N/A)
Model Ph_index Ph_90err_low Ph_90err_hi Epeak Epeak_90err_low Epeak_90err_hi Norm Nomr_90err_low Norm_90err_hi chi2 dof
PL -3.038 -1.319 0.942 - - - 3.63e-03 -2.70e-03 3.57e-03 62.990 57
CPL 0.060 -2.081 -0.060 16.358 -0.435 10.402 8.74e-01 -8.74e-01 1.33e+09 61.990 56
=== Fluence/Peak Flux Summary ===
Model Band1 Band2 Band3 Band4 Band5 Total
15-25 25-50 50-100 100-350 15-150 15-350 keV
Fluence PL 5.58e-07 8.84e-07 1.06e-06 2.46e-06 3.21e-06 4.95e-06 erg/cm2
90%_error_low -7.48e-08 -7.86e-08 -1.31e-07 -5.67e-07 -3.14e-07 -7.05e-07 erg/cm2
90%_error_hi 7.69e-08 7.86e-08 1.32e-07 6.71e-07 3.17e-07 7.82e-07 erg/cm2
Peak flux PL 6.71e-01 2.77e-01 6.74e-02 2.00e-02 1.03e+00 1.04e+00 ph/cm2/s
90%_error_low -2.99e-01 -1.54e-01 -6.74e-02 -2.00e-02 -4.13e-01 -4.18e-01 ph/cm2/s
90%_error_hi 2.99e-01 1.50e-01 9.86e-02 8.24e-02 4.15e-01 4.23e-01 ph/cm2/s
Fluence CPL 4.99e-07 1.01e-06 1.03e-06 5.15e-07 2.89e-06 3.05e-06 erg/cm2
90%_error_low -8.55e-08 -1.12e-07 -1.76e-07 -3.33e-07 -3.68e-07 -4.91e-07 erg/cm2
90%_error_hi 8.65e-08 1.19e-07 1.58e-07 8.29e-07 3.78e-07 8.74e-07 erg/cm2
Peak flux CPL 7.62e-01 1.86e-01 1.15e-04 8.76e-13 9.47e-01 9.51e-01 ph/cm2/s
90%_error_low -3.57e-01 -1.86e-01 N/A -8.76e-13 -3.68e-01 -3.71e-01 ph/cm2/s
90%_error_hi 3.42e-01 2.85e-01 N/A -8.76e-13 4.22e-01 4.19e-01 ph/cm2/s
======================================================================
Image
Pre-slew 15.0-350.0 keV image (Event data)
#   RAcent    DECcent   POSerr    Theta     Phi              Peak Cts       SNR   Name
  253.4476    34.1631   0.0147    38.7182   119.5005         3.7300498     13.042 TRIG_00631051

Foreground time interval of the image:
  4.000  72.901 (delta_t =  68.901 [sec])
Background time interval of the image:
-463.499 -447.733 (delta_t =  15.766 [sec])
-239.000   4.000 (delta_t = 243.000 [sec])
Light Curves
Note: The mask-weighted lightcurves have units of either count/det or counts/sec/det, where a det is 0.4 x 0.4 = 0.16 sq cm.
Full-time range; 1 s binning
Other quick-look light curves:
- 64 ms binning (zoomed)
- 16 ms binning (zoomed)
- 8 ms binning (zoomed)
- 2 ms binning (zoomed)
- SN=5 or 10 s binning (full-time range)
- Raw light curve
Spectra
- 64 ms binning (zoomed)
- 16 ms binning (zoomed)
- 8 ms binning (zoomed)
- 2 ms binning (zoomed)
- SN=5 or 10 s binning (full-time range)
- Raw light curve
Spectra
Notes:
- 1) The fitting includes the systematic errors.
- 2) When the burst includes telescope slew time periods, the fitting uses an average response file made from multiple 5-s response files through out the slew time plus single time preiod for the non-slew times, and weighted by the total counts in the corresponding time period using addrmf. An average response file is needed becuase a spectral fit using the pre-slew DRM will introduce some errors in both a spectral shape and a normalization if the PHA file contains a lot of the slew/post-slew time interval.
- 3) For fits to more complicated models (e.g. a power-law over a cutoff power-law), the BAT team has decided to require a chi-square improvement of more than 6 for each extra dof.
Time averaged spectrum fit using the average DRM
Power-law model
Time interval is from    4.000 sec. to  291.000 sec.

Spectral model in power-law:
------------------------------------------------------------
Parameters  : value       lower 90%   higher 90%
Photon index: -1.7437     ( -0.149564   0.147091 )
Norm@50keV  : 1.21036E-03    ( -0.000115319   0.000114355 )
------------------------------------------------------------
#Fit statistic : Chi-Squared =          65.93 using 59 PHA bins.
# Reduced chi-squared =          1.157 for     57 degrees of freedom
# Null hypothesis probability =   1.954873e-01

Photon flux (15-150 keV)    in 287 sec: 0.163290 ( -0.014667  0.014687 ) ph/cm2/s
Energy fluence (15-150 keV)             : 3.20702e-06 ( -3.13734e-07  3.17187e-07 ) ergs/cm2
Cutoff power-law model
Time interval is from    4.000 sec. to  291.000 sec.
Spectral model in the cutoff power-law:
------------------------------------------------------------
Parameters  : value       lower 90%   higher 90%
Photon index: -0.645486     ( -0.733521   0.945849 )
Epeak [keV] : 53.6203      ( -9.16972 25.0981 )
Norm@50keV  : 4.99381E-03    ( -0.00305206   0.0123891 )
------------------------------------------------------------
#Fit statistic : Chi-Squared =          58.70 using 59 PHA bins.
# Reduced chi-squared =          1.048 for     56 degrees of freedom
# Null hypothesis probability =   3.766406e-01

Photon flux (15-150 keV)    in 287 sec: 0.156940 ( -0.015311  0.015283 ) ph/cm2/s
Energy fluence (15-150 keV)             : 2.89015e-06 ( -3.67934e-07  3.77551e-07 ) ergs/cm2
1-s peak spectrum fit
Power-law model
Time interval is from   18.000 sec. to   19.000 sec.

Spectral model in power-law:
------------------------------------------------------------
Parameters  : value       lower 90%   higher 90%
Photon index: -3.0385     ( -1.3188   0.941901 )
Norm@50keV  : 3.63091E-03    ( -0.00269752   0.00357028 )
------------------------------------------------------------
#Fit statistic : Chi-Squared =          62.99 using 59 PHA bins.
# Reduced chi-squared =          1.105 for     57 degrees of freedom
# Null hypothesis probability =   2.727227e-01

Photon flux (15-150 keV)    in 1 sec: 1.02723 ( -0.413175  0.41536 ) ph/cm2/s
Energy fluence (15-150 keV)             : 4.44294e-08 ( -2.09304e-08  2.5426e-08 ) ergs/cm2
Cutoff power-law model
Time interval is from   18.000 sec. to   19.000 sec.
Spectral model in the cutoff power-law:
------------------------------------------------------------
Parameters  : value       lower 90%   higher 90%
Photon index: 9.27893     ( -11.2817   -9.26101 )
Epeak [keV] : 20.3362      ( -4.41508 6.42137 )
Norm@50keV  : 2.64348E+07    ( -2.38326e+07   1.31073e+09 )
------------------------------------------------------------
#Fit statistic : Chi-Squared =          61.65 using 59 PHA bins.
# Reduced chi-squared =          1.101 for     56 degrees of freedom
# Null hypothesis probability =   2.810577e-01

Photon flux (15-150 keV)    in 1 sec: 0.947239 ( -0.367833  0.422051 ) ph/cm2/s
Energy fluence (15-150 keV)             : 0 ( 0  0 ) ergs/cm2
Time-resolved spectra
Distribution
T90 vs. Hardness ratio plot
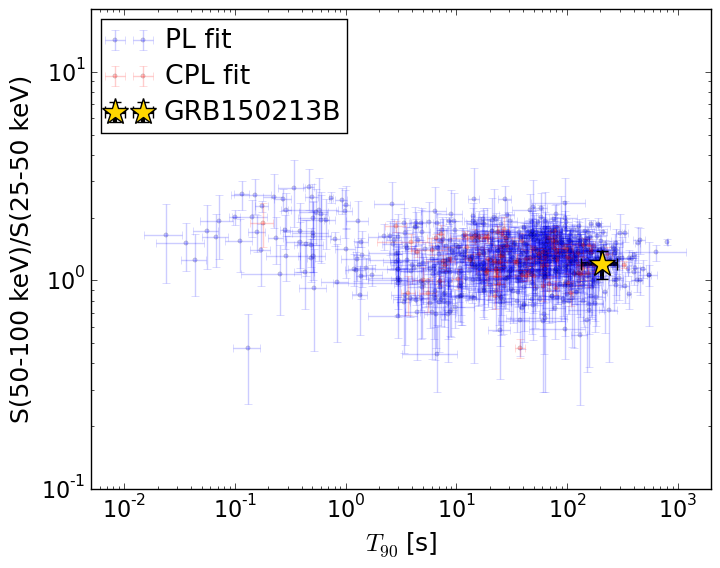
T90                                   = 209.0 sec.
Hardness ratio (energy fluence ratio) = 1.19448372672
S(15-50 keV) vs. S(50-150 keV) plot
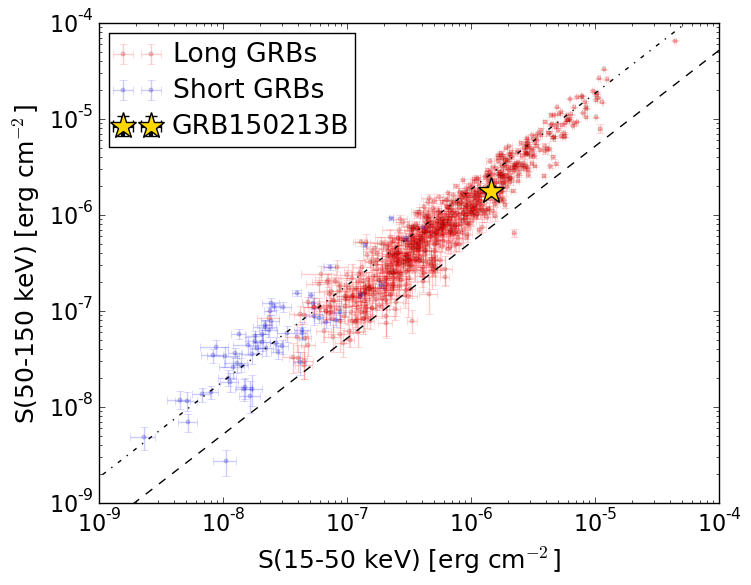
S(15-50 keV)  = 1.4414371e-06
S(50-150 keV) = 1.7656544e-06
The dash-dotted line and the dashed line traces the fluences calculated from the Band function with Epeak = 15 and 150 keV, respectively. Both lines assume a canonical values of alpha = -1 and beta = -2.5.
Mask shadow pattern
IMX = -3.947685319726116E-01, IMY = -6.977378766001685E-01
Spacecraft aspect plot
Bright source in the pre-burst/pre-slew/post-slew images
Pre-burst image of 15-350 keV band
Time interval of the image:
-463.499400 -447.732900
-239.000000 4.000000

# RAcent  DECcent POSerr Theta    Phi  PeakCts   SNR AngSep     Name
#  [deg]    [deg]    ['] [deg]  [deg]                   [']
244.9985 -15.6596    1.2  46.1   41.7   6.6532   9.3    1.6	Sco X-1
254.5092  35.3948    4.2  38.7  121.9   1.6944   2.8    4.0	Her X-1
256.0040 -37.8568    1.6  53.4   11.2   5.7547   7.0    1.1	4U 1700-377
256.3895 -36.4260    4.2  52.0   11.9   2.0749   2.8    2.2	GX 349+2
262.9827 -24.7640   63.9  39.3   15.1   0.0575   0.2    1.8	GX 1+4
264.7163 -44.3314    6.8  55.6    0.2   1.4953   1.7    7.2	4U 1735-44
268.3891  -1.4371    3.6  19.0   43.0   0.6562   3.1    1.6	SW J1753.5-0127
270.3359 -25.0757    6.2  36.2    5.4   0.5417   1.8    2.8	GX 5-1
270.4063 -25.7213    3.7  36.7    4.9   0.9046   3.1    5.8	GRS 1758-258
274.0254 -14.1147    2.7  24.8    8.5   0.8568   4.2    4.8	GX 17+2
275.9629 -30.3661    3.6  39.5   -5.1   0.9138   3.2    2.0	H1820-303
284.9334 -24.8027    5.5  33.1  -17.4   0.5100   2.1    9.0	HT1900.1-2455
288.8097  10.9233    1.0   4.8 -141.1   2.2904  11.8    1.5	GRS 1915+105
299.5700  35.2050    1.2  30.2 -172.5   2.0818   9.6    1.0	Cyg X-1
308.1064  40.9546    3.9  38.7 -168.5   0.8608   3.0    0.2	Cyg X-3
326.2487  38.1812   56.7  47.8 -152.4  -0.0974  -0.2    9.2	Cyg X-2
262.9952 -33.8497    6.4  46.9    7.9   0.7607   1.8    1.0	GX 354-0
249.1237 -14.8876    2.6  42.2   39.8   2.1580   4.5 ------	UNKNOWN
305.5889  63.0902    2.4  56.9  174.0   6.2109   4.9 ------	UNKNOWN
277.3834 -23.7898    2.0  32.8   -4.6   1.3989   5.7 ------	UNKNOWN
283.5763 -49.4661    2.6  57.7  -16.2   3.9122   4.4 ------	UNKNOWN
	UNKNOWN
	UNKNOWN
	UNKNOWN
Pre-slew background subtracted image of 15-350 keV band
Time interval of the image:
4.000000 72.900600

# RAcent  DECcent POSerr Theta    Phi  PeakCts   SNR AngSep     Name
#  [deg]    [deg]    ['] [deg]  [deg]                   [']
245.0957 -15.7382    7.7  46.0   41.5  -0.5539  -1.5    8.9	Sco X-1
254.6260  35.4124    5.0  38.7  122.0  -0.6364  -2.3    9.2	Her X-1
255.9823 -37.9220   53.8  53.4   11.2  -0.0909  -0.2    4.7	4U 1700-377
256.5290 -36.5010    7.0  52.0   11.8   0.5969   1.6    6.5	GX 349+2
262.9829 -24.6609    4.4  39.2   15.2   0.4230   2.6    5.3	GX 1+4
264.8555 -44.4772    6.2  55.7    0.0   0.7913   1.8    5.1	4U 1735-44
268.5024  -1.5146   15.7  18.9   42.6   0.0776   0.7    8.9	SW J1753.5-0127
270.4488 -25.0130    5.6  36.1    5.3  -0.2572  -2.0    9.8	GX 5-1
270.3404 -25.7637    9.4  36.8    4.9   0.1614   1.2    2.4	GRS 1758-258
274.0593 -14.0226   45.1  24.7    8.5   0.0253   0.3    3.2	GX 17+2
275.7478 -30.4457    6.4  39.7   -4.9   0.2429   1.8   10.3	H1820-303
284.9018 -25.0421    4.4  33.3  -17.3   0.3024   2.6   10.3	HT1900.1-2455
288.9249  10.8424    6.5   4.9 -139.6  -0.1568  -1.8    9.7	GRS 1915+105
299.7035  35.0819    5.4  30.1 -172.2  -0.2189  -2.1    9.1	Cyg X-1
308.2632  40.9206   11.1  38.8 -168.3  -0.1284  -1.0    7.2	Cyg X-3
326.1567  38.3361 2700.0  47.8 -152.7   0.0002   0.0    1.1	Cyg X-2
263.1532 -33.7332   11.1  46.7    7.8   0.2189   1.0   10.2	GX 354-0
253.4477  34.1630    0.9  38.7  119.5   3.7293  13.0 ------	UNKNOWN
264.0282 -32.5575    2.0  45.3    7.7   1.0528   5.7 ------	UNKNOWN
Post-slew image of 15-350 keV band
Time interval of the image:
132.500600 533.000590

# RAcent  DECcent POSerr Theta    Phi  PeakCts   SNR AngSep     Name
#  [deg]    [deg]    ['] [deg]  [deg]                   [']
244.9777 -15.6358    0.7  50.5   -9.3   8.9817  16.8    0.3	Sco X-1
254.4326  35.3264    1.2   1.4 -164.9   2.2631   9.8    1.6	Her X-1
268.2566  -1.4467    4.7  38.2  -44.3   0.9342   2.5    6.7	SW J1753.5-0127
288.7086  10.8981    3.0  39.7  -82.5   3.4297   3.9    6.0	GRS 1915+105
299.5953  35.2279    1.5  37.6 -125.1   3.3514   8.0    1.6	Cyg X-1
308.1185  40.9590   14.2  43.2 -135.7   0.4182   0.8    0.5	Cyg X-3
224.8332  63.7427    2.5  34.4  138.1   1.7711   4.6 ------	UNKNOWN
262.9803  58.4323    3.3  25.1  171.9   0.9261   3.5 ------	UNKNOWN
255.6443 -13.1452    2.4  47.4  -22.8   2.2420   4.8 ------	UNKNOWN