Analysis Summary
Notes:
- 1) No attempt has been made to eliminate the non-significant decimal places.
- 2) This batgrbproduct analysis is done using the HEASARC data.
- 3) This batgrbproduct analysis is using the flight position for the mask-weighting calculation.
======================================================================
BAT GRB EVENT DATA PROCESSING REPORT
Process Script Ver: batgrbproduct v2.46
Process Start Time: Sat Mar 14 16:10:07 EDT 2015
Host Name: bat1
Current Working Dir: /local/data/bat1/alien/Swift_3rdBATcatalog/event/batevent_reproc/trigger632995
======================================================================
Trigger: 00632995 Segment: 000
BAT Trigger Time: 446864681.884 [s; MET]
Trigger Stop: 446864681.916 [s; MET]
UTC: 2015-03-01T01:04:28.634980 [includes UTCF correction]
Where From?: (*SHORT BURST*) TDRSS scaled map message
BAT
RA: 244.285852544314 Dec: -48.6970222502195 [deg; J2000]
Catalogged Source?: NO
Point Source?: YES
GRB Indicated?: YES [ by BAT flight software ]
Image S/N Ratio: 13.43
Image Trigger?: NO
Rate S/N Ratio: 43.5201102939779 [ if not an image trigger ]
Image S/N Ratio: 13.43
Analysis Position: [ source = BAT ]
RA: 244.285852544314 Dec: -48.6970222502195 [deg; J2000]
Refined Position: [ source = BAT pre-slew burst ]
RA: 244.280161468935 Dec: -48.7319304348823 [deg; J2000]
{ 16h 17m 07.2s , -48d 43' 54.9" }
+/- 1.86527467161496 [arcmin] (estimated 90% radius based on SNR)
+/- 0.807288209779148 [arcmin] (formal 1-sigma fit error)
SNR: 12.4836895925704
Angular difference between the analysis and refined position is 2.106574 arcmin
Partial Coding Fraction: 0.9609375 [ including projection effects ]
Duration
T90: 0.483999967575073 +/- 0.144055479289884
Measured from: 0
to: 0.483999967575073 [s; relative to TRIGTIME]
T50: 0.179999947547913 +/- 0.116068941971857
Measured from: 0.00800001621246338
to: 0.187999963760376 [s; relative to TRIGTIME]
Fluence
Peak Flux (peak 1 second)
Measured from: -0.220000028610229
to: 0.779999971389771 [s; relative to TRIGTIME]
Total Fluence
Measured from: 0
to: 0.560000002384186 [s; relative to TRIGTIME]
Band 1 Band 2 Band 3 Band 4
15-25 25-50 50-100 100-350 keV
Total 0.036667 0.042247 0.032243 0.009608
0.005555 0.005310 0.004342 0.003608 [error]
Peak 0.039583 0.042439 0.029779 0.011110
0.007154 0.006623 0.005447 0.004677 [error]
[ fluence units of on-axis counts / fully illuminated detector ]
======================================================================
====== Table of the duration information =============================
Value tstart tstop
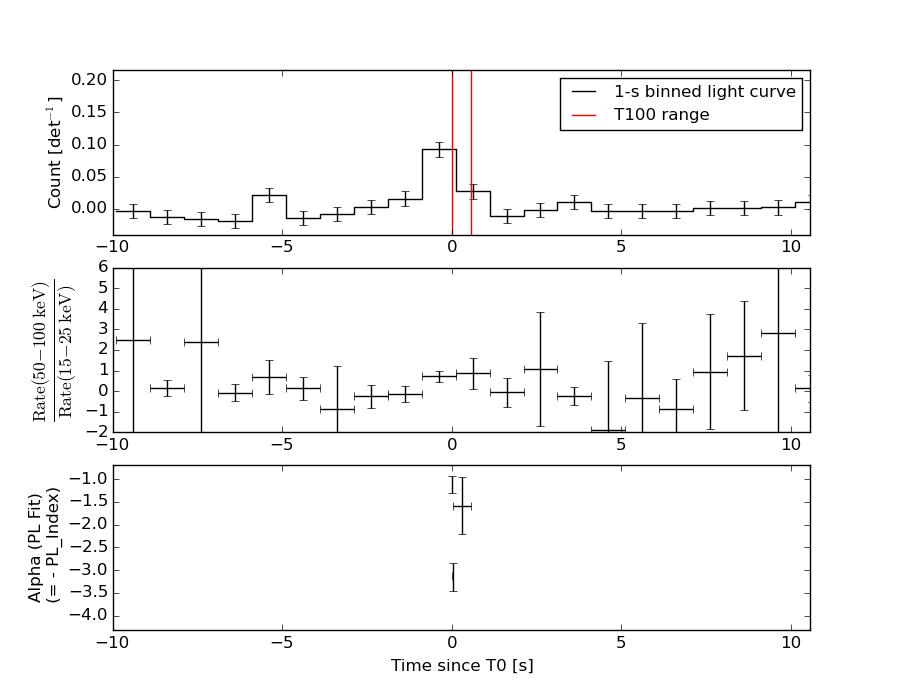
T100 0.560 0.000 0.560
T90 0.484 0.000 0.484
T50 0.180 0.008 0.188
Peak 1.000 -0.220 0.780
====== Spectral Analysis Summary =====================================
Model : spectral model: simple power-law (PL) and cutoff power-law (CPL)
Ph_index : photon index: E^{Ph_index}
Ph_90err : 90% error of the photon index
Epeak : Epeak in keV
Epeak_90err: 90% error of Epeak
Norm : normalization at 50 keV in both the PL model and CPL model
Nomr_90err : 90% error of the normalization
chi2 : Chi-Squared
dof : degree of freedo
=== Time-averaged spectral analysis ===
(Best model with acceptable fit: PL)
Model Ph_index Ph_90err_low Ph_90err_hi Epeak Epeak_90err_low Epeak_90err_hi Norm Nomr_90err_low Norm_90err_hi chi2 dof
PL -1.440 -0.231 0.233 - - - 1.37e-02 -1.73e-03 1.73e-03 53.930 57
CPL -1.436 -0.233 0.623 9999.350 -9999.350 -9999.350 1.38e-02 -1.07e-02 1.39e-02 53.940 56
=== 1-s peak spectral analysis ===
(Best model with acceptable fit: PL)
Model Ph_index Ph_90err_low Ph_90err_hi Epeak Epeak_90err_low Epeak_90err_hi Norm Nomr_90err_low Norm_90err_hi chi2 dof
PL -1.607 -0.294 0.289 - - - 7.50e-03 -1.26e-03 1.24e-03 46.880 57
CPL -1.512 -1.278 1.098 240.488 -240.488 -240.488 8.43e-03 -2.18e-03 2.32e-02 46.930 56
=== Fluence/Peak Flux Summary ===
Model Band1 Band2 Band3 Band4 Band5 Total
15-25 25-50 50-100 100-350 15-150 15-350 keV
Fluence PL 9.27e-09 1.77e-08 2.60e-08 8.23e-08 7.36e-08 1.35e-07 erg/cm2
90%_error_low -2.08e-09 -2.42e-09 -4.27e-09 -2.63e-08 -1.02e-08 -2.98e-08 erg/cm2
90%_error_hi 2.20e-09 2.38e-09 4.22e-09 3.42e-08 1.03e-08 3.62e-08 erg/cm2
Peak flux PL 3.42e-01 3.23e-01 2.12e-01 2.16e-01 9.66e-01 1.09e+00 ph/cm2/s
90%_error_low -8.91e-02 -5.37e-02 -4.60e-02 -8.24e-02 -1.55e-01 -1.73e-01 ph/cm2/s
90%_error_hi 9.53e-02 5.30e-02 4.56e-02 1.11e-01 1.55e-01 1.74e-01 ph/cm2/s
Fluence CPL 9.27e-09 1.75e-08 2.60e-08 8.19e-08 7.46e-08 1.34e-07 erg/cm2
90%_error_low N/A N/A N/A N/A N/A -5.10e-08 erg/cm2
90%_error_hi N/A N/A N/A N/A N/A 1.62e-08 erg/cm2
Peak flux CPL 3.43e-01 3.23e-01 2.12e-01 2.18e-01 9.66e-01 1.10e+00 ph/cm2/s
90%_error_low -1.02e-01 -5.25e-02 -4.59e-02 -1.38e-01 -1.61e-01 -2.52e-01 ph/cm2/s
90%_error_hi 5.34e-02 6.54e-02 4.78e-02 1.07e-01 1.55e-01 1.68e-01 ph/cm2/s
======================================================================
Image
Pre-slew 15.0-350.0 keV image (Event data)
#   RAcent    DECcent   POSerr    Theta     Phi              Peak Cts       SNR   Name
  244.2802   -48.7319   0.0154    16.1008    21.7106         0.1239649     12.484 TRIG_00632995

Foreground time interval of the image:
  0.000   0.560 (delta_t =   0.560 [sec])
Background time interval of the image:
-239.884   0.000 (delta_t = 239.884 [sec])
Light Curves
Note: The mask-weighted lightcurves have units of either count/det or counts/sec/det, where a det is 0.4 x 0.4 = 0.16 sq cm.
Full-time range; 1 s binning
Other quick-look light curves:
- 64 ms binning (zoomed)
- 16 ms binning (zoomed)
- 8 ms binning (zoomed)
- 2 ms binning (zoomed)
- SN=5 or 10 s binning (full-time range)
- Raw light curve
Spectra
- 64 ms binning (zoomed)
- 16 ms binning (zoomed)
- 8 ms binning (zoomed)
- 2 ms binning (zoomed)
- SN=5 or 10 s binning (full-time range)
- Raw light curve
Spectra
Notes:
- 1) The fitting includes the systematic errors.
- 2) When the burst includes telescope slew time periods, the fitting uses an average response file made from multiple 5-s response files through out the slew time plus single time preiod for the non-slew times, and weighted by the total counts in the corresponding time period using addrmf. An average response file is needed becuase a spectral fit using the pre-slew DRM will introduce some errors in both a spectral shape and a normalization if the PHA file contains a lot of the slew/post-slew time interval.
- 3) For fits to more complicated models (e.g. a power-law over a cutoff power-law), the BAT team has decided to require a chi-square improvement of more than 6 for each extra dof.
Time averaged spectrum fit using the average DRM
Power-law model

Time interval is from    0.000 sec. to    0.560 sec.

Spectral model in power-law:
------------------------------------------------------------
Parameters  : value       lower 90%   higher 90%
Photon index: -1.44013     ( -0.23122   0.23317 )
Norm@50keV  : 1.37091E-02    ( -0.00173368   0.00172683 )
------------------------------------------------------------
#Fit statistic : Chi-Squared =          53.93 using 59 PHA bins.
# Reduced chi-squared =         0.9461 for     57 degrees of freedom
# Null hypothesis probability =   5.909914e-01

Photon flux (15-150 keV)    in 0.56 sec: 1.68540 ( -0.21791  0.21873 ) ph/cm2/s
Energy fluence (15-150 keV)             : 7.36086e-08 ( -1.02307e-08  1.03486e-08 ) ergs/cm2
Cutoff power-law model
Time interval is from    0.000 sec. to    0.560 sec.
Spectral model in the cutoff power-law:
------------------------------------------------------------
Parameters  : value       lower 90%   higher 90%
Photon index: -1.43637     ( -0.233244   0.622983 )
Epeak [keV] : 9999.35      ( -9999.36 -9999.36 )
Norm@50keV  : 1.37556E-02    ( -0.0107299   0.0139469 )
------------------------------------------------------------
#Fit statistic : Chi-Squared =          53.94 using 59 PHA bins.
# Reduced chi-squared =         0.9632 for     56 degrees of freedom
# Null hypothesis probability =   5.533389e-01

Photon flux (15-150 keV)    in 0.56 sec: 1.14049 ( -0.367971  0.30424 ) ph/cm2/s
Energy fluence (15-150 keV)             : 7.46306e-08 ( 0  0 ) ergs/cm2
1-s peak spectrum fit
Power-law model

Time interval is from   -0.220 sec. to    0.780 sec.

Spectral model in power-law:
------------------------------------------------------------
Parameters  : value       lower 90%   higher 90%
Photon index: -1.60652     ( -0.293618   0.2892 )
Norm@50keV  : 7.49984E-03    ( -0.00126236   0.00124054 )
------------------------------------------------------------
#Fit statistic : Chi-Squared =          46.88 using 59 PHA bins.
# Reduced chi-squared =         0.8225 for     57 degrees of freedom
# Null hypothesis probability =   8.281827e-01

Photon flux (15-150 keV)    in 1 sec: 0.965752 ( -0.154773  0.155238 ) ph/cm2/s
Energy fluence (15-150 keV)             : 7.00939e-08 ( -1.25393e-08  1.27919e-08 ) ergs/cm2
Cutoff power-law model
Time interval is from   -0.220 sec. to    0.780 sec.
Spectral model in the cutoff power-law:
------------------------------------------------------------
Parameters  : value       lower 90%   higher 90%
Photon index: -1.60468     ( -1.26763   1.10812 )
Epeak [keV] : 9996.48      ( -9997.58 -9997.58 )
Norm@50keV  : 7.51742E-03    ( -0.00127027   0.0240849 )
------------------------------------------------------------
#Fit statistic : Chi-Squared =          46.88 using 59 PHA bins.
# Reduced chi-squared =         0.8372 for     56 degrees of freedom
# Null hypothesis probability =   8.021939e-01

Photon flux (15-150 keV)    in 1 sec: 0.966486 ( -0.160815  0.154594 ) ph/cm2/s
Energy fluence (15-150 keV)             : 4.59484e-08 ( -1.48921e-08  1.0857e-08 ) ergs/cm2
Time-resolved spectra
Distribution
T90 vs. Hardness ratio plot
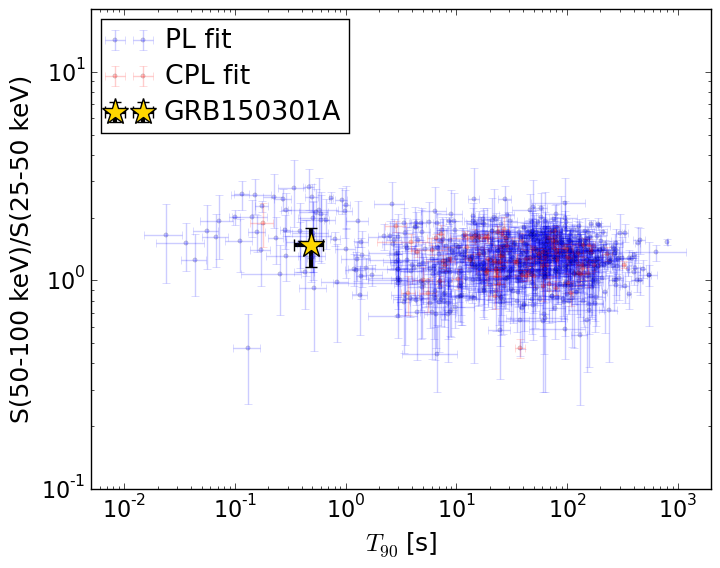
T90                                   = 0.484 sec.
Hardness ratio (energy fluence ratio) = 1.47417776593
S(15-50 keV) vs. S(50-150 keV) plot
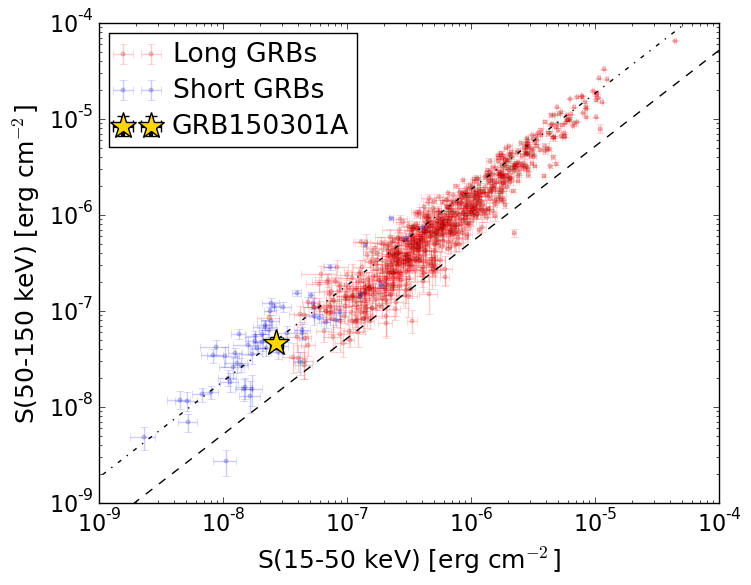
S(15-50 keV)  = 2.6933635e-08
S(50-150 keV) = 4.667549e-08
The dash-dotted line and the dashed line traces the fluences calculated from the Band function with Epeak = 15 and 150 keV, respectively. Both lines assume a canonical values of alpha = -1 and beta = -2.5.
Mask shadow pattern
IMX = 2.681746765815812E-01, IMY = -1.067771607370521E-01
Spacecraft aspect plot
Bright source in the pre-burst/pre-slew/post-slew images
Pre-burst image of 15-350 keV band
Time interval of the image:
-239.884000 0.000000

# RAcent  DECcent POSerr Theta    Phi  PeakCts   SNR AngSep     Name
#  [deg]    [deg]    ['] [deg]  [deg]                   [']
186.8257 -62.5685    7.9  49.8   27.5   1.3143   1.5   13.0	GX 301-2
244.9951 -15.6438    0.3  21.7  143.9  10.3645  42.0    0.9	Sco X-1
255.9964 -37.8422    0.7   2.8   -9.1   3.8330  17.8    0.5	4U 1700-377
256.4931 -36.4027    1.6   1.4  -28.0   1.5642   7.1    3.0	GX 349+2
262.9192 -24.7252    3.2  12.0 -154.4   0.8676   3.7    5.0	GX 1+4
264.5326 -44.5092    8.1  11.5  -39.4  -0.3310  -1.4    9.7	4U 1735-44
268.3444  -1.4855   12.8  35.6 -165.0   0.2814   0.9    2.4	SW J1753.5-0127
270.2649 -25.2125    7.9  15.9 -131.4   0.3754   1.6    8.1	GX 5-1
270.3191 -25.7116    5.5  15.6 -129.8   0.6163   2.5    2.1	GRS 1758-258
274.0064 -14.0359    2.8  26.6 -144.4   1.0604   4.0    0.0	GX 17+2
275.9979 -30.4071    4.9  17.5 -106.6   0.5931   2.4    4.5	H1820-303
285.0812 -24.9359   14.4  27.1 -110.7   0.2785   0.8    2.6	HT1900.1-2455
263.1775 -33.6930    0.0   6.2 -107.7   0.5929   2.6   12.7	GX 354-0
270.9836 -34.3155    2.2  12.4  -96.0   1.2220   5.2 ------	UNKNOWN
282.6026 -69.4234    2.7  37.4  -21.9   1.2566   4.3 ------	UNKNOWN
312.9517 -46.2110    3.2  43.7  -64.0   4.3807   3.6 ------	UNKNOWN
Pre-slew background subtracted image of 15-350 keV band
Time interval of the image:
0.000000 0.560000

# RAcent  DECcent POSerr Theta    Phi  PeakCts   SNR AngSep     Name
#  [deg]    [deg]    ['] [deg]  [deg]                   [']
186.6559 -62.8316    3.4  49.9   27.1  -0.1313  -3.4    3.7	GX 301-2
245.0919 -15.8023    9.0  21.6  143.9  -0.0132  -1.3   11.7	Sco X-1
255.9178 -37.9887    3.6   2.9   -7.7  -0.0295  -3.2    9.3	4U 1700-377
256.6052 -36.2875    5.3   1.4  -33.3  -0.0202  -2.2   11.5	GX 349+2
262.8606 -24.8009   12.5  11.9 -154.4   0.0086   0.9    8.7	GX 1+4
264.5506 -44.5974    8.2  11.6  -39.1   0.0127   1.4   12.1	4U 1735-44
268.3668  -1.3034    3.9  35.7 -165.0   0.0344   2.9    8.9	SW J1753.5-0127
270.2029 -25.0460   18.7  15.9 -131.9  -0.0058  -0.6    4.8	GX 5-1
270.3485 -25.8381    9.8  15.5 -129.4   0.0111   1.2    6.2	GRS 1758-258
274.0741 -14.1837    5.2  26.6 -144.1   0.0237   2.2    9.7	GX 17+2
276.0894 -30.2729    7.4  17.7 -106.9  -0.0158  -1.6   10.2	H1820-303
284.8933 -24.7970  246.6  27.1 -111.2   0.0006   0.0   10.7	HT1900.1-2455
263.1614 -33.9911    0.0   6.1 -105.0   0.0187   2.0   12.7	GX 354-0
244.2801 -48.7319    0.9  16.1   21.7   0.1240  12.5 ------	UNKNOWN
258.7123 -17.8667    2.3  17.4 -177.7   0.0475   5.0 ------	UNKNOWN
 10.0730 -84.0385    2.3  57.5  -13.2   0.2163   5.1 ------	UNKNOWN
Post-slew image of 15-350 keV band
Time interval of the image:
47.216600 179.016600

# RAcent  DECcent POSerr Theta    Phi  PeakCts   SNR AngSep     Name
#  [deg]    [deg]    ['] [deg]  [deg]                   [']
170.1116 -60.8051   28.8  42.0   34.2   0.1393   0.4   12.5	Cen X-3
186.8127 -62.8824    3.6  33.9   33.2   0.7333   3.2    8.0	GX 301-2
244.9678 -15.6362    0.4  33.1  170.7   5.7362  28.9    0.7	Sco X-1
255.9832 -37.8308    1.9  13.8 -148.3   0.9275   6.1    0.8	4U 1700-377
256.3792 -36.4182    3.6  15.1 -150.3   0.4977   3.2    2.7	GX 349+2
262.9499 -24.7019    5.3  28.1 -152.4   0.3327   2.2    4.2	GX 1+4
264.7075 -44.4470   24.6  14.6 -109.7  -0.0702  -0.5    1.5	4U 1735-44
268.3963  -1.4530   81.2  51.6 -159.0   0.0561   0.1    1.7	SW J1753.5-0127
270.4098 -24.9347    0.0  31.3 -140.3   0.7171   3.7   11.0	GX 5-1
270.2405 -25.7896    6.7  30.5 -139.6   0.3247   1.7    4.4	GRS 1758-258
274.0046 -14.0375   22.3  42.4 -145.0   0.1430   0.5    0.1	GX 17+2
275.9371 -30.4097    6.1  30.1 -126.1   0.3967   1.9    2.6	H1820-303
285.1472 -24.7924    5.0  39.8 -122.4   0.7367   2.3    9.8	HT1900.1-2455
262.8264 -33.9817    0.0  20.1 -140.6   0.3015   2.2   12.0	GX 354-0
191.5128 -37.5391    3.5  39.3   75.8   2.2112   3.3 ------	UNKNOWN
157.9671 -55.4762    3.2  50.0   37.2   3.0416   3.6 ------	UNKNOWN
227.4586  -2.7410    3.1  48.2  146.7   2.3335   3.8 ------	UNKNOWN
122.8623 -69.2730    2.7  54.5   11.4   3.1651   4.2 ------	UNKNOWN
120.5436 -73.1069    2.2  52.2    7.4   2.5600   5.4 ------	UNKNOWN