Analysis Summary
Notes:
- 1) No attempt has been made to eliminate the non-significant decimal places.
- 2) This batgrbproduct analysis is done using the HEASARC data.
- 3) This batgrbproduct analysis is using the flight position for the mask-weighting calculation.
======================================================================
BAT GRB EVENT DATA PROCESSING REPORT
Process Script Ver: batgrbproduct v2.46
Process Start Time: Mon Apr 6 02:57:28 EDT 2015
Host Name: bat1
Current Working Dir: /local/data/bat1/alien/Swift_3rdBATcatalog/event/batevent_reproc/trigger635148
======================================================================
Trigger: 00635148 Segment: 000
BAT Trigger Time: 448258975.296 [s; MET]
Trigger Stop: 448258975.808 [s; MET]
UTC: 2015-03-17T04:22:41.976060 [includes UTCF correction]
Where From?: TDRSS position message
BAT
RA: 138.935547486144 Dec: 55.4522389164227 [deg; J2000]
Catalogged Source?: NO
Point Source?: YES
GRB Indicated?: YES [ by BAT flight software ]
Image S/N Ratio: 8.73
Image Trigger?: NO
Rate S/N Ratio: 13.0384048104053 [ if not an image trigger ]
Image S/N Ratio: 8.73
Analysis Position: [ source = BAT ]
RA: 138.935547486144 Dec: 55.4522389164227 [deg; J2000]
Refined Position: [ source = BAT pre-slew burst ]
RA: 138.99883136461 Dec: 55.4749826921804 [deg; J2000]
{ 09h 15m 59.7s , +55d 28' 29.9" }
+/- 1.76902617525697 [arcmin] (estimated 90% radius based on SNR)
+/- 0.713630398286199 [arcmin] (formal 1-sigma fit error)
SNR: 13.4651841051028
Angular difference between the analysis and refined position is 2.548746 arcmin
Partial Coding Fraction: 0.78125 [ including projection effects ]
Duration
T90: 23.283999979496 +/- 0.850129364648628
Measured from: -0.0360000133514404
to: 23.2479999661446 [s; relative to TRIGTIME]
T50: 17.1959999799728 +/- 3.14955489580404
Measured from: 1.83999997377396
to: 19.0359999537468 [s; relative to TRIGTIME]
Fluence
Peak Flux (peak 1 second)
Measured from: -0.148000001907349
to: 0.851999998092651 [s; relative to TRIGTIME]
Total Fluence
Measured from: -0.435999989509583
to: 23.9919999837875 [s; relative to TRIGTIME]
Band 1 Band 2 Band 3 Band 4
15-25 25-50 50-100 100-350 keV
Total 0.321439 0.379847 0.286047 0.078942
0.029921 0.030994 0.026701 0.022166 [error]
Peak 0.032898 0.053054 0.055835 0.006020
0.006458 0.007104 0.006313 0.004985 [error]
[ fluence units of on-axis counts / fully illuminated detector ]
======================================================================
====== Table of the duration information =============================
Value tstart tstop
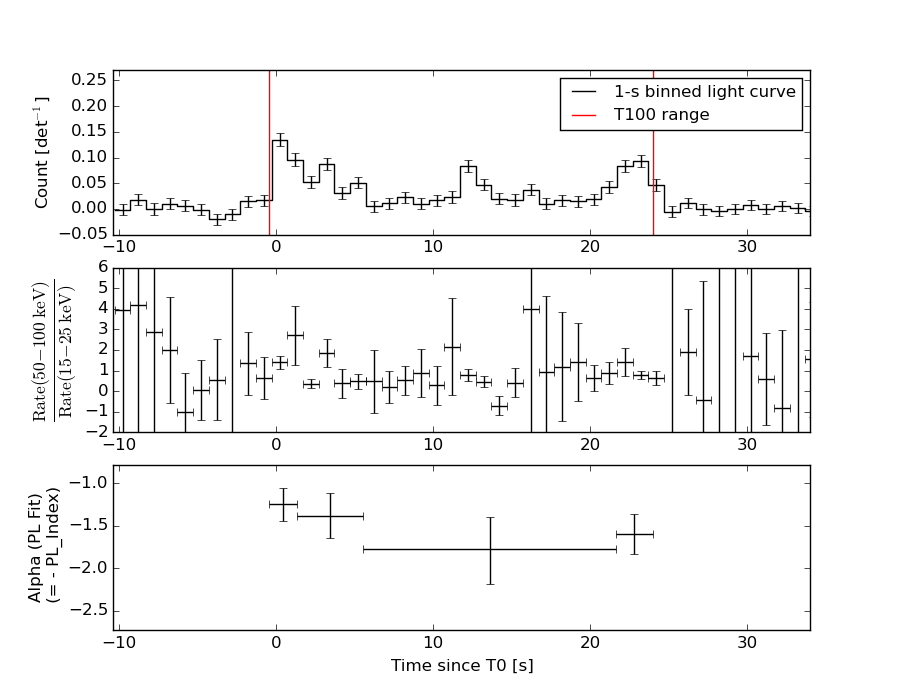
T100 24.428 -0.436 23.992
T90 23.284 -0.036 23.248
T50 17.196 1.840 19.036
Peak 1.000 -0.148 0.852
====== Spectral Analysis Summary =====================================
Model : spectral model: simple power-law (PL) and cutoff power-law (CPL)
Ph_index : photon index: E^{Ph_index}
Ph_90err : 90% error of the photon index
Epeak : Epeak in keV
Epeak_90err: 90% error of Epeak
Norm : normalization at 50 keV in both the PL model and CPL model
Nomr_90err : 90% error of the normalization
chi2 : Chi-Squared
dof : degree of freedo
=== Time-averaged spectral analysis ===
(Best model with acceptable fit: PL)
Model Ph_index Ph_90err_low Ph_90err_hi Epeak Epeak_90err_low Epeak_90err_hi Norm Nomr_90err_low Norm_90err_hi chi2 dof
PL -1.505 -0.159 0.157 - - - 2.80e-03 -2.46e-04 2.44e-04 50.800 57
CPL -1.509 -0.154 0.171 9999.320 -9999.320 -9999.320 2.80e-03 -1.73e-03 -1.15e-03 50.820 56
=== 1-s peak spectral analysis ===
(Best model with acceptable fit: PL)
Model Ph_index Ph_90err_low Ph_90err_hi Epeak Epeak_90err_low Epeak_90err_hi Norm Nomr_90err_low Norm_90err_hi chi2 dof
PL -1.201 -0.222 0.225 - - - 9.98e-03 -1.32e-03 1.32e-03 65.020 57
CPL -0.623 -0.682 0.973 128.585 -51.300 -128.585 1.88e-02 -9.64e-03 3.25e-02 63.520 56
=== Fluence/Peak Flux Summary ===
Model Band1 Band2 Band3 Band4 Band5 Total
15-25 25-50 50-100 100-350 15-150 15-350 keV
Fluence PL 8.78e-08 1.61e-07 2.27e-07 6.70e-07 6.48e-07 1.15e-06 erg/cm2
90%_error_low -1.28e-08 -1.42e-08 -2.67e-08 -1.57e-07 -6.30e-08 -1.80e-07 erg/cm2
90%_error_hi 1.33e-08 1.41e-08 2.66e-08 1.88e-07 6.37e-08 2.05e-07 erg/cm2
Peak flux PL 3.09e-01 3.71e-01 3.23e-01 4.81e-01 1.17e+00 1.48e+00 ph/cm2/s
90%_error_low -7.25e-02 -5.65e-02 -5.03e-02 -1.39e-01 -1.58e-01 -2.08e-01 ph/cm2/s
90%_error_hi 7.79e-02 5.56e-02 4.97e-02 1.71e-01 1.58e-01 2.13e-01 ph/cm2/s
Fluence CPL 8.78e-08 1.59e-07 2.27e-07 7.28e-07 6.53e-07 1.14e-06 erg/cm2
90%_error_low -1.28e-08 N/A -2.68e-08 N/A -6.79e-08 -2.83e-07 erg/cm2
90%_error_hi 1.33e-08 N/A 2.66e-08 N/A 5.88e-08 1.97e-07 erg/cm2
Peak flux CPL 2.72e-01 3.88e-01 3.43e-01 2.71e-01 1.15e+00 1.27e+00 ph/cm2/s
90%_error_low -8.79e-02 -6.27e-02 -5.84e-02 -1.46e-01 -1.62e-01 -2.27e-01 ph/cm2/s
90%_error_hi 9.23e-02 6.48e-02 6.04e-02 2.71e-01 1.62e-01 3.29e-01 ph/cm2/s
======================================================================
Image
Pre-slew 15.0-350.0 keV image (Event data)
#   RAcent    DECcent   POSerr    Theta     Phi              Peak Cts       SNR   Name
  138.9988    55.4750   0.0143    17.2199    66.4855         0.5456560     13.465 TRIG_00635148

Foreground time interval of the image:
 -0.436  10.405 (delta_t =  10.841 [sec])
Background time interval of the image:
-239.296  -0.436 (delta_t = 238.860 [sec])
Light Curves
Note: The mask-weighted lightcurves have units of either count/det or counts/sec/det, where a det is 0.4 x 0.4 = 0.16 sq cm.
Full-time range; 1 s binning
Other quick-look light curves:
- 64 ms binning (zoomed)
- 16 ms binning (zoomed)
- 8 ms binning (zoomed)
- 2 ms binning (zoomed)
- SN=5 or 10 s binning (full-time range)
- Raw light curve
Spectra
- 64 ms binning (zoomed)
- 16 ms binning (zoomed)
- 8 ms binning (zoomed)
- 2 ms binning (zoomed)
- SN=5 or 10 s binning (full-time range)
- Raw light curve
Spectra
Notes:
- 1) The fitting includes the systematic errors.
- 2) When the burst includes telescope slew time periods, the fitting uses an average response file made from multiple 5-s response files through out the slew time plus single time preiod for the non-slew times, and weighted by the total counts in the corresponding time period using addrmf. An average response file is needed becuase a spectral fit using the pre-slew DRM will introduce some errors in both a spectral shape and a normalization if the PHA file contains a lot of the slew/post-slew time interval.
- 3) For fits to more complicated models (e.g. a power-law over a cutoff power-law), the BAT team has decided to require a chi-square improvement of more than 6 for each extra dof.
Time averaged spectrum fit using the average DRM
Power-law model
Time interval is from   -0.436 sec. to   23.992 sec.

Spectral model in power-law:
------------------------------------------------------------
Parameters  : value       lower 90%   higher 90%
Photon index: -1.50516     ( -0.158691   0.157476 )
Norm@50keV  : 2.79983E-03    ( -0.000246057   0.000244136 )
------------------------------------------------------------
#Fit statistic : Chi-Squared =          50.80 using 59 PHA bins.
# Reduced chi-squared =         0.8912 for     57 degrees of freedom
# Null hypothesis probability =   7.054922e-01

Photon flux (15-150 keV)    in 24.43 sec: 0.350024 ( -0.029975  0.030035 ) ph/cm2/s
Energy fluence (15-150 keV)             : 6.48416e-07 ( -6.29881e-08  6.37044e-08 ) ergs/cm2
Cutoff power-law model
Time interval is from   -0.436 sec. to   23.992 sec.
Spectral model in the cutoff power-law:
------------------------------------------------------------
Parameters  : value       lower 90%   higher 90%
Photon index: -2.12629     ( -0.154062   0.170514 )
Epeak [keV] : 47.9466      ( -9999.36 -9999.36 )
Norm@50keV  : 1.33268E-03    ( -0.000260872   0.000313584 )
------------------------------------------------------------
#Fit statistic : Chi-Squared =          49.94 using 59 PHA bins.
# Reduced chi-squared =         0.8918 for     56 degrees of freedom
# Null hypothesis probability =   7.023210e-01

Photon flux (15-150 keV)    in 24.43 sec: 0.352388 ( -0.032397  0.027619 ) ph/cm2/s
Energy fluence (15-150 keV)             : 6.53046e-07 ( -6.78739e-08  5.88289e-08 ) ergs/cm2
1-s peak spectrum fit
Power-law model
Time interval is from   -0.148 sec. to    0.852 sec.

Spectral model in power-law:
------------------------------------------------------------
Parameters  : value       lower 90%   higher 90%
Photon index: -1.20127     ( -0.222145   0.224944 )
Norm@50keV  : 9.97830E-03    ( -0.00132091   0.00132014 )
------------------------------------------------------------
#Fit statistic : Chi-Squared =          65.02 using 59 PHA bins.
# Reduced chi-squared =          1.141 for     57 degrees of freedom
# Null hypothesis probability =   2.177036e-01

Photon flux (15-150 keV)    in 1 sec: 1.17146 ( -0.15762  0.15786 ) ph/cm2/s
Energy fluence (15-150 keV)             : 1.01209e-07 ( -1.49628e-08  1.51179e-08 ) ergs/cm2
Cutoff power-law model
Time interval is from   -0.148 sec. to    0.852 sec.
Spectral model in the cutoff power-law:
------------------------------------------------------------
Parameters  : value       lower 90%   higher 90%
Photon index: -0.622588     ( -0.682058   0.973353 )
Epeak [keV] : 128.585      ( -51.3142 -128.599 )
Norm@50keV  : 1.87737E-02    ( -0.00963963   0.0324696 )
------------------------------------------------------------
#Fit statistic : Chi-Squared =          63.52 using 59 PHA bins.
# Reduced chi-squared =          1.134 for     56 degrees of freedom
# Null hypothesis probability =   2.286201e-01

Photon flux (15-150 keV)    in 1 sec: 1.14655 ( -0.161992  0.16179 ) ph/cm2/s
Energy fluence (15-150 keV)             : 9.79986e-08 ( -1.58273e-08  1.5869e-08 ) ergs/cm2
Time-resolved spectra
Distribution
T90 vs. Hardness ratio plot
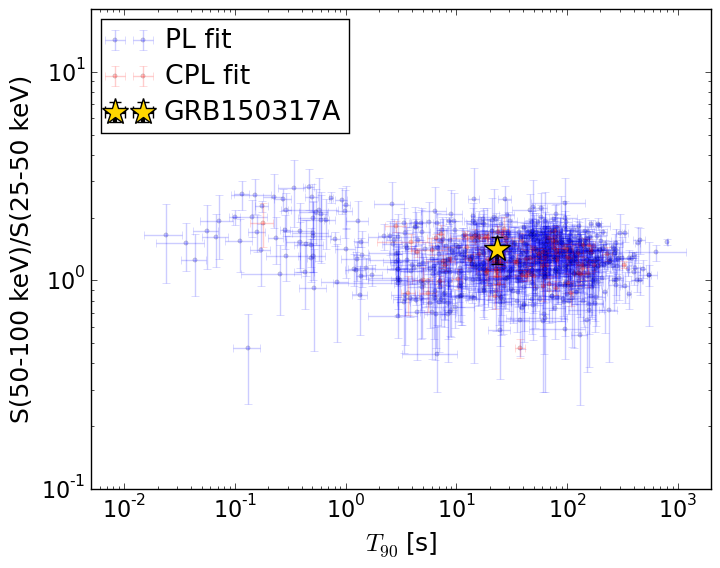
T90                                   = 23.284 sec.
Hardness ratio (energy fluence ratio) = 1.40922428267
S(15-50 keV) vs. S(50-150 keV) plot
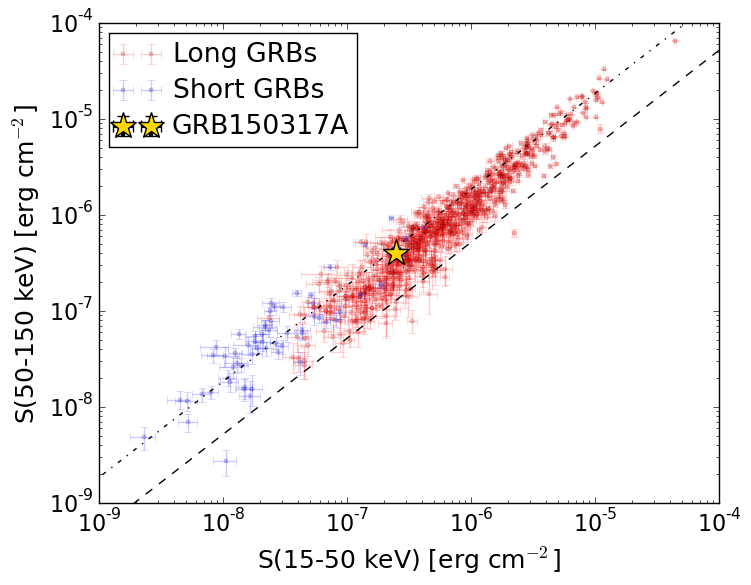
S(15-50 keV)  = 2.4852171e-07
S(50-150 keV) = 3.998904e-07
The dash-dotted line and the dashed line traces the fluences calculated from the Band function with Epeak = 15 and 150 keV, respectively. Both lines assume a canonical values of alpha = -1 and beta = -2.5.
Mask shadow pattern
IMX = 1.236572072202750E-01, IMY = -2.841953609162477E-01
Spacecraft aspect plot
Bright source in the pre-burst/pre-slew/post-slew images
Pre-burst image of 15-350 keV band
Time interval of the image:
-239.296000 -0.436000

# RAcent  DECcent POSerr Theta    Phi  PeakCts   SNR AngSep     Name
#  [deg]    [deg]    ['] [deg]  [deg]                   [']
 83.6283  22.0203    0.3  40.8 -166.9   9.9646  33.6    0.4	Crab
159.6704  70.7751    2.4  23.9   17.9   1.0172   4.8 ------	UNKNOWN
 39.2960  46.4139    2.4  41.2  -98.6   4.8698   4.7 ------	UNKNOWN
Pre-slew background subtracted image of 15-350 keV band
Time interval of the image:
-0.436000 10.404590

# RAcent  DECcent POSerr Theta    Phi  PeakCts   SNR AngSep     Name
#  [deg]    [deg]    ['] [deg]  [deg]                   [']
 83.6425  21.8835    3.6  40.9 -167.0   0.1750   3.2    7.9	Crab
138.9988  55.4750    0.9  17.2   66.5   0.5456  13.5 ------	UNKNOWN
Post-slew image of 15-350 keV band
Time interval of the image:
49.004600 417.534900
418.704000 477.384000
478.704000 962.799800

# RAcent  DECcent POSerr Theta    Phi  PeakCts   SNR AngSep     Name
#  [deg]    [deg]    ['] [deg]  [deg]                   [']
 83.6410  22.0095    0.7  52.5 -152.3  30.7545  16.4    0.5	Crab
229.2940  75.8780    3.0  37.1  -22.1   2.7448   3.9 ------	UNKNOWN
 71.3634  37.0921    2.1  48.0 -129.0  12.8816   5.5 ------	UNKNOWN