Analysis Summary
Notes:
- 1) No attempt has been made to eliminate the non-significant decimal places.
- 2) This batgrbproduct analysis is done using the HEASARC data.
- 3) This batgrbproduct analysis is using the flight position for the mask-weighting calculation.
======================================================================
                  BAT GRB EVENT DATA PROCESSING REPORT
    Process Script Ver: batgrbproduct v2.46
    Process Start Time: Tue May  5 10:38:07 EDT 2015
             Host Name: bat1
   Current Working Dir: /local/data/bat1/alien/Swift_3rdBATcatalog/event/batevent_reproc/trigger635289
======================================================================

  Trigger: 00635289      Segment: 000

  BAT Trigger Time: 448355106.624   [s; MET]
      Trigger Stop: 448355123.008   [s; MET]
               UTC: 2015-03-18T07:04:53.299140    [includes UTCF correction]
       Where From?: TDRSS position message

  BAT
    RA: 324.970714696083   Dec: -61.4766556855567  [deg; J2000]

     Catalogged Source?: NO
     Point Source?:      YES
     GRB Indicated?:     YES    [ by BAT flight software ]
     Image S/N Ratio:    9.87
     Image Trigger?:     NO
     Rate S/N Ratio:     10.0995049383621  [ if not an image trigger ]
     Image S/N Ratio:    9.87

  Analysis Position:   [ source = BAT ]
    RA: 324.970714696083   Dec: -61.4766556855567  [deg; J2000]

  Refined Position:   [ source = BAT pre-slew burst ]
    RA: 324.988048838298   Dec: -61.4611862967479  [deg; J2000]
        { 21h 39m 57.1s , -61d 27' 40.3" }
         +/- 1.19149830001568 [arcmin] (estimated 90% radius based on SNR)
         +/- 0.418628160288125 [arcmin] (formal 1-sigma fit error)
    SNR: 23.681733210239

  Angular difference between the analysis and refined position is 1.052740 arcmin

  Partial Coding Fraction: 0.4453125    [ including projection effects ]

  Duration
     T90: 87.4439999461174 +/- 20.8383346645468
        Measured from: 3.03600001335144
                   to: 90.4799999594688     [s; relative to TRIGTIME]
     T50: 42.5719999074936 +/- 4.02978513486005
        Measured from: 23.6800000071526
                   to: 66.2519999146461     [s; relative to TRIGTIME]


  Fluence
     Peak Flux  (peak 1 second)
        Measured from: 66.6159999966621
                   to: 67.6159999966621     [s; relative to TRIGTIME]
     Total Fluence
        Measured from: -4.51600003242493
                   to: 115.004000008106     [s; relative to TRIGTIME]

             Band 1     Band 2     Band 3     Band 4
              15-25      25-50     50-100    100-350     keV
 Total     1.596368   1.902663   0.749545   0.195369
           0.088456   0.091099   0.079386   0.069927 [error]
 Peak      0.050931   0.059104   0.015600   0.006037
           0.008889   0.009238   0.007454   0.006793 [error]

     [ fluence units of on-axis counts / fully illuminated detector ]

======================================================================


====== Table of the duration information =============================

        Value   tstart    tstop
T100  119.520   -4.516  115.004
T90    87.444    3.036   90.480
T50    42.572   23.680   66.252
Peak    1.000   66.616   67.616


====== Spectral Analysis Summary =====================================

Model      : spectral model: simple power-law (PL) and cutoff power-law (CPL)
Ph_index   : photon index: E^{Ph_index}
Ph_90err   : 90% error of the photon index
Epeak      : Epeak in keV
Epeak_90err: 90% error of Epeak
Norm       : normalization at 50 keV in both the PL model and CPL model
Nomr_90err : 90% error of the normalization
chi2       : Chi-Squared
dof        : degree of freedo

=== Time-averaged spectral analysis ===
(Best model with acceptable fit: PL)

Model Ph_index Ph_90err_low Ph_90err_hi  Epeak  Epeak_90err_low  Epeak_90err_hi  Norm       Nomr_90err_low    Norm_90err_hi    chi2    dof
PL      -2.057    -0.122      0.119       -           -               -         2.22e-03     -1.74e-04          1.71e-04      69.300   57
CPL     -1.529    -0.490      0.633       36.300     -32.017        14.100      4.51e-03     -2.18e-03          6.11e-03      66.470   56


=== 1-s peak spectral analysis ===
(Best model with acceptable fit: PL)

Model Ph_index Ph_90err_low Ph_90err_hi  Epeak  Epeak_90err_low  Epeak_90err_hi  Norm       Nomr_90err_low    Norm_90err_hi    chi2    dof
PL      -2.039     -0.384     0.353       -           -               -         7.39e-03     -1.92e-03          1.86e-03      57.880   57
CPL     -1.116     -1.005     5.451       34.984      N/A           N/A         2.83e-02        N/A               N/A         57.220   56


=== Fluence/Peak Flux Summary ===

              Model    Band1     Band2     Band3     Band4     Band5     Total
                       15-25     25-50    50-100    100-350    15-150    15-350    keV
Fluence         PL   5.73e-07  7.51e-07  7.22e-07  1.23e-06  2.45e-06  3.28e-06   erg/cm2
      90%_error_low -5.23e-08 -4.69e-08 -7.70e-08 -2.45e-07 -1.77e-07 -3.33e-07   erg/cm2
      90%_error_hi   5.33e-08  4.69e-08  7.82e-08  2.84e-07  1.79e-07  3.61e-07   erg/cm2
Peak flux       PL   5.11e-01  3.75e-01  1.83e-01  1.26e-01  1.13e+00  1.19e+00   ph/cm2/s
      90%_error_low -1.39e-01 -7.56e-02 -5.96e-02 -6.37e-02 -2.27e-01 -2.41e-01   ph/cm2/s
      90%_error_hi   1.44e-01  7.55e-02  6.21e-02  9.54e-02  2.27e-01  2.42e-01   ph/cm2/s

Fluence        CPL   5.48e-07  7.96e-07  6.94e-07  4.81e-07  2.31e-06  2.52e-06   erg/cm2
      90%_error_low -5.91e-08 -6.51e-08 -9.74e-08 -2.85e-07 -2.22e-07 -3.71e-07   erg/cm2
      90%_error_hi   5.92e-08  6.71e-08  8.94e-08  7.46e-07  2.28e-07  7.79e-07   erg/cm2
Peak flux      CPL   4.94e-01  4.19e-01  1.63e-01  3.02e-02  1.10e+00  1.11e+00   ph/cm2/s
      90%_error_low -7.96e-02     N/A   -1.29e-01 -3.02e-02 -2.42e-01 -2.48e-01   ph/cm2/s
      90%_error_hi   1.50e-01     N/A    7.79e-02  1.32e-01  2.35e-01  3.07e-01   ph/cm2/s

======================================================================
Image
Pre-slew 15.0-350.0 keV image (Event data)
#   RAcent    DECcent   POSerr    Theta     Phi              Peak Cts       SNR   Name
  324.9880   -61.4612   0.0081    33.5054   148.3565         4.1721371     23.682 TRIG_00635289

Foreground time interval of the image:
 -4.516  76.877 (delta_t =  81.393 [sec])
Background time interval of the image:
-361.323 -345.494 (delta_t =  15.829 [sec])
-239.624  -4.516 (delta_t = 235.108 [sec])
Light Curves
Note: The mask-weighted lightcurves have units of either count/det or counts/sec/det, where a det is 0.4 x 0.4 = 0.16 sq cm.
Full-time range; 1 s binning
Other quick-look light curves:
- 64 ms binning (zoomed)
- 16 ms binning (zoomed)
- 8 ms binning (zoomed)
- 2 ms binning (zoomed)
- SN=5 or 10 s binning (full-time range)
- Raw light curve
Spectra
- 64 ms binning (zoomed)
- 16 ms binning (zoomed)
- 8 ms binning (zoomed)
- 2 ms binning (zoomed)
- SN=5 or 10 s binning (full-time range)
- Raw light curve
Spectra
Notes:
- 1) The fitting includes the systematic errors.
- 2) When the burst includes telescope slew time periods, the fitting uses an average response file made from multiple 5-s response files through out the slew time plus single time preiod for the non-slew times, and weighted by the total counts in the corresponding time period using addrmf. An average response file is needed becuase a spectral fit using the pre-slew DRM will introduce some errors in both a spectral shape and a normalization if the PHA file contains a lot of the slew/post-slew time interval.
- 3) For fits to more complicated models (e.g. a power-law over a cutoff power-law), the BAT team has decided to require a chi-square improvement of more than 6 for each extra dof.
Time averaged spectrum fit using the average DRM
Power-law model
Time interval is from   -4.516 sec. to  115.004 sec.

Spectral model in power-law:
------------------------------------------------------------
Parameters  : value       lower 90%   higher 90%
Photon index: -2.05709     ( -0.12247   0.119035 )
Norm@50keV  : 2.21867E-03    ( -0.000173524   0.00017127 )
------------------------------------------------------------
#Fit statistic : Chi-Squared =          69.30 using 59 PHA bins.
# Reduced chi-squared =          1.216 for     57 degrees of freedom
# Null hypothesis probability =   1.271279e-01

Photon flux (15-150 keV)    in 119.5 sec: 0.341870 ( -0.021649  0.021667 ) ph/cm2/s
Energy fluence (15-150 keV)             : 2.45459e-06 ( -1.76725e-07  1.78816e-07 ) ergs/cm2
Cutoff power-law model
Time interval is from   -4.516 sec. to  115.004 sec.
Spectral model in the cutoff power-law:
------------------------------------------------------------
Parameters  : value       lower 90%   higher 90%
Photon index: -1.52868     ( -0.490048   0.633019 )
Epeak [keV] : 36.2999      ( -32.0192 14.0978 )
Norm@50keV  : 4.51442E-03    ( -0.00218143   0.00610071 )
------------------------------------------------------------
#Fit statistic : Chi-Squared =          66.47 using 59 PHA bins.
# Reduced chi-squared =          1.187 for     56 degrees of freedom
# Null hypothesis probability =   1.597806e-01

Photon flux (15-150 keV)    in 119.5 sec: 0.333672 ( -0.023238  0.023143 ) ph/cm2/s
Energy fluence (15-150 keV)             : 2.30988e-06 ( -2.22368e-07  2.28103e-07 ) ergs/cm2
1-s peak spectrum fit
Power-law model
Time interval is from   66.616 sec. to   67.616 sec.

Spectral model in power-law:
------------------------------------------------------------
Parameters  : value       lower 90%   higher 90%
Photon index: -2.03878     ( -0.384229   0.353454 )
Norm@50keV  : 7.38764E-03    ( -0.00192383   0.00186068 )
------------------------------------------------------------
#Fit statistic : Chi-Squared =          57.88 using 59 PHA bins.
# Reduced chi-squared =          1.015 for     57 degrees of freedom
# Null hypothesis probability =   4.425228e-01

Photon flux (15-150 keV)    in 1 sec: 1.12846 ( -0.226721  0.22678 ) ph/cm2/s
Energy fluence (15-150 keV)             : 6.83015e-08 ( -1.61196e-08  1.673e-08 ) ergs/cm2
Cutoff power-law model
Time interval is from   66.616 sec. to   67.616 sec.
Spectral model in the cutoff power-law:
------------------------------------------------------------
Parameters  : value       lower 90%   higher 90%
Photon index: -1.1161     ( -1.01197   5.44445 )
Epeak [keV] : 34.9837      (   )
Norm@50keV  : 2.82761E-02    (     )
------------------------------------------------------------
#Fit statistic : Chi-Squared =          57.22 using 59 PHA bins.
# Reduced chi-squared =          1.022 for     56 degrees of freedom
# Null hypothesis probability =   4.297162e-01

Photon flux (15-150 keV)    in 1 sec: 1.09983 ( -0.24205  0.23504 ) ph/cm2/s
Energy fluence (15-150 keV)             : 6.04338e-08 ( -2.01129e-08  2.1507e-08 ) ergs/cm2
Time-resolved spectra
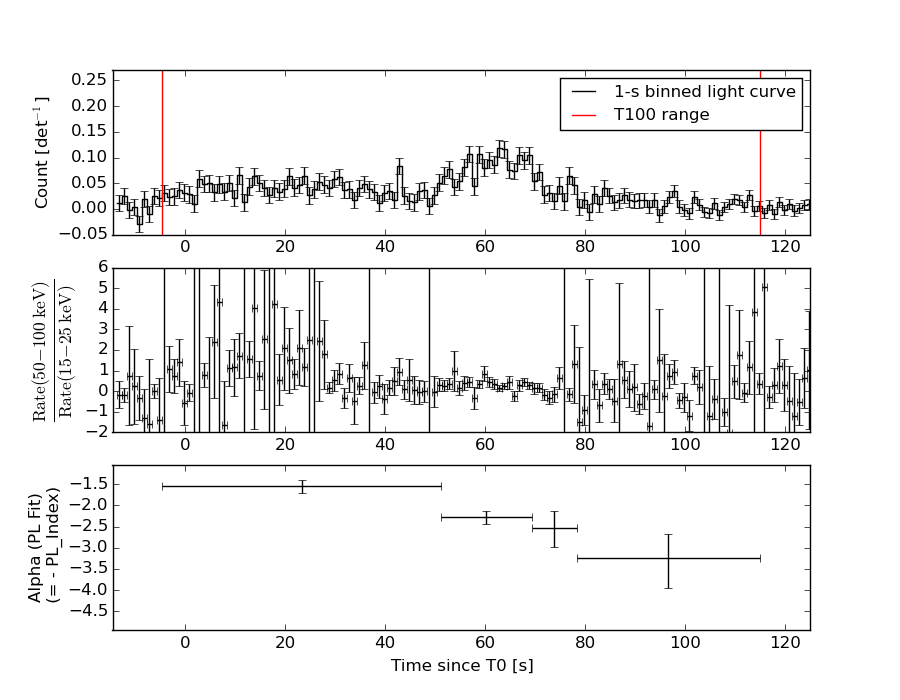
Distribution
T90 vs. Hardness ratio plot
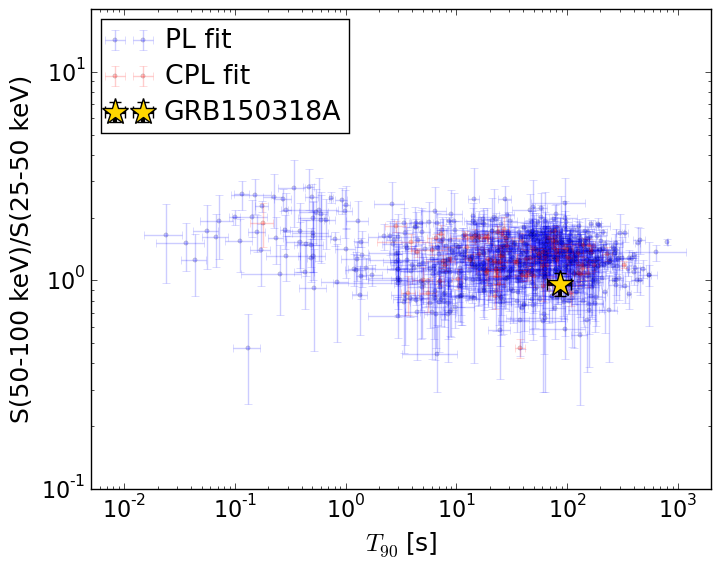
T90                                   = 87.444 sec.
Hardness ratio (energy fluence ratio) = 0.961236006156
S(15-50 keV) vs. S(50-150 keV) plot
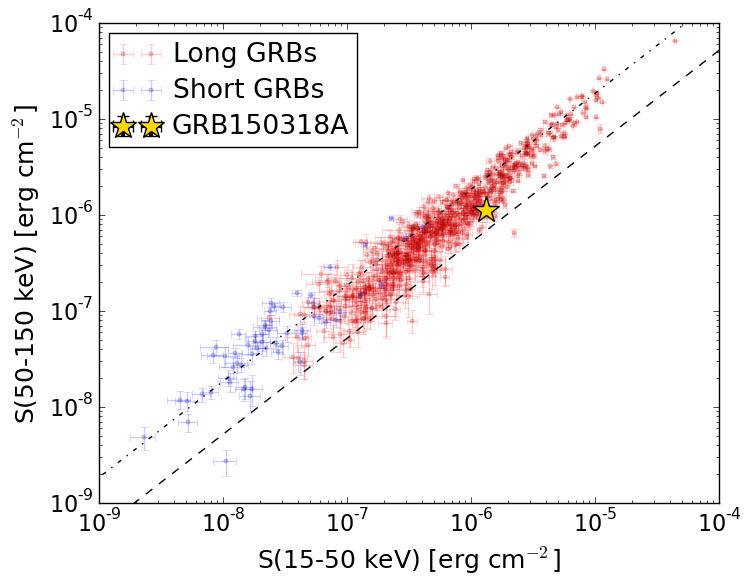
S(15-50 keV)  = 1.3236595e-06
S(50-150 keV) = 1.1309402e-06
The dash-dotted line and the dashed line traces the fluences calculated from the Band function with Epeak = 15 and 150 keV, respectively. Both lines assume a canonical values of alpha = -1 and beta = -2.5.
Mask shadow pattern
IMX = -5.635977089525922E-01, IMY = -3.473171845361346E-01
Spacecraft aspect plot
Bright source in the pre-burst/pre-slew/post-slew images
Pre-burst image of 15-350 keV band
Time interval of the image:
-361.323400 -345.494000
-239.624000 -4.516000

# RAcent  DECcent POSerr Theta    Phi  PeakCts   SNR AngSep     Name
#  [deg]    [deg]    ['] [deg]  [deg]                   [']
 89.3449 -41.5212    3.5  50.2   37.1   3.5575   3.3 ------	UNKNOWN
 52.8517 -55.2038    3.3  23.8   50.3   0.8726   3.6 ------	UNKNOWN
302.7552 -33.6303    2.5  56.7  179.1   5.9724   4.7 ------	UNKNOWN
 49.9936 -23.8887    2.2  34.2  -14.5   1.2248   5.1 ------	UNKNOWN
 26.8857 -33.0217    3.0  14.9  -43.4   0.8079   3.8 ------	UNKNOWN
Pre-slew background subtracted image of 15-350 keV band
Time interval of the image:
-4.516000 76.876600

# RAcent  DECcent POSerr Theta    Phi  PeakCts   SNR AngSep     Name
#  [deg]    [deg]    ['] [deg]  [deg]                   [']
 53.4129 -62.3261    2.1  25.9   66.5   0.8459   5.4 ------	UNKNOWN
324.9880 -61.4612    0.5  33.5  148.4   4.1718  23.7 ------	UNKNOWN
 64.7397  -9.6743    2.8  54.1  -12.0   1.3212   4.1 ------	UNKNOWN
348.3716 -25.2190    2.3  31.3 -133.4   0.6833   4.9 ------	UNKNOWN
330.2965 -11.7879    2.5  52.6 -140.1   2.2841   4.7 ------	UNKNOWN
Post-slew image of 15-350 keV band
Time interval of the image:
130.076590 962.483800

# RAcent  DECcent POSerr Theta    Phi  PeakCts   SNR AngSep     Name
#  [deg]    [deg]    ['] [deg]  [deg]                   [']
255.9843 -37.8428   56.3  47.6  140.4  -0.4969  -0.2    0.1	4U 1700-377
256.5747 -36.4194    8.4  48.5  142.0   3.3804   1.4    6.7	GX 349+2
264.8665 -44.3246    9.8  38.4  141.9   1.4224   1.2    9.2	4U 1735-44
270.3241 -24.9245   38.5  51.6  163.1   0.6765   0.3    9.5	GX 5-1
270.1979 -25.8508    9.6  50.9  162.4   2.5057   1.2    8.6	GRS 1758-258
275.9629 -30.4594    6.6  44.3  165.2   2.4525   1.7    5.9	H1820-303
284.8636 -24.8274    0.0  45.6  178.8   2.8108   2.6   10.9	HT1900.1-2455
263.0350 -33.8221  153.3  47.5  149.8  -0.1551  -0.1    2.4	GX 354-0
266.5057 -46.2752    3.0  36.2  141.1   4.0561   3.9 ------	UNKNOWN
282.4383 -23.9208    3.6  47.3  176.6   3.8309   3.2 ------	UNKNOWN
 14.8352 -48.7031    2.7  30.3  -37.9   2.6261   4.3 ------	UNKNOWN
301.6589 -12.3524    2.9  52.0 -155.6   6.4610   4.0 ------	UNKNOWN
  9.2449 -28.7310    3.2  43.8  -64.0  12.6770   3.7 ------	UNKNOWN
322.7828 -13.5236    2.6  48.0 -129.1  12.1028   4.5 ------	UNKNOWN