Analysis Summary
Notes:
- 1) No attempt has been made to eliminate the non-significant decimal places.
- 2) This batgrbproduct analysis is done using the HEASARC data.
- 3) This batgrbproduct analysis is using the flight position for the mask-weighting calculation.
======================================================================
BAT GRB EVENT DATA PROCESSING REPORT
Process Script Ver: batgrbproduct v2.46
Process Start Time: Tue May 5 17:26:23 EDT 2015
Host Name: bat1
Current Working Dir: /local/data/bat1/alien/Swift_3rdBATcatalog/event/batevent_reproc/trigger635887
======================================================================
Trigger: 00635887 Segment: 000
BAT Trigger Time: 448771768 [s; MET]
Trigger Stop: 448771832 [s; MET]
UTC: 2015-03-23T02:49:14.653860 [includes UTCF correction]
Where From?: TDRSS position message
BAT
RA: 128.191265245984 Dec: 45.4343019594773 [deg; J2000]
Catalogged Source?: NO
Point Source?: YES
GRB Indicated?: YES [ by BAT flight software ]
Image S/N Ratio: 10.18
Image Trigger?: YES
Rate S/N Ratio: 0 [ if not an image trigger ]
Image S/N Ratio: 10.18
Analysis Position: [ source = BAT ]
RA: 128.191265245984 Dec: 45.4343019594773 [deg; J2000]
Refined Position: [ source = BAT pre-slew burst; manually chosen time period ]
RA: 128.191 Dec: 45.4343 [deg; J2000]
{ 08h 32m 45.8s , +45d 26' 03.5" }
+/- 2.30735244623 [arcmin] (estimated 90% radius based on SNR)
SNR: 9.21384709763
Angular difference between the analysis and refined position is 0.011168 arcmin
Partial Coding Fraction: 0.328125 [ including projection effects ]
Duration
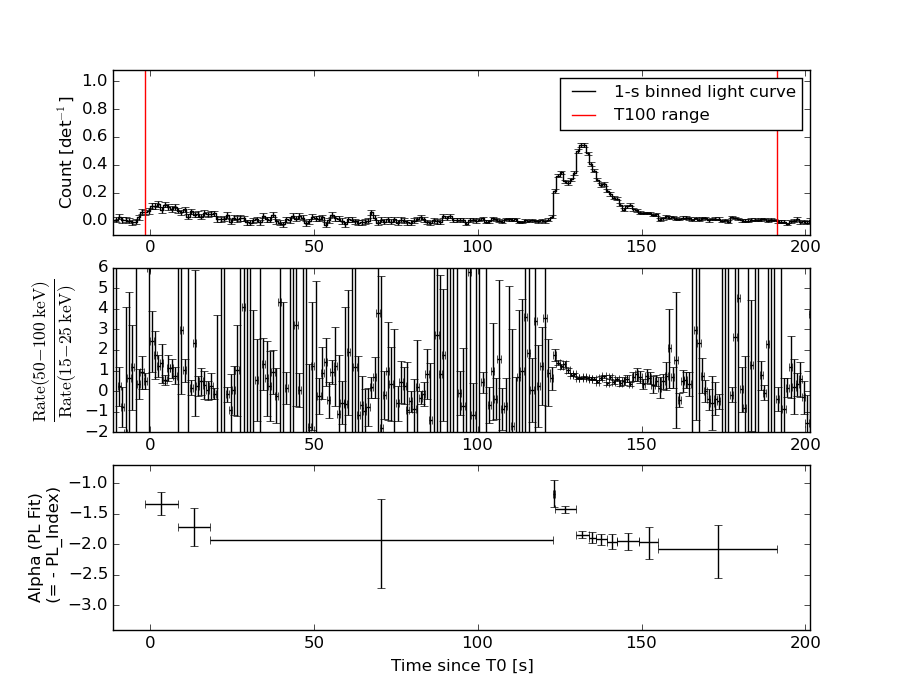
T90: 149.727999925613 +/- 9.12243565164621
Measured from: 3.39600002765656
to: 153.12399995327 [s; relative to TRIGTIME]
T50: 12.7399999499321 +/- 1.04199806984926
Measured from: 124.560000002384
to: 137.299999952316 [s; relative to TRIGTIME]
Fluence
Peak Flux (peak 1 second)
Measured from: 131.587999999523
to: 132.587999999523 [s; relative to TRIGTIME]
Total Fluence
Measured from: -1.54000002145767
to: 191.407999992371 [s; relative to TRIGTIME]
Band 1 Band 2 Band 3 Band 4
15-25 25-50 50-100 100-350 keV
Total 3.362431 3.671754 2.393276 0.525772
0.111853 0.116154 0.100387 0.083913 [error]
Peak 0.203833 0.214188 0.131249 0.025997
0.008326 0.008400 0.007195 0.004748 [error]
[ fluence units of on-axis counts / fully illuminated detector ]
======================================================================
====== Table of the duration information =============================
Value tstart tstop
T100 192.948 -1.540 191.408
T90 149.728 3.396 153.124
T50 12.740 124.560 137.300
Peak 1.000 131.588 132.588
====== Spectral Analysis Summary =====================================
Model : spectral model: simple power-law (PL) and cutoff power-law (CPL)
Ph_index : photon index: E^{Ph_index}
Ph_90err : 90% error of the photon index
Epeak : Epeak in keV
Epeak_90err: 90% error of Epeak
Norm : normalization at 50 keV in both the PL model and CPL model
Nomr_90err : 90% error of the normalization
chi2 : Chi-Squared
dof : degree of freedo
=== Time-averaged spectral analysis ===
(Best model with acceptable fit: PL)
Model Ph_index Ph_90err_low Ph_90err_hi Epeak Epeak_90err_low Epeak_90err_hi Norm Nomr_90err_low Norm_90err_hi chi2 dof
PL -1.738 -0.075 0.074 - - - 3.14e-03 -1.26e-04 1.26e-04 43.760 57
CPL -1.613 -0.187 0.294 154.878 -76.124 -154.878 3.63e-03 -5.92e-04 1.41e-03 43.180 56
=== 1-s peak spectral analysis ===
(Best model with acceptable fit: PL)
Model Ph_index Ph_90err_low Ph_90err_hi Epeak Epeak_90err_low Epeak_90err_hi Norm Nomr_90err_low Norm_90err_hi chi2 dof
PL -1.847 -0.091 0.089 - - - 3.28e-02 -1.71e-03 1.69e-03 60.580 57
CPL -1.669 -0.171 0.362 89.332 -41.302 -89.332 4.06e-02 -8.08e-03 2.14e-02 59.780 56
=== Fluence/Peak Flux Summary ===
Model Band1 Band2 Band3 Band4 Band5 Total
15-25 25-50 50-100 100-350 15-150 15-350 keV
Fluence PL 9.68e-07 1.54e-06 1.85e-06 4.32e-06 5.60e-06 8.67e-06 erg/cm2
90%_error_low -6.59e-08 -6.17e-08 -1.01e-07 -4.95e-07 -2.34e-07 -5.72e-07 erg/cm2
90%_error_hi 6.75e-08 6.15e-08 1.01e-07 5.38e-07 2.35e-07 6.05e-07 erg/cm2
Peak flux PL 1.89e+00 1.55e+00 8.61e-01 7.05e-01 4.61e+00 5.00e+00 ph/cm2/s
90%_error_low -1.49e-01 -7.49e-02 -5.93e-02 -9.41e-02 -2.25e-01 -2.34e-01 ph/cm2/s
90%_error_hi 1.53e-01 7.46e-02 5.91e-02 1.03e-01 2.25e-01 2.34e-01 ph/cm2/s
Fluence CPL 9.45e-07 1.55e-06 1.86e-06 3.56e-06 5.54e-06 7.91e-06 erg/cm2
90%_error_low -8.17e-08 -7.05e-08 -1.04e-07 -1.21e-06 -2.70e-07 -1.25e-06 erg/cm2
90%_error_hi 7.55e-08 7.14e-08 1.05e-07 1.29e-06 2.68e-07 9.84e-07 erg/cm2
Peak flux CPL 1.83e+00 1.57e+00 8.69e-01 5.66e-01 4.56e+00 4.84e+00 ph/cm2/s
90%_error_low -1.83e-01 -8.67e-02 -6.19e-02 -1.91e-01 -2.43e-01 -3.32e-01 ph/cm2/s
90%_error_hi 1.85e-01 8.80e-02 6.28e-02 1.70e-01 2.44e-01 3.23e-01 ph/cm2/s
======================================================================
Image
Pre-slew 15.0-50.0 keV image (Event data)
#RAcent DECcent POSerr Theta  Phi  Peak_Cts  SNR Name
128.191 45.434 0.000 42.141 -139.787 1.139 9.214 TRIG_00635887

Image time interval: 0.000 to 64.000 [sec]
Light Curves
Note: The mask-weighted lightcurves have units of either count/det or counts/sec/det, where a det is 0.4 x 0.4 = 0.16 sq cm.
Full-time range; 1 s binning
Other quick-look light curves:
- 64 ms binning (zoomed)
- 16 ms binning (zoomed)
- 8 ms binning (zoomed)
- 2 ms binning (zoomed)
- SN=5 or 10 s binning (full-time range)
- Raw light curve
Spectra
- 64 ms binning (zoomed)
- 16 ms binning (zoomed)
- 8 ms binning (zoomed)
- 2 ms binning (zoomed)
- SN=5 or 10 s binning (full-time range)
- Raw light curve
Spectra
Notes:
- 1) The fitting includes the systematic errors.
- 2) When the burst includes telescope slew time periods, the fitting uses an average response file made from multiple 5-s response files through out the slew time plus single time preiod for the non-slew times, and weighted by the total counts in the corresponding time period using addrmf. An average response file is needed becuase a spectral fit using the pre-slew DRM will introduce some errors in both a spectral shape and a normalization if the PHA file contains a lot of the slew/post-slew time interval.
- 3) For fits to more complicated models (e.g. a power-law over a cutoff power-law), the BAT team has decided to require a chi-square improvement of more than 6 for each extra dof.
Time averaged spectrum fit using the average DRM
Power-law model
Time interval is from   -1.540 sec. to  191.408 sec.

Spectral model in power-law:
------------------------------------------------------------
Parameters  : value       lower 90%   higher 90%
Photon index: -1.73771     ( -0.0747602   0.0740945 )
Norm@50keV  : 3.14244E-03    ( -0.000126327   0.000125852 )
------------------------------------------------------------
#Fit statistic : Chi-Squared =          43.76 using 59 PHA bins.
# Reduced chi-squared =         0.7677 for     57 degrees of freedom
# Null hypothesis probability =   9.011188e-01

Photon flux (15-150 keV)    in 192.9 sec: 0.423021 ( -0.017196  0.017267 ) ph/cm2/s
Energy fluence (15-150 keV)             : 5.59838e-06 ( -2.33598e-07  2.3462e-07 ) ergs/cm2
Cutoff power-law model
Time interval is from   -1.540 sec. to  191.408 sec.
Spectral model in the cutoff power-law:
------------------------------------------------------------
Parameters  : value       lower 90%   higher 90%
Photon index: -1.61299     ( -0.187448   0.293693 )
Epeak [keV] : 154.878      ( -76.1236 -154.878 )
Norm@50keV  : 3.62662E-03    ( -0.000591572   0.00141279 )
------------------------------------------------------------
#Fit statistic : Chi-Squared =          43.18 using 59 PHA bins.
# Reduced chi-squared =         0.7711 for     56 degrees of freedom
# Null hypothesis probability =   8.951354e-01

Photon flux (15-150 keV)    in 192.9 sec: 0.419271 ( -0.019014  0.01903 ) ph/cm2/s
Energy fluence (15-150 keV)             : 5.53723e-06 ( -2.69883e-07  2.68436e-07 ) ergs/cm2
1-s peak spectrum fit
Power-law model
Time interval is from  131.588 sec. to  132.588 sec.

Spectral model in power-law:
------------------------------------------------------------
Parameters  : value       lower 90%   higher 90%
Photon index: -1.84691     ( -0.0910035   0.089392 )
Norm@50keV  : 3.28403E-02    ( -0.00170681   0.00169346 )
------------------------------------------------------------
#Fit statistic : Chi-Squared =          60.58 using 59 PHA bins.
# Reduced chi-squared =          1.063 for     57 degrees of freedom
# Null hypothesis probability =   3.480333e-01

Photon flux (15-150 keV)    in 1 sec: 4.61052 ( -0.22501  0.22546 ) ph/cm2/s
Energy fluence (15-150 keV)             : 3.02023e-07 ( -1.57568e-08  1.58473e-08 ) ergs/cm2
Cutoff power-law model
Time interval is from  131.588 sec. to  132.588 sec.
Spectral model in the cutoff power-law:
------------------------------------------------------------
Parameters  : value       lower 90%   higher 90%
Photon index: -1.66855     ( -0.171407   0.362025 )
Epeak [keV] : 89.3320      ( -41.3016 -89.332 )
Norm@50keV  : 4.06176E-02    ( -0.00808046   0.0213672 )
------------------------------------------------------------
#Fit statistic : Chi-Squared =          59.78 using 59 PHA bins.
# Reduced chi-squared =          1.067 for     56 degrees of freedom
# Null hypothesis probability =   3.402656e-01

Photon flux (15-150 keV)    in 1 sec: 4.56022 ( -0.24331  0.24366 ) ph/cm2/s
Energy fluence (15-150 keV)             : 0 ( 0  0 ) ergs/cm2
Time-resolved spectra
Distribution
T90 vs. Hardness ratio plot
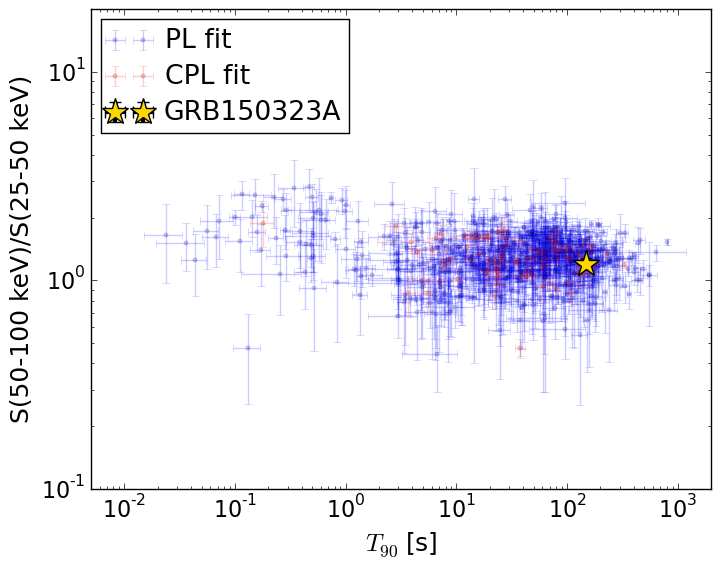
T90                                   = 149.728 sec.
Hardness ratio (energy fluence ratio) = 1.19941632535
S(15-50 keV) vs. S(50-150 keV) plot
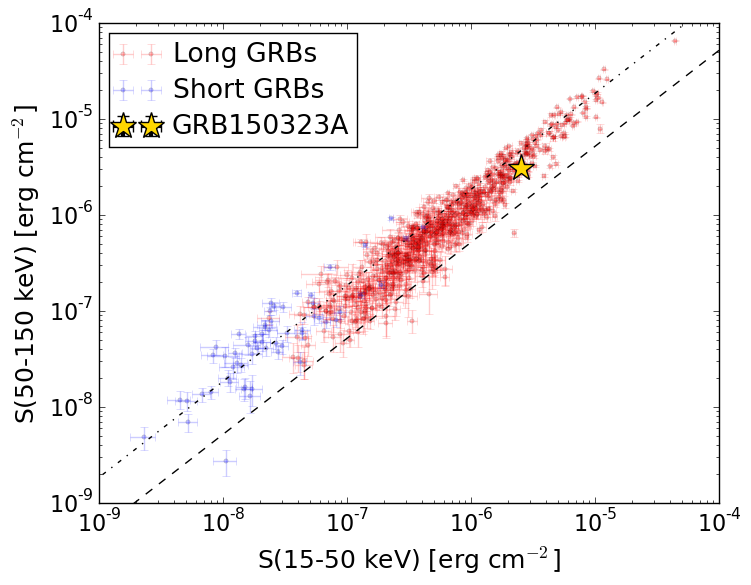
S(15-50 keV)  = 2.5067749e-06
S(50-150 keV) = 3.091587e-06
The dash-dotted line and the dashed line traces the fluences calculated from the Band function with Epeak = 15 and 150 keV, respectively. Both lines assume a canonical values of alpha = -1 and beta = -2.5.
Mask shadow pattern
IMX = -0.691010542175, IMY = 0.584218515664
Spacecraft aspect plot
Bright source in the pre-burst/pre-slew/post-slew images
Pre-burst image of 15-350 keV band
Time interval of the image:
-11.899380 -1.540000

# RAcent  DECcent POSerr Theta    Phi  PeakCts   SNR AngSep     Name
#  [deg]    [deg]    ['] [deg]  [deg]                   [']
254.4598  35.3550   11.8  58.9  -17.2   0.1935   1.0    0.8	Her X-1
Pre-slew background subtracted image of 15-350 keV band
Time interval of the image:
-1.500000 20.000000

# RAcent  DECcent POSerr Theta    Phi  PeakCts   SNR AngSep     Name
#  [deg]    [deg]    ['] [deg]  [deg]                   [']
254.4465  35.4052    6.9  58.8  -17.2  -0.8176  -1.6    3.8	Her X-1
236.3902  12.2140    1.9  54.1   16.5   2.4833   5.9 ------	UNKNOWN
236.7431  15.9141    2.5  52.5   12.3   1.4481   4.6 ------	UNKNOWN
171.8449  27.6691    2.9  10.0  155.8   0.3015   4.0 ------	UNKNOWN
128.2024  45.4220    1.2  42.1 -139.8   1.4180   9.8 ------	UNKNOWN
Post-slew image of 15-350 keV band
Time interval of the image:
135.300590 771.500600

# RAcent  DECcent POSerr Theta    Phi  PeakCts   SNR AngSep     Name
#  [deg]    [deg]    ['] [deg]  [deg]                   [']
 83.6278  22.0131    0.7  43.1 -135.6  13.3511  15.7    0.3	Crab
136.4833  11.9698    3.0  34.2  137.6   2.3027   3.9 ------	UNKNOWN
128.1722  45.4404    1.7   0.0 -126.7   2.5357   6.7 ------	UNKNOWN
 84.3931   3.5212    3.2  56.7 -152.2   8.3926   3.6 ------	UNKNOWN
 77.6456  16.2966    3.3  51.1 -135.7   8.2772   3.5 ------	UNKNOWN