Analysis Summary
Notes:
- 1) No attempt has been made to eliminate the non-significant decimal places.
- 2) This batgrbproduct analysis is done using the HEASARC data.
- 3) This batgrbproduct analysis is using the flight position for the mask-weighting calculation.
======================================================================
BAT GRB EVENT DATA PROCESSING REPORT
Process Script Ver: batgrbproduct v2.46
Process Start Time: Tue May 5 19:50:46 EDT 2015
Host Name: bat1
Current Working Dir: /local/data/bat1/alien/Swift_3rdBATcatalog/event/batevent_reproc/trigger636005
======================================================================
Trigger: 00636005 Segment: 000
BAT Trigger Time: 448823134.848 [s; MET]
Trigger Stop: 448823147.008 [s; MET]
UTC: 2015-03-23T17:05:21.499240 [includes UTCF correction]
Where From?: TDRSS position message
BAT
RA: 192.612689304227 Dec: 50.1982572072614 [deg; J2000]
Catalogged Source?: NO
Point Source?: YES
GRB Indicated?: YES [ by BAT flight software ]
Image S/N Ratio: 7.46
Image Trigger?: NO
Rate S/N Ratio: 10.7238052947636 [ if not an image trigger ]
Image S/N Ratio: 7.46
Analysis Position: [ source = BAT ]
RA: 192.612689304227 Dec: 50.1982572072614 [deg; J2000]
Refined Position: [ source = BAT pre-slew burst ]
RA: 192.624090644467 Dec: 50.1686282711958 [deg; J2000]
{ 12h 50m 29.8s , +50d 10' 07.1" }
+/- 2.43594594882257 [arcmin] (estimated 90% radius based on SNR)
+/- 1.38034333208073 [arcmin] (formal 1-sigma fit error)
SNR: 8.52581738827304
Angular difference between the analysis and refined position is 1.830908 arcmin
Partial Coding Fraction: 0.2695312 [ including projection effects ]
Duration
T90: 159.664000034332 +/- 44.6175204970225
Measured from: -21.0799999833107
to: 138.584000051022 [s; relative to TRIGTIME]
T50: 32.8000000715256 +/- 97.9207581678675
Measured from: -12.3280000090599
to: 20.4720000624657 [s; relative to TRIGTIME]
Fluence
Peak Flux (peak 1 second)
Measured from: 5.98000001907349
to: 6.98000001907349 [s; relative to TRIGTIME]
Total Fluence
Measured from: -23.2879999876022
to: 166.472000002861 [s; relative to TRIGTIME]
Band 1 Band 2 Band 3 Band 4
15-25 25-50 50-100 100-350 keV
Total 0.748279 0.935214 0.429171 0.148731
0.129377 0.135733 0.120905 0.114502 [error]
Peak 0.045049 0.043338 0.020361 0.011641
0.012136 0.013102 0.011311 0.009960 [error]
[ fluence units of on-axis counts / fully illuminated detector ]
======================================================================
====== Table of the duration information =============================
Value tstart tstop
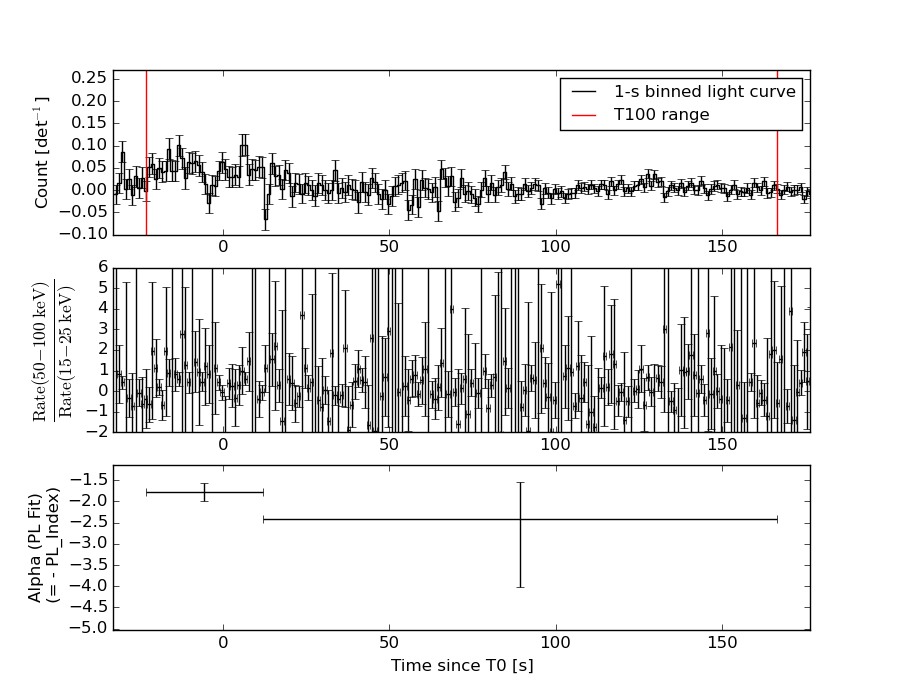
T100 189.760 -23.288 166.472
T90 159.664 -21.080 138.584
T50 32.800 -12.328 20.472
Peak 1.000 5.980 6.980
====== Spectral Analysis Summary =====================================
Model : spectral model: simple power-law (PL) and cutoff power-law (CPL)
Ph_index : photon index: E^{Ph_index}
Ph_90err : 90% error of the photon index
Epeak : Epeak in keV
Epeak_90err: 90% error of Epeak
Norm : normalization at 50 keV in both the PL model and CPL model
Nomr_90err : 90% error of the normalization
chi2 : Chi-Squared
dof : degree of freedo
=== Time-averaged spectral analysis ===
(Best model with acceptable fit: PL)
Model Ph_index Ph_90err_low Ph_90err_hi Epeak Epeak_90err_low Epeak_90err_hi Norm Nomr_90err_low Norm_90err_hi chi2 dof
PL -1.937 -0.316 0.290 - - - 7.61e-04 -1.60e-04 1.55e-04 68.140 57
CPL -0.039 -1.679 2.245 43.250 -14.850 22.825 9.20e-03 -9.20e-03 1.46e-01 64.430 56
=== 1-s peak spectral analysis ===
(Best model with acceptable fit: N/A)
Model Ph_index Ph_90err_low Ph_90err_hi Epeak Epeak_90err_low Epeak_90err_hi Norm Nomr_90err_low Norm_90err_hi chi2 dof
PL -1.983 -0.627 0.537 - - - 7.09e-03 -2.88e-03 2.75e-03 52.630 57
CPL 0.303 -2.439 4.846 40.706 N/A N/A 1.52e-01 N/A N/A 50.990 56
=== Fluence/Peak Flux Summary ===
Model Band1 Band2 Band3 Band4 Band5 Total
15-25 25-50 50-100 100-350 15-150 15-350 keV
Fluence PL 2.79e-07 3.93e-07 4.10e-07 7.88e-07 1.33e-06 1.87e-06 erg/cm2
90%_error_low -6.42e-08 -6.66e-08 -1.12e-07 -3.57e-07 -2.64e-07 -5.02e-07 erg/cm2
90%_error_hi 6.67e-08 6.65e-08 1.16e-07 5.08e-07 2.72e-07 6.18e-07 erg/cm2
Peak flux PL 4.65e-01 3.52e-01 1.78e-01 1.29e-01 1.05e+00 1.12e+00 ph/cm2/s
90%_error_low -2.08e-01 -1.15e-01 -8.77e-02 -1.29e-01 -3.43e-01 -3.67e-01 ph/cm2/s
90%_error_hi 2.14e-01 1.14e-01 9.21e-02 1.60e-01 3.44e-01 3.70e-01 ph/cm2/s
Fluence CPL 2.31e-07 4.81e-07 3.76e-07 7.73e-08 1.15e-06 1.17e-06 erg/cm2
90%_error_low -8.39e-08 -1.01e-07 -1.37e-07 -6.60e-08 -2.37e-07 -2.47e-07 erg/cm2
90%_error_hi 8.13e-08 1.02e-07 1.41e-07 4.63e-07 2.87e-07 5.07e-07 erg/cm2
Peak flux CPL 3.76e-01 4.49e-01 1.64e-01 1.20e-02 9.99e-01 1.00e+00 ph/cm2/s
90%_error_low -3.76e-01 -1.69e-01 -1.07e-01 -1.20e-02 -3.43e-01 -3.43e-01 ph/cm2/s
90%_error_hi 2.51e-01 1.72e-01 1.15e-01 1.59e-01 3.48e-01 3.55e-01 ph/cm2/s
======================================================================
Image
Pre-slew 15.0-350.0 keV image (Event data)
#   RAcent    DECcent   POSerr    Theta     Phi              Peak Cts       SNR   Name
  192.6241    50.1686   0.0225    45.4984    16.2459         2.3603968      8.526 TRIG_00636005

Foreground time interval of the image:
-23.288  58.853 (delta_t =  82.141 [sec])
Background time interval of the image:
-122.947 -23.288 (delta_t =  99.659 [sec])
Light Curves
Note: The mask-weighted lightcurves have units of either count/det or counts/sec/det, where a det is 0.4 x 0.4 = 0.16 sq cm.
Full-time range; 1 s binning
Other quick-look light curves:
- 64 ms binning (zoomed)
- 16 ms binning (zoomed)
- 8 ms binning (zoomed)
- 2 ms binning (zoomed)
- SN=5 or 10 s binning (full-time range)
- Raw light curve
Spectra
- 64 ms binning (zoomed)
- 16 ms binning (zoomed)
- 8 ms binning (zoomed)
- 2 ms binning (zoomed)
- SN=5 or 10 s binning (full-time range)
- Raw light curve
Spectra
Notes:
- 1) The fitting includes the systematic errors.
- 2) When the burst includes telescope slew time periods, the fitting uses an average response file made from multiple 5-s response files through out the slew time plus single time preiod for the non-slew times, and weighted by the total counts in the corresponding time period using addrmf. An average response file is needed becuase a spectral fit using the pre-slew DRM will introduce some errors in both a spectral shape and a normalization if the PHA file contains a lot of the slew/post-slew time interval.
- 3) For fits to more complicated models (e.g. a power-law over a cutoff power-law), the BAT team has decided to require a chi-square improvement of more than 6 for each extra dof.
Time averaged spectrum fit using the average DRM
Power-law model
Time interval is from  -23.288 sec. to  166.472 sec.

Spectral model in power-law:
------------------------------------------------------------
Parameters  : value       lower 90%   higher 90%
Photon index: -1.93695     ( -0.316095   0.290407 )
Norm@50keV  : 7.61238E-04    ( -0.000159675   0.000154843 )
------------------------------------------------------------
#Fit statistic : Chi-Squared =          68.14 using 59 PHA bins.
# Reduced chi-squared =          1.195 for     57 degrees of freedom
# Null hypothesis probability =   1.483934e-01

Photon flux (15-150 keV)    in 189.8 sec: 0.111007 ( -0.0187785  0.018784 ) ph/cm2/s
Energy fluence (15-150 keV)             : 1.3294e-06 ( -2.64262e-07  2.71875e-07 ) ergs/cm2
Cutoff power-law model
Time interval is from  -23.288 sec. to  166.472 sec.
Spectral model in the cutoff power-law:
------------------------------------------------------------
Parameters  : value       lower 90%   higher 90%
Photon index: -0.038937     ( -1.68821   2.23569 )
Epeak [keV] : 43.2496      ( -14.8586 22.8168 )
Norm@50keV  : 9.20319E-03    ( -0.00936388   0.14608 )
------------------------------------------------------------
#Fit statistic : Chi-Squared =          64.43 using 59 PHA bins.
# Reduced chi-squared =          1.150 for     56 degrees of freedom
# Null hypothesis probability =   2.056411e-01

Photon flux (15-150 keV)    in 189.8 sec: 0.104353 ( -0.0195323  0.019637 ) ph/cm2/s
Energy fluence (15-150 keV)             : 1.15416e-06 ( -2.374e-07  2.87112e-07 ) ergs/cm2
1-s peak spectrum fit
Power-law model
Time interval is from    5.980 sec. to    6.980 sec.

Spectral model in power-law:
------------------------------------------------------------
Parameters  : value       lower 90%   higher 90%
Photon index: -1.98287     ( -0.627277   0.536628 )
Norm@50keV  : 7.08582E-03    ( -0.00288411   0.00275176 )
------------------------------------------------------------
#Fit statistic : Chi-Squared =          52.63 using 59 PHA bins.
# Reduced chi-squared =         0.9233 for     57 degrees of freedom
# Null hypothesis probability =   6.396153e-01

Photon flux (15-150 keV)    in 1 sec: 1.05465 ( -0.343426  0.34378 ) ph/cm2/s
Energy fluence (15-150 keV)             : 6.5307e-08 ( -2.42223e-08  2.55022e-08 ) ergs/cm2
Cutoff power-law model
Time interval is from    5.980 sec. to    6.980 sec.
Spectral model in the cutoff power-law:
------------------------------------------------------------
Parameters  : value       lower 90%   higher 90%
Photon index: 0.30303     ( -2.47284   4.81221 )
Epeak [keV] : 40.7057      (   )
Norm@50keV  : 0.151808    (     )
------------------------------------------------------------
#Fit statistic : Chi-Squared =          50.99 using 59 PHA bins.
# Reduced chi-squared =         0.9105 for     56 degrees of freedom
# Null hypothesis probability =   6.646413e-01

Photon flux (15-150 keV)    in 1 sec: 0.999231 ( -0.343088  0.348059 ) ph/cm2/s
Energy fluence (15-150 keV)             : 5.62005e-08 ( -2.01194e-08  2.63653e-08 ) ergs/cm2
Time-resolved spectra
Distribution
T90 vs. Hardness ratio plot
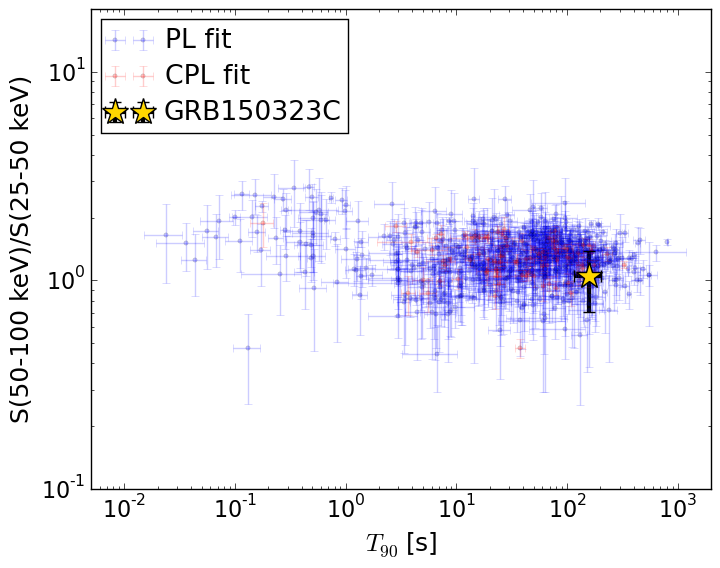
T90                                   = 159.664 sec.
Hardness ratio (energy fluence ratio) = 1.04474428869
S(15-50 keV) vs. S(50-150 keV) plot
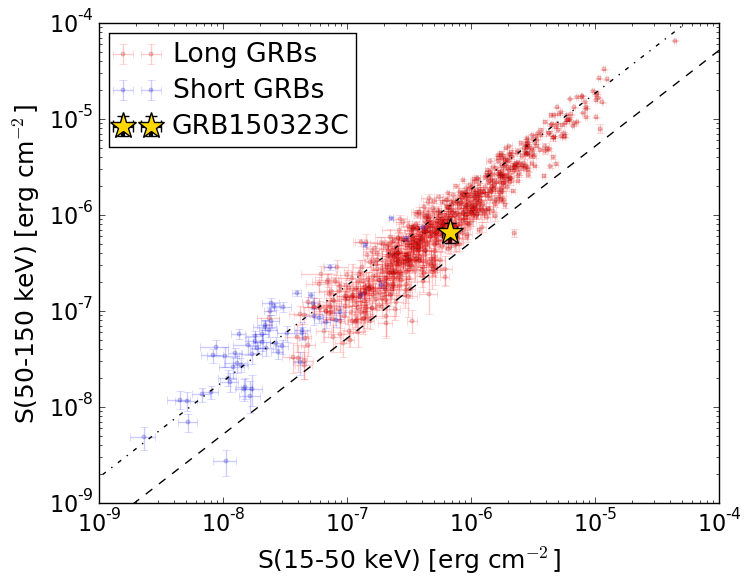
S(15-50 keV)  = 6.710219e-07
S(50-150 keV) = 6.583946e-07
The dash-dotted line and the dashed line traces the fluences calculated from the Band function with Epeak = 15 and 150 keV, respectively. Both lines assume a canonical values of alpha = -1 and beta = -2.5.
Mask shadow pattern
IMX = 9.769203130013407E-01, IMY = -2.846699612720374E-01
Spacecraft aspect plot
Bright source in the pre-burst/pre-slew/post-slew images
Pre-burst image of 15-350 keV band
Time interval of the image:
-122.947400 -23.288000

# RAcent  DECcent POSerr Theta    Phi  PeakCts   SNR AngSep     Name
#  [deg]    [deg]    ['] [deg]  [deg]                   [']
213.6915  33.7835    3.3  46.6   47.7   1.8281   3.5 ------	UNKNOWN
157.9344  10.7285    2.2  13.4  -81.3   0.5681   5.2 ------	UNKNOWN
Pre-slew background subtracted image of 15-350 keV band
Time interval of the image:
-23.288000 58.852600

# RAcent  DECcent POSerr Theta    Phi  PeakCts   SNR AngSep     Name
#  [deg]    [deg]    ['] [deg]  [deg]                   [']
192.6241  50.1686    1.4  45.5   16.2   2.3605   8.5 ------	UNKNOWN
Post-slew image of 15-350 keV band
Time interval of the image:
157.652600 962.190800
1913.152000 2000.000000

# RAcent  DECcent POSerr Theta    Phi  PeakCts   SNR AngSep     Name
#  [deg]    [deg]    ['] [deg]  [deg]                   [']
254.2955  35.4016   45.8  46.2  -18.5   0.1929   0.3    8.7	Her X-1
240.0152  40.2195    2.8  34.2  -14.4   1.9554   4.2 ------	UNKNOWN
232.4179  51.5339    2.0  24.8  -31.3   2.0281   5.8 ------	UNKNOWN
242.7814  44.9460    2.5  33.6  -23.5   2.0807   4.6 ------	UNKNOWN
282.6619  80.7078    3.5  40.7  -88.3   7.3266   3.2 ------	UNKNOWN