Analysis Summary
Notes:
- 1) No attempt has been made to eliminate the non-significant decimal places.
- 2) This batgrbproduct analysis is done using the HEASARC data.
- 3) This batgrbproduct analysis is using the flight position for the mask-weighting calculation.
==========================================================================
BAT GROUND-DETECTED GRB DATA PROCESSING REPORT
(This burst occurred during telescope slew)
Process Script Ver: batgrbproduct v2.46
Process Start Time: Fri Apr 3 13:20:05 EDT 2015
Host Name: bat1
Current Working Dir: /local/data/bat1/alien/Swift_3rdBATcatalog/event/batevent_reproc/trigger636865
======================================================================
Trigger: 00636865 Segment: 000
BAT Trigger Time: 449627880.0
UTC: 2015-04-02T00:37:46.694 [includes UTCF correction]
Where From?: Ground analysis (best_duration.txt)
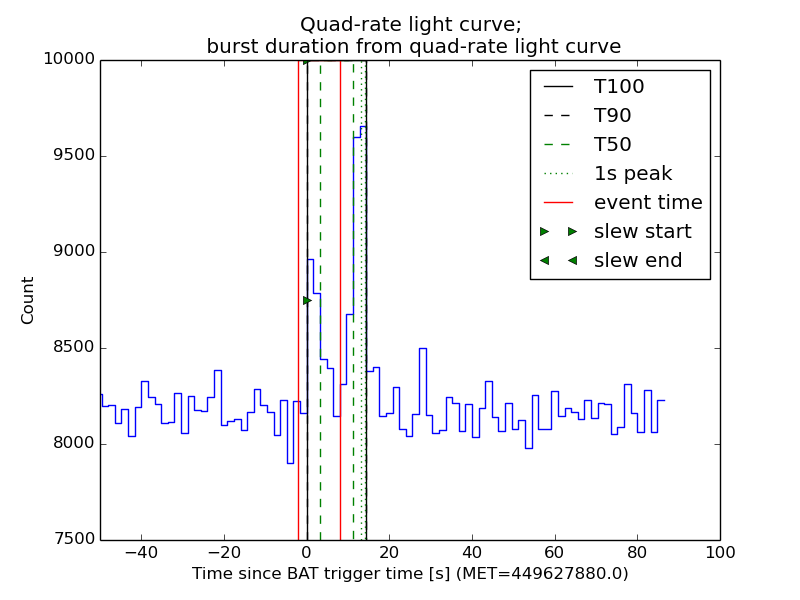
NOTE: BAT trigger time for ground-detected burst during slew is the T100 start time.
Analysis Position: [ source = GCN ]
RA: 173.604 Dec: 40.988 [deg; J2000]
Refined Position: [ source = BAT mosaic image ]
RA: 173.625622355006 Dec: 40.9819564484979 [deg; J2000]
{ 11h 34m 30.1s , +40d 58' 55.0" }
+/- 2.58845709262 [arcmin] (estimated 90% radius based on SNR)
SNR: 7.81837808864
Angular difference between the analysis and refined position is 1.044315 arcmin
Partial Coding Fraction: Unavailable because the burst occurred during slew.
Duration
T90: 14.4000000357628 +/- 1.6
Measured from: 0
to: 14.4 [s; relative to TRIGTIME]
T50: 8.00000005960464 +/- 1.6
Measured from: 3.2
to: 11.2 [s; relative to TRIGTIME]
====== Table of the duration information =============================
Value tstart tstop
T100 14.400 0.000 14.400
T90 14.400 0.000 14.400
T50 8.000 3.200 11.200
Peak 1.000 13.100 14.100
====== Spectral Analysis Summary =====================================
Model : spectral model: simple power-law (PL) and cutoff power-law (CPL)
Ph_index : photon index: E^{Ph_index}
Ph_90err : 90% error of the photon index
Epeak : Epeak in keV
Epeak_90err: 90% error of Epeak
Norm : normalization at 50 keV in both the PL model and CPL model
Nomr_90err : 90% error of the normalization
chi2 : Chi-Squared
dof : degree of freedo
=== Time-averaged spectral analysis ===
(Best model with acceptable fit: PL)
Model Ph_index Ph_90err_low Ph_90err_hi Epeak Epeak_90err_low Epeak_90err_hi Norm Nomr_90err_low Norm_90err_hi chi2 dof
PL -2.277 -0.521 0.442 - - - 1.88e-03 -6.66e-04 6.42e-04 53.040 57
CPL -1.889 N/A N/A 10.208 N/A N/A 3.34e-03 N/A N/A 53.090 56
=== 1-s peak spectral analysis ===
(Best model with acceptable fit: N/A)
Model Ph_index Ph_90err_low Ph_90err_hi Epeak Epeak_90err_low Epeak_90err_hi Norm Nomr_90err_low Norm_90err_hi chi2 dof
PL N/A N/A N/A - - - N/A N/A N/A N/A N/A
CPL N/A N/A N/A N/A N/A N/A N/A N/A N/A N/A N/A
=== Fluence/Peak Flux Summary ===
Model Band1 Band2 Band3 Band4 Band5 Total
15-25 25-50 50-100 100-350 15-150 15-350 keV
Fluence PL 4.05e-08 4.65e-08 3.84e-08 5.32e-08 1.45e-07 1.78e-07 erg/cm2
90%_error_low -1.16e-08 -1.18e-08 -1.71e-08 -3.46e-08 -4.08e-08 -6.22e-08 erg/cm2
90%_error_hi 1.18e-08 1.14e-08 1.91e-08 6.39e-08 4.34e-08 8.41e-08 erg/cm2
Peak flux PL N/A N/A N/A N/A N/A N/A ph/cm2/s
Image
Note1: The mosaic image is made with timebin = 0.05 s; energybin = 15-100 keV
Note2: The mosaic image uses Galactic coordinate.
#RAcent DECcent POSerr Theta  Phi  Peak_Cts  SNR Name
173.626 40.982 0.009 20.049 -76.806 0.063 7.818 UNKNOWN

Image time interval: 0.000 to 3.000 [sec]
Light Curves
Note: The mask-weighted lightcurves have units of either count/det or counts/sec/det, where a det is 0.4 x 0.4 = 0.16 sq cm.
Best duration plot
Full-time range; 1 s binning
Other quick-look light curves:
- 64 ms binning (zoomed)
- 16 ms binning (zoomed)
- 8 ms binning (zoomed)
- 2 ms binning (zoomed)
- SN=5 or 10 s binning (full-time range)
- Raw light curve
Spectra
- 64 ms binning (zoomed)
- 16 ms binning (zoomed)
- 8 ms binning (zoomed)
- 2 ms binning (zoomed)
- SN=5 or 10 s binning (full-time range)
- Raw light curve
Spectra
Notes:
- 1) The fitting includes the systematic errors.
- 2) When the burst includes telescope slew time periods, the fitting uses an average response file made from multiple 5-s response files through out the slew time plus single time preiod for the non-slew times, and weighted by the total counts in the corresponding time period using addrmf. An average response file is needed becuase a spectral fit using the pre-slew DRM will introduce some errors in both a spectral shape and a normalization if the PHA file contains a lot of the slew/post-slew time interval.
- 3) For fits to more complicated models (e.g. a power-law over a cutoff power-law), the BAT team has decided to require a chi-square improvement of more than 6 for each extra dof.
Time averaged spectrum fit using the average DRM
Power-law model

Time interval is from    0.000 sec. to    8.070 sec.

Spectral model in power-law:
------------------------------------------------------------
Parameters  : value       lower 90%   higher 90%
Photon index: -2.27697     ( -0.520578   0.441912 )
Norm@50keV  : 1.88229E-03    ( -0.000666231   0.000642283 )
------------------------------------------------------------
#Fit statistic : Chi-Squared =          53.04 using 59 PHA bins.
# Reduced chi-squared =         0.9306 for     57 degrees of freedom
# Null hypothesis probability =   6.242896e-01

Photon flux (15-150 keV)    in 8.07 sec: 0.324820 ( -0.073897  0.073903 ) ph/cm2/s
Energy fluence (15-150 keV)             : 1.44592e-07 ( -4.08262e-08  4.33674e-08 ) ergs/cm2
Cutoff power-law model
Time interval is from    0.000 sec. to    8.070 sec.
Spectral model in the cutoff power-law:
------------------------------------------------------------
Parameters  : value       lower 90%   higher 90%
Photon index: -1.88872     (       )
Epeak [keV] : 10.2078      (   )
Norm@50keV  : 3.34049E-03    (     )
------------------------------------------------------------
#Fit statistic : Chi-Squared =          53.09 using 59 PHA bins.
# Reduced chi-squared =         0.9480 for     56 degrees of freedom
# Null hypothesis probability =   5.857182e-01

Photon flux (15-150 keV)    in 8.07 sec: 0.324828 ( -0.073852  0.073856 ) ph/cm2/s
Energy fluence (15-150 keV)             : 1.38913e-07 ( -4.84869e-08  4.96662e-08 ) ergs/cm2
1-s peak spectrum fit
1-s peak spectrum unavailable, likely because there are no event data in the 1-s peak range.
Time-resolved spectra

Distribution
T90 vs. Hardness ratio plot
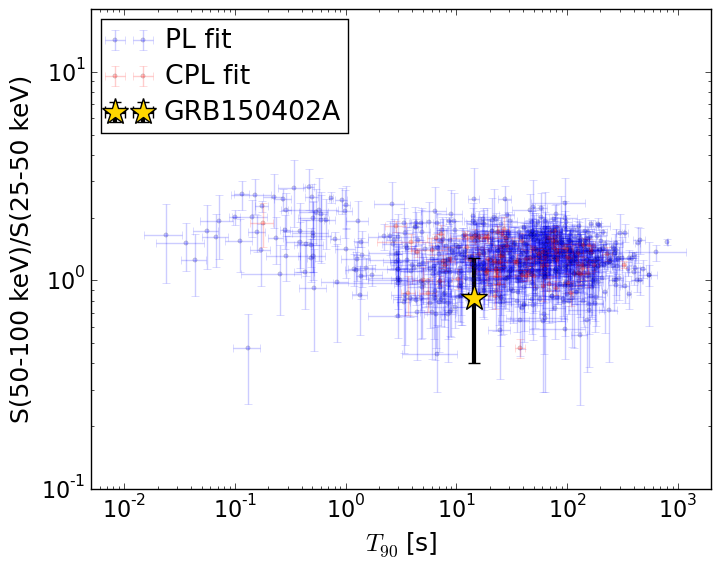
T90                                   = 14.4 sec.
Hardness ratio (energy fluence ratio) = 0.825372539185
S(15-50 keV) vs. S(50-150 keV) plot
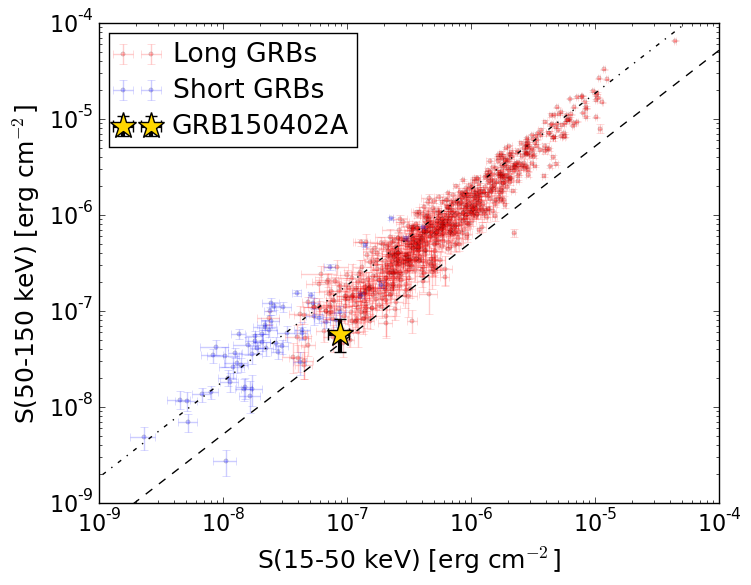
S(15-50 keV)  = 8.695463e-08
S(50-150 keV) = 5.763666e-08
The dash-dotted line and the dashed line traces the fluences calculated from the Band function with Epeak = 15 and 150 keV, respectively. Both lines assume a canonical values of alpha = -1 and beta = -2.5.
Mask shadow pattern
Mask shadow pattern unavailable because this burst occurs during telescope slews.Spacecraft aspect plot