Analysis Summary
Notes:
- 1) No attempt has been made to eliminate the non-significant decimal places.
- 2) This batgrbproduct analysis is done using the HEASARC data.
- 3) This batgrbproduct analysis is using the flight position for the mask-weighting calculation.
======================================================================
                  BAT GRB EVENT DATA PROCESSING REPORT
    Process Script Ver: batgrbproduct v2.46
    Process Start Time: Sun May 17 01:28:49 EDT 2015
             Host Name: bat1
   Current Working Dir: /local/data/bat1/alien/Swift_3rdBATcatalog/event/batevent_reproc/trigger638808
======================================================================

  Trigger: 00638808      Segment: 000

  BAT Trigger Time: 451463298.176   [s; MET]
      Trigger Stop: 451463298.432   [s; MET]
               UTC: 2015-04-23T06:28:04.692100    [includes UTCF correction]
       Where From?: TDRSS position message

  BAT
    RA: 221.600452494162   Dec: 12.2883046095778  [deg; J2000]

     Catalogged Source?: NO
     Point Source?:      YES
     GRB Indicated?:     YES    [ by BAT flight software ]
     Image S/N Ratio:    10.41
     Image Trigger?:     NO
     Rate S/N Ratio:     41.2431812546026  [ if not an image trigger ]
     Image S/N Ratio:    10.41

  Analysis Position:   [ source = BAT ]
    RA: 221.600452494162   Dec: 12.2883046095778  [deg; J2000]

  Refined Position:   [ source = BAT pre-slew burst ]
    RA: 221.602601237827   Dec: 12.2659338160383  [deg; J2000]
        { 14h 46m 24.6s , +12d 15' 57.4" }
         +/- 1.85998191532332 [arcmin] (estimated 90% radius based on SNR)
         +/- 0.839234691015015 [arcmin] (formal 1-sigma fit error)
    SNR: 12.5344684228975

  Angular difference between the analysis and refined position is 1.348146 arcmin

  Partial Coding Fraction: 0.9296875    [ including projection effects ]

  Duration
     T90: 0.215999901294708 +/- 0.0282842442734789
        Measured from: 0.0120000243186951
                   to: 0.227999925613403     [s; relative to TRIGTIME]
     T50: 0.119999945163727 +/- 0.030463099373373
        Measured from: 0.0720000267028809
                   to: 0.191999971866608     [s; relative to TRIGTIME]


  Fluence
     Peak Flux  (peak 1 second)
        Measured from: -0.374000012874603
                   to: 0.625999987125397     [s; relative to TRIGTIME]
     Total Fluence
        Measured from: 0.00800001621246338
                   to: 0.240000009536743     [s; relative to TRIGTIME]

             Band 1     Band 2     Band 3     Band 4
              15-25      25-50     50-100    100-350     keV
 Total     0.010714   0.028953   0.039330   0.015862
           0.003343   0.004139   0.004354   0.003601 [error]
 Peak      0.015535   0.036092   0.048956   0.010570
           0.006051   0.006598   0.005996   0.005220 [error]

     [ fluence units of on-axis counts / fully illuminated detector ]

======================================================================


====== Table of the duration information =============================

        Value   tstart    tstop
T100    0.232    0.008    0.240
T90     0.216    0.012    0.228
T50     0.120    0.072    0.192
Peak    1.000   -0.374    0.626


====== Spectral Analysis Summary =====================================

Model      : spectral model: simple power-law (PL) and cutoff power-law (CPL)
Ph_index   : photon index: E^{Ph_index}
Ph_90err   : 90% error of the photon index
Epeak      : Epeak in keV
Epeak_90err: 90% error of Epeak
Norm       : normalization at 50 keV in both the PL model and CPL model
Nomr_90err : 90% error of the normalization
chi2       : Chi-Squared
dof        : degree of freedo

=== Time-averaged spectral analysis ===
(Best model with acceptable fit: N/A)

Model Ph_index Ph_90err_low Ph_90err_hi  Epeak  Epeak_90err_low  Epeak_90err_hi  Norm       Nomr_90err_low    Norm_90err_hi    chi2    dof
PL      -0.771    -0.230      0.238       -           -               -         2.39e-02     -3.46e-03          3.44e-03      78.220   57
CPL      0.443    -1.050      1.404      120.501     -35.205       319.508      7.84e-02     -4.96e-02          1.96e-01      74.200   56


=== 1-s peak spectral analysis ===
(Best model with acceptable fit: PL)

Model Ph_index Ph_90err_low Ph_90err_hi  Epeak  Epeak_90err_low  Epeak_90err_hi  Norm       Nomr_90err_low    Norm_90err_hi    chi2    dof
PL      -0.858     -0.278     0.295       -           -               -         7.50e-03     -1.25e-03          1.24e-03      58.660   57
CPL      0.011     -0.990     1.796      134.953      N/A           N/A         1.78e-02        N/A               N/A         57.330   56


=== Fluence/Peak Flux Summary ===

              Model    Band1     Band2     Band3     Band4     Band5     Total
                       15-25     25-50    50-100    100-350    15-150    15-350    keV
Fluence         PL   3.60e-09  1.04e-08  2.43e-08  1.55e-07  6.57e-08  1.94e-07   erg/cm2
      90%_error_low -9.60e-10 -1.80e-09 -3.77e-09 -4.73e-08 -1.03e-08 -5.00e-08   erg/cm2
      90%_error_hi   1.05e-09  1.77e-09  3.73e-09  6.00e-08  1.04e-08  6.14e-08   erg/cm2
Peak flux       PL   1.67e-01  2.48e-01  2.73e-01  5.68e-01  8.61e-01  1.26e+00   ph/cm2/s
      90%_error_low -5.47e-02 -5.32e-02 -4.63e-02 -1.85e-01 -1.42e-01 -2.24e-01   ph/cm2/s
      90%_error_hi   6.22e-02  5.22e-02  4.59e-02  2.41e-01  1.42e-01  2.43e-01   ph/cm2/s

Fluence        CPL   2.58e-09  1.10e-08  2.78e-08  4.62e-08  6.31e-08  8.76e-08   erg/cm2
      90%_error_low -1.18e-09 -2.13e-09 -4.86e-09 -2.68e-08 -1.10e-08 -2.82e-08   erg/cm2
      90%_error_hi   1.33e-09  2.13e-09  5.07e-09  8.17e-08  1.10e-08  7.99e-08   erg/cm2
Peak flux      CPL   1.31e-01  2.55e-01  2.99e-01  2.66e-01  8.29e-01  9.52e-01   ph/cm2/s
      90%_error_low -6.96e-02 -5.89e-02 -5.97e-02 -1.68e-01 -1.52e-01 -2.39e-01   ph/cm2/s
      90%_error_hi   8.01e-02  5.98e-02  6.20e-02  3.75e-01  1.50e-01  2.97e-01   ph/cm2/s

======================================================================
Image
Pre-slew 15.0-350.0 keV image (Event data)
#   RAcent    DECcent   POSerr    Theta     Phi              Peak Cts       SNR   Name
  221.6026    12.2659   0.0153    12.3481    57.6330         0.0982011     12.534 TRIG_00638808

Foreground time interval of the image:
  0.008   0.240 (delta_t =   0.232 [sec])
Background time interval of the image:
-719.875 -701.655 (delta_t =  18.221 [sec])
-239.176   0.008 (delta_t = 239.184 [sec])
Light Curves
Note: The mask-weighted lightcurves have units of either count/det or counts/sec/det, where a det is 0.4 x 0.4 = 0.16 sq cm.
Full-time range; 1 s binning
Other quick-look light curves:
- 64 ms binning (zoomed)
- 16 ms binning (zoomed)
- 8 ms binning (zoomed)
- 2 ms binning (zoomed)
- SN=5 or 10 s binning (full-time range)
- Raw light curve
Spectra
- 64 ms binning (zoomed)
- 16 ms binning (zoomed)
- 8 ms binning (zoomed)
- 2 ms binning (zoomed)
- SN=5 or 10 s binning (full-time range)
- Raw light curve
Spectra
Notes:
- 1) The fitting includes the systematic errors.
- 2) When the burst includes telescope slew time periods, the fitting uses an average response file made from multiple 5-s response files through out the slew time plus single time preiod for the non-slew times, and weighted by the total counts in the corresponding time period using addrmf. An average response file is needed becuase a spectral fit using the pre-slew DRM will introduce some errors in both a spectral shape and a normalization if the PHA file contains a lot of the slew/post-slew time interval.
- 3) For fits to more complicated models (e.g. a power-law over a cutoff power-law), the BAT team has decided to require a chi-square improvement of more than 6 for each extra dof.
Time averaged spectrum fit using the average DRM
Power-law model
Time interval is from    0.008 sec. to    0.240 sec.

Spectral model in power-law:
------------------------------------------------------------
Parameters  : value       lower 90%   higher 90%
Photon index: -0.771052     ( -0.229765   0.23805 )
Norm@50keV  : 2.39279E-02    ( -0.00345842   0.00343979 )
------------------------------------------------------------
#Fit statistic : Chi-Squared =          78.22 using 59 PHA bins.
# Reduced chi-squared =          1.372 for     57 degrees of freedom
# Null hypothesis probability =   3.254926e-02

Photon flux (15-150 keV)    in 0.232 sec: 2.75337 ( -0.39138  0.39166 ) ph/cm2/s
Energy fluence (15-150 keV)             : 6.56808e-08 ( -1.02862e-08  1.03707e-08 ) ergs/cm2
Cutoff power-law model
Time interval is from    0.008 sec. to    0.240 sec.
Spectral model in the cutoff power-law:
------------------------------------------------------------
Parameters  : value       lower 90%   higher 90%
Photon index: 0.443048     ( -1.04979   1.40415 )
Epeak [keV] : 120.501      ( -35.22 319.493 )
Norm@50keV  : 7.83706E-02    ( -0.0495546   0.195899 )
------------------------------------------------------------
#Fit statistic : Chi-Squared =          74.20 using 59 PHA bins.
# Reduced chi-squared =          1.325 for     56 degrees of freedom
# Null hypothesis probability =   5.217618e-02

Photon flux (15-150 keV)    in 0.232 sec: 2.66396 ( -0.40308  0.40141 ) ph/cm2/s
Energy fluence (15-150 keV)             : 6.30534e-08 ( -1.0975e-08  1.0951e-08 ) ergs/cm2
1-s peak spectrum fit
Power-law model
Time interval is from   -0.374 sec. to    0.626 sec.

Spectral model in power-law:
------------------------------------------------------------
Parameters  : value       lower 90%   higher 90%
Photon index: -0.857667     ( -0.277593   0.295485 )
Norm@50keV  : 7.50190E-03    ( -0.00125115   0.00123674 )
------------------------------------------------------------
#Fit statistic : Chi-Squared =          58.66 using 59 PHA bins.
# Reduced chi-squared =          1.029 for     57 degrees of freedom
# Null hypothesis probability =   4.145131e-01

Photon flux (15-150 keV)    in 1 sec: 0.861072 ( -0.141597  0.142188 ) ph/cm2/s
Energy fluence (15-150 keV)             : 8.56209e-08 ( -1.47937e-08  1.49309e-08 ) ergs/cm2
Cutoff power-law model
Time interval is from   -0.374 sec. to    0.626 sec.
Spectral model in the cutoff power-law:
------------------------------------------------------------
Parameters  : value       lower 90%   higher 90%
Photon index: 0.0108688     ( -0.989659   1.79621 )
Epeak [keV] : 134.953      (   )
Norm@50keV  : 1.78272E-02    (     )
------------------------------------------------------------
#Fit statistic : Chi-Squared =          57.33 using 59 PHA bins.
# Reduced chi-squared =          1.024 for     56 degrees of freedom
# Null hypothesis probability =   4.256099e-01

Photon flux (15-150 keV)    in 1 sec: 0.828978 ( -0.152159  0.150418 ) ph/cm2/s
Energy fluence (15-150 keV)             : 8.16676e-08 ( -1.66247e-08  1.62588e-08 ) ergs/cm2
Time-resolved spectra
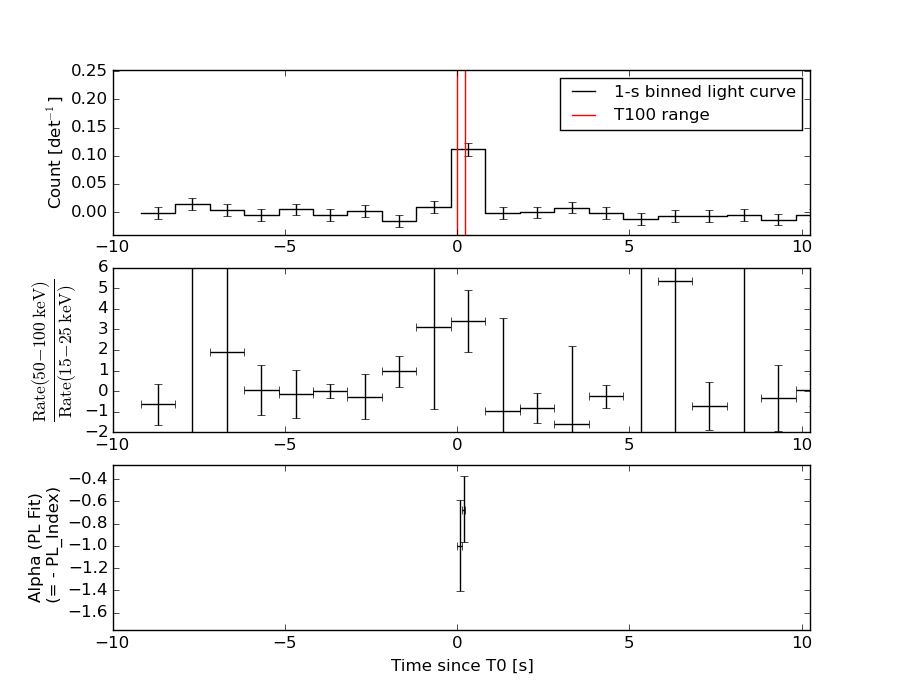
Distribution
T90 vs. Hardness ratio plot
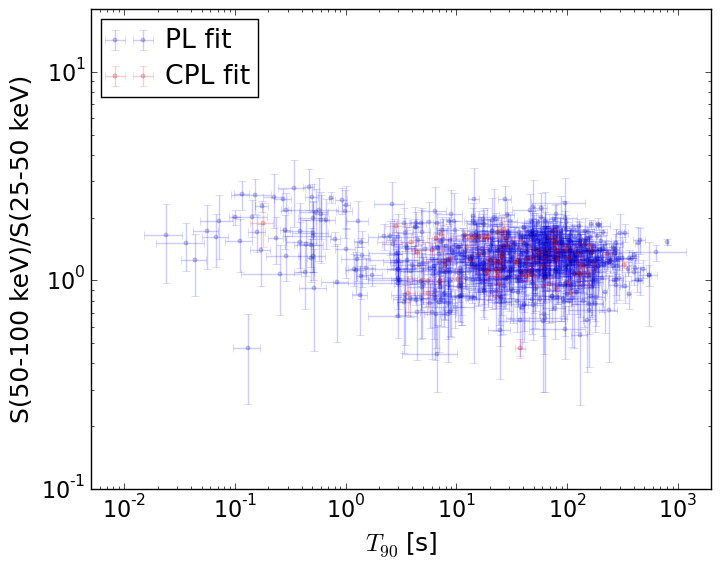
T90                                   = N/A sec.
Hardness ratio (energy fluence ratio) = N/A
S(15-50 keV) vs. S(50-150 keV) plot
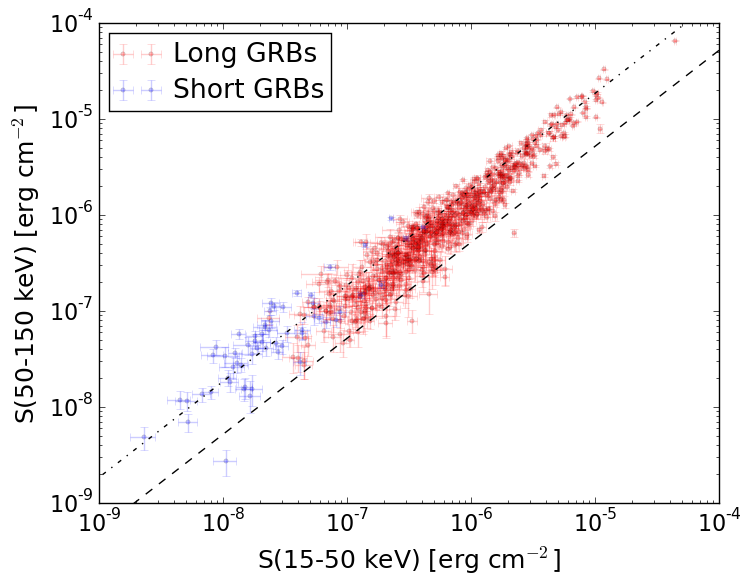
S(15-50 keV)  = N/A
S(50-150 keV) = N/A
The dash-dotted line and the dashed line traces the fluences calculated from the Band function with Epeak = 15 and 150 keV, respectively. Both lines assume a canonical values of alpha = -1 and beta = -2.5.
Mask shadow pattern
IMX = 1.171942592691804E-01, IMY = -1.849037376510331E-01
Spacecraft aspect plot
Bright source in the pre-burst/pre-slew/post-slew images
Pre-burst image of 15-350 keV band
Time interval of the image:
-719.875400 -701.654600
-239.176000 0.008000

# RAcent  DECcent POSerr Theta    Phi  PeakCts   SNR AngSep     Name
#  [deg]    [deg]    ['] [deg]  [deg]                   [']
244.9889 -15.6436    0.7  48.1   42.4  21.2257  17.6    0.6	Sco X-1
254.4563  35.3531    2.1  34.5  -38.3   1.5503   5.6    0.6	Her X-1
268.3655  -1.3632   20.6  56.0    9.2   0.8411   0.6    5.4	SW J1753.5-0127
212.6308 -15.9443    2.3  39.9   86.4   4.5923   4.9 ------	UNKNOWN
261.5879   6.4322    3.6  46.3    4.6   1.3338   3.2 ------	UNKNOWN
182.2648  62.7978    3.5  45.3 -121.3   3.6050   3.3 ------	UNKNOWN
Pre-slew background subtracted image of 15-350 keV band
Time interval of the image:
0.008000 0.240000

# RAcent  DECcent POSerr Theta    Phi  PeakCts   SNR AngSep     Name
#  [deg]    [deg]    ['] [deg]  [deg]                   [']
245.0795 -15.7452    7.8  48.2   42.4   0.0552   1.5    8.5	Sco X-1
254.5050  35.3192    6.4  34.5  -38.3   0.0169   1.8    2.7	Her X-1
268.3034  -1.5242    7.9  56.0    9.4  -0.0622  -1.5    5.8	SW J1753.5-0127
221.6026  12.2660    0.9  12.3   57.6   0.0982  12.5 ------	UNKNOWN
Post-slew image of 15-350 keV band
Time interval of the image:
53.324600 962.894000
1175.824000 1175.824610

# RAcent  DECcent POSerr Theta    Phi  PeakCts   SNR AngSep     Name
#  [deg]    [deg]    ['] [deg]  [deg]                   [']
244.9825 -15.6355    0.2  36.3   25.8  85.4166  59.5    0.3	Sco X-1
254.5056  35.2717    3.9  37.6  -67.4   6.8742   3.0    4.9	Her X-1
263.0989 -24.6605    5.2  54.8   18.5  10.5397   2.2    7.1	GX 1+4
268.3883  -1.4587    8.4  48.4  -10.8   2.4435   1.4    1.3	SW J1753.5-0127
176.2982  -2.2629    3.0  47.3  141.2  16.0521   3.9 ------	UNKNOWN
211.6359   3.1281    3.9  13.5  113.9   2.6546   2.9 ------	UNKNOWN
266.3160 -13.9879    2.7  51.5    5.3  10.0851   4.2 ------	UNKNOWN
247.4510  -3.7503    3.5  30.3    6.4   3.5632   3.2 ------	UNKNOWN
182.9670  44.2612    3.6  46.0 -152.5   5.5477   3.2 ------	UNKNOWN
180.5611  54.7816    3.1  53.2 -142.2  19.4796   3.7 ------	UNKNOWN
218.8524  56.1614    4.5  43.9 -116.2  10.5316   2.6 ------	UNKNOWN