Analysis Summary
Notes:
- 1) No attempt has been made to eliminate the non-significant decimal places.
- 2) This batgrbproduct analysis is done using the HEASARC data.
- 3) This batgrbproduct analysis is using the flight position for the mask-weighting calculation.
======================================================================
BAT GRB EVENT DATA PROCESSING REPORT
Process Script Ver: batgrbproduct v2.46
Process Start Time: Sun May 17 01:32:26 EDT 2015
Host Name: bat1
Current Working Dir: /local/data/bat1/alien/Swift_3rdBATcatalog/event/batevent_reproc/trigger638946
======================================================================
Trigger: 00638946 Segment: 000
BAT Trigger Time: 451554190.564 [s; MET]
Trigger Stop: 451554190.628 [s; MET]
UTC: 2015-04-24T07:42:57.075440 [includes UTCF correction]
Where From?: (*SHORT BURST*) TDRSS scaled map message
BAT
RA: 152.312128050396 Dec: -26.6466164433475 [deg; J2000]
Catalogged Source?: NO
Point Source?: YES
GRB Indicated?: YES [ by BAT flight software ]
Image S/N Ratio: 15.22
Image Trigger?: NO
Rate S/N Ratio: 250.966133173383 [ if not an image trigger ]
Image S/N Ratio: 15.22
Analysis Position: [ source = BAT ]
RA: 152.312128050396 Dec: -26.6466164433475 [deg; J2000]
Refined Position: [ source = BAT pre-slew burst ]
RA: 152.305235855337 Dec: -26.6473550660799 [deg; J2000]
{ 10h 09m 13.3s , -26d 38' 50.5" }
+/- 0.895851674156214 [arcmin] (estimated 90% radius based on SNR)
+/- 0.269648104699712 [arcmin] (formal 1-sigma fit error)
SNR: 35.5920095349208
Angular difference between the analysis and refined position is 0.372257 arcmin
Partial Coding Fraction: 0.6953125 [ including projection effects ]
Duration
T90: 81.055999994278 +/- 17.4800292500718
Measured from: -0.0279999971389771
to: 81.027999997139 [s; relative to TRIGTIME]
T50: 12.7520000338554 +/- 18.3920277981243
Measured from: 0.0839999914169312
to: 12.8360000252724 [s; relative to TRIGTIME]
Fluence
Peak Flux (peak 1 second)
Measured from: -0.0720000267028809
to: 0.927999973297119 [s; relative to TRIGTIME]
Total Fluence
Measured from: -0.0600000023841858
to: 95.0119999647141 [s; relative to TRIGTIME]
Band 1 Band 2 Band 3 Band 4
15-25 25-50 50-100 100-350 keV
Total 0.431852 0.685924 0.762470 0.309109
0.059178 0.061578 0.054463 0.046555 [error]
Peak 0.244502 0.452358 0.620572 0.279085
0.011892 0.015366 0.017930 0.015690 [error]
[ fluence units of on-axis counts / fully illuminated detector ]
======================================================================
====== Table of the duration information =============================
Value tstart tstop
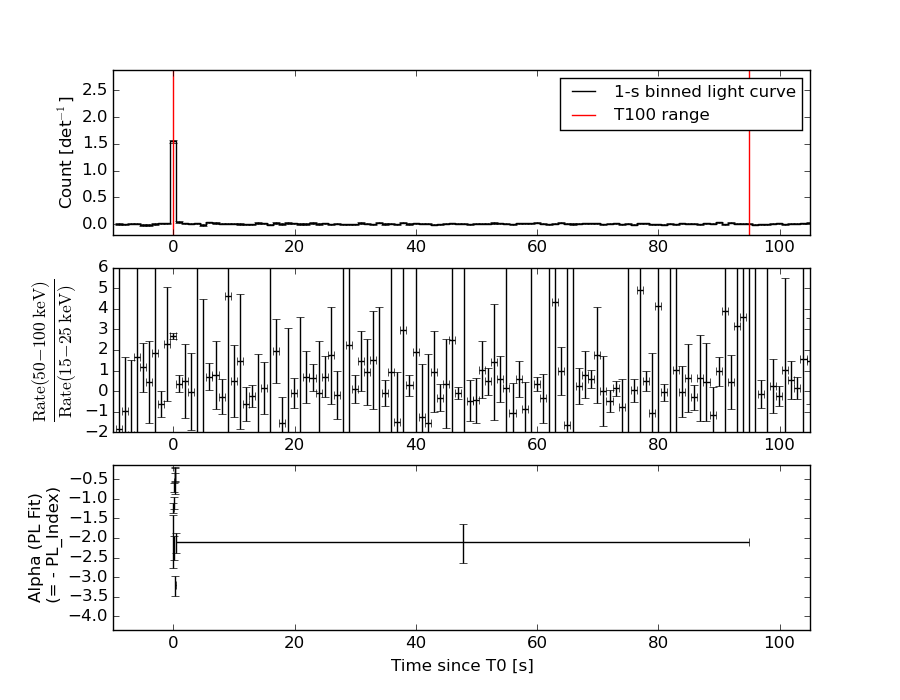
T100 95.072 -0.060 95.012
T90 81.056 -0.028 81.028
T50 12.752 0.084 12.836
Peak 1.000 -0.072 0.928
====== Spectral Analysis Summary =====================================
Model : spectral model: simple power-law (PL) and cutoff power-law (CPL)
Ph_index : photon index: E^{Ph_index}
Ph_90err : 90% error of the photon index
Epeak : Epeak in keV
Epeak_90err: 90% error of Epeak
Norm : normalization at 50 keV in both the PL model and CPL model
Nomr_90err : 90% error of the normalization
chi2 : Chi-Squared
dof : degree of freedo
=== Time-averaged spectral analysis ===
(Best model with acceptable fit: PL)
Model Ph_index Ph_90err_low Ph_90err_hi Epeak Epeak_90err_low Epeak_90err_hi Norm Nomr_90err_low Norm_90err_hi chi2 dof
PL -1.172 -0.149 0.153 - - - 1.54e-03 -1.27e-04 1.26e-04 61.850 57
CPL -1.122 -0.202 0.335 983.671 -983.671 -983.671 1.62e-03 -2.02e-04 4.99e-05 62.140 56
=== 1-s peak spectral analysis ===
(Best model with acceptable fit: PL)
Model Ph_index Ph_90err_low Ph_90err_hi Epeak Epeak_90err_low Epeak_90err_hi Norm Nomr_90err_low Norm_90err_hi chi2 dof
PL -0.803 -0.062 0.062 - - - 1.05e-01 -3.68e-03 3.66e-03 49.540 57
CPL -0.795 -0.063 0.263 9950.560 -9950.560 -9950.560 1.06e-01 -3.64e-03 2.97e-02 49.530 56
=== Fluence/Peak Flux Summary ===
Model Band1 Band2 Band3 Band4 Band5 Total
15-25 25-50 50-100 100-350 15-150 15-350 keV
Fluence PL 1.37e-07 3.09e-07 5.49e-07 2.29e-06 1.50e-06 3.29e-06 erg/cm2
90%_error_low -2.29e-08 -3.12e-08 -5.18e-08 -4.64e-07 -1.31e-07 -4.95e-07 erg/cm2
90%_error_hi 2.41e-08 3.06e-08 5.12e-08 5.46e-07 1.32e-07 5.63e-07 erg/cm2
Peak flux PL 2.22e+00 3.40e+00 3.90e+00 8.55e+00 1.21e+01 1.81e+01 ph/cm2/s
90%_error_low -1.67e-01 -1.55e-01 -1.39e-01 -6.73e-01 -4.15e-01 -7.30e-01 ph/cm2/s
90%_error_hi 1.72e-01 1.55e-01 1.39e-01 7.10e-01 4.15e-01 7.45e-01 ph/cm2/s
Fluence CPL 1.37e-07 3.07e-07 5.43e-07 2.44e-06 1.50e-06 3.12e-06 erg/cm2
90%_error_low N/A -3.70e-08 -5.96e-08 -1.04e-06 -1.69e-07 -7.66e-07 erg/cm2
90%_error_hi N/A 3.96e-08 7.13e-08 8.30e-08 1.59e-07 7.12e-07 erg/cm2
Peak flux CPL 2.18e+00 3.40e+00 8.25e-03 7.69e+00 6.65e-02 7.77e+00 ph/cm2/s
90%_error_low -2.00e-01 -1.41e-01 -8.25e-03 -4.23e+00 -6.65e-02 8.19e+00 ph/cm2/s
90%_error_hi 1.77e-01 1.27e-01 2.24e-02 3.78e+00 8.28e-02 1.06e+01 ph/cm2/s
======================================================================
Image
Pre-slew 15.0-350.0 keV image (Event data)
#   RAcent    DECcent   POSerr    Theta     Phi              Peak Cts       SNR   Name
  152.3052   -26.6474   0.0054    34.0680  -175.1568         1.7368904     35.592 TRIG_00638946

Foreground time interval of the image:
 -0.060   9.137 (delta_t =   9.197 [sec])
Background time interval of the image:
-239.564  -0.060 (delta_t = 239.504 [sec])
Light Curves
Note: The mask-weighted lightcurves have units of either count/det or counts/sec/det, where a det is 0.4 x 0.4 = 0.16 sq cm.
Full-time range; 1 s binning
Other quick-look light curves:
- 64 ms binning (zoomed)
- 16 ms binning (zoomed)
- 8 ms binning (zoomed)
- 2 ms binning (zoomed)
- SN=5 or 10 s binning (full-time range)
- Raw light curve
Spectra
- 64 ms binning (zoomed)
- 16 ms binning (zoomed)
- 8 ms binning (zoomed)
- 2 ms binning (zoomed)
- SN=5 or 10 s binning (full-time range)
- Raw light curve
Spectra
Notes:
- 1) The fitting includes the systematic errors.
- 2) When the burst includes telescope slew time periods, the fitting uses an average response file made from multiple 5-s response files through out the slew time plus single time preiod for the non-slew times, and weighted by the total counts in the corresponding time period using addrmf. An average response file is needed becuase a spectral fit using the pre-slew DRM will introduce some errors in both a spectral shape and a normalization if the PHA file contains a lot of the slew/post-slew time interval.
- 3) For fits to more complicated models (e.g. a power-law over a cutoff power-law), the BAT team has decided to require a chi-square improvement of more than 6 for each extra dof.
Time averaged spectrum fit using the average DRM
Power-law model
Time interval is from   -0.060 sec. to   95.012 sec.

Spectral model in power-law:
------------------------------------------------------------
Parameters  : value       lower 90%   higher 90%
Photon index: -1.17156     ( -0.149173   0.152602 )
Norm@50keV  : 1.53899E-03    ( -0.000126803   0.000126385 )
------------------------------------------------------------
#Fit statistic : Chi-Squared =          61.85 using 59 PHA bins.
# Reduced chi-squared =          1.085 for     57 degrees of freedom
# Null hypothesis probability =   3.070241e-01

Photon flux (15-150 keV)    in 95.07 sec: 0.179957 ( -0.015571  0.01566 ) ph/cm2/s
Energy fluence (15-150 keV)             : 1.49676e-06 ( -1.31414e-07  1.32059e-07 ) ergs/cm2
Cutoff power-law model

Time interval is from   -0.060 sec. to   95.012 sec.
Spectral model in the cutoff power-law:
------------------------------------------------------------
Parameters  : value       lower 90%   higher 90%
Photon index: -1.16699     ( -0.202064   0.334844 )
Epeak [keV] : 1.00000E+04      ( -10000 -10000 )
Norm@50keV  : 1.54658E-03    ( -0.000126215   0.000126035 )
------------------------------------------------------------
#Fit statistic : Chi-Squared =          61.88 using 59 PHA bins.
# Reduced chi-squared =          1.105 for     56 degrees of freedom
# Null hypothesis probability =   2.743960e-01

Photon flux (15-150 keV)    in 95.07 sec: 0.180834 ( -0.017288  0.018823 ) ph/cm2/s
Energy fluence (15-150 keV)             : 1.50226e-06 ( -1.69462e-07  1.59331e-07 ) ergs/cm2
1-s peak spectrum fit
Power-law model
Time interval is from   -0.072 sec. to    0.928 sec.

Spectral model in power-law:
------------------------------------------------------------
Parameters  : value       lower 90%   higher 90%
Photon index: -0.802818     ( -0.0617769   0.062327 )
Norm@50keV  : 0.104953    ( -0.00368044   0.00366314 )
------------------------------------------------------------
#Fit statistic : Chi-Squared =          49.54 using 59 PHA bins.
# Reduced chi-squared =         0.8691 for     57 degrees of freedom
# Null hypothesis probability =   7.481738e-01

Photon flux (15-150 keV)    in 1 sec: 12.0611 ( -0.415  0.4153 ) ph/cm2/s
Energy fluence (15-150 keV)             : 1.22512e-06 ( -4.55601e-08  4.56589e-08 ) ergs/cm2
Cutoff power-law model
Time interval is from   -0.072 sec. to    0.928 sec.
Spectral model in the cutoff power-law:
------------------------------------------------------------
Parameters  : value       lower 90%   higher 90%
Photon index: -0.795095     ( -0.0625724   0.263483 )
Epeak [keV] : 9950.56      ( -9892.71 -9892.71 )
Norm@50keV  : 0.105703    ( -0.0036492   0.0296862 )
------------------------------------------------------------
#Fit statistic : Chi-Squared =          49.53 using 59 PHA bins.
# Reduced chi-squared =         0.8844 for     56 degrees of freedom
# Null hypothesis probability =   7.167909e-01

Photon flux (15-150 keV)    in 1 sec: 6.64938E-02 ( -0.0664938  0.0827652 ) ph/cm2/s
Energy fluence (15-150 keV)             : 2.66827e-08 ( 0  0 ) ergs/cm2
Time-resolved spectra
Distribution
T90 vs. Hardness ratio plot
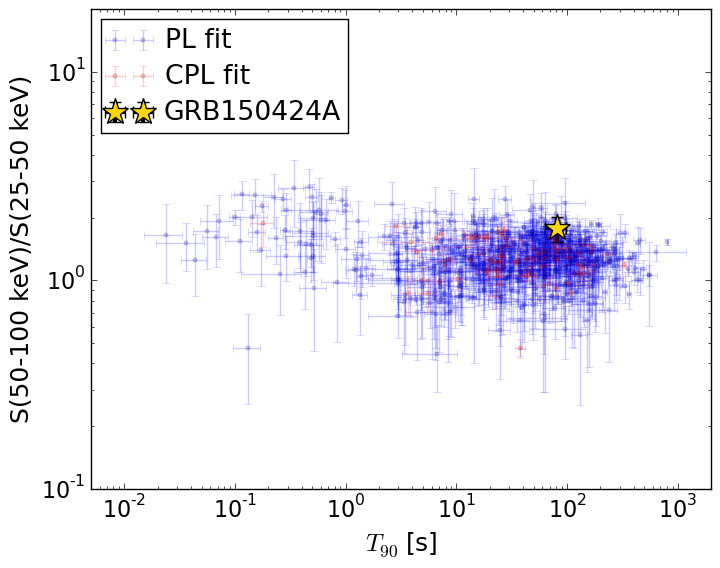
T90                                   = 81.056 sec.
Hardness ratio (energy fluence ratio) = 1.7758650315
S(15-50 keV) vs. S(50-150 keV) plot
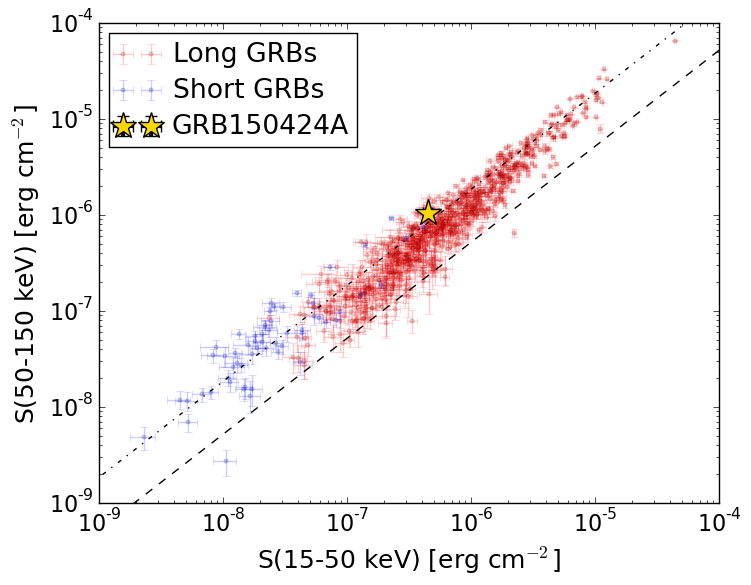
S(15-50 keV)  = 4.464912e-07
S(50-150 keV) = 1.0502676e-06
The dash-dotted line and the dashed line traces the fluences calculated from the Band function with Epeak = 15 and 150 keV, respectively. Both lines assume a canonical values of alpha = -1 and beta = -2.5.
Mask shadow pattern
IMX = -6.738218905893313E-01, IMY = 5.709394877316486E-02
Spacecraft aspect plot
Bright source in the pre-burst/pre-slew/post-slew images
Pre-burst image of 15-350 keV band
Time interval of the image:
-239.564000 -0.060000

# RAcent  DECcent POSerr Theta    Phi  PeakCts   SNR AngSep     Name
#  [deg]    [deg]    ['] [deg]  [deg]                   [']
135.5888 -40.6384    5.1  53.7 -175.0   1.4619   2.3    5.7	Vela X-1
201.3187 -30.4920    3.9  41.0  111.8   2.4750   2.9 ------	UNKNOWN
121.7342 -32.1863    3.5  58.8 -159.3   4.8241   3.3 ------	UNKNOWN
189.6613  58.5217    2.3  59.2  -20.4   6.2319   4.9 ------	UNKNOWN
130.4924 -16.6153    2.6  45.7 -144.5   1.8881   4.4 ------	UNKNOWN
147.0256  31.9921    3.1  40.0  -66.1   2.1285   3.7 ------	UNKNOWN
129.5737   3.0681    2.7  43.8 -116.5   3.5777   4.3 ------	UNKNOWN
Pre-slew background subtracted image of 15-350 keV band
Time interval of the image:
-0.060000 9.136600

# RAcent  DECcent POSerr Theta    Phi  PeakCts   SNR AngSep     Name
#  [deg]    [deg]    ['] [deg]  [deg]                   [']
135.4894 -40.4525    8.2  53.7 -174.7   0.1706   1.4    6.4	Vela X-1
152.3052 -26.6474    0.3  34.1 -175.2   1.7369  35.6 ------	UNKNOWN
131.1279 -37.3112    2.4  54.5 -169.1   0.6473   4.9 ------	UNKNOWN
176.6153  52.2707    2.0  51.6  -27.7   0.6781   5.9 ------	UNKNOWN
Post-slew image of 15-350 keV band
Time interval of the image:
75.536620 962.566000

# RAcent  DECcent POSerr Theta    Phi  PeakCts   SNR AngSep     Name
#  [deg]    [deg]    ['] [deg]  [deg]                   [']
135.5272 -40.5526    1.7  19.7 -137.4   3.9709   6.8    0.1	Vela X-1
170.3862 -60.6351    4.4  36.2  167.0   2.2742   2.6    2.2	Cen X-3
186.6944 -62.7769    0.8  42.6  159.5  17.8632  13.7    1.1	GX 301-2
175.5856  19.0359    3.9  50.9   30.7   8.4977   3.0 ------	UNKNOWN
161.1524 -44.2019    2.8  19.0  162.1   2.2895   4.2 ------	UNKNOWN
101.4962 -38.0470    3.9  43.9 -116.3   7.7909   3.0 ------	UNKNOWN