Analysis Summary
Notes:
- 1) No attempt has been made to eliminate the non-significant decimal places.
- 2) This batgrbproduct analysis is done using the HEASARC data.
- 3) This batgrbproduct analysis is using the flight position for the mask-weighting calculation.
======================================================================
BAT GRB EVENT DATA PROCESSING REPORT
Process Script Ver: batgrbproduct v2.46
Process Start Time: Sun May 17 01:36:21 EDT 2015
Host Name: bat1
Current Working Dir: /local/data/bat1/alien/Swift_3rdBATcatalog/event/batevent_reproc/trigger639275
======================================================================
Trigger: 00639275 Segment: 000
BAT Trigger Time: 451877454.336 [s; MET]
Trigger Stop: 451877466.496 [s; MET]
UTC: 2015-04-28T01:30:40.830840 [includes UTCF correction]
Where From?: TDRSS position message
BAT
RA: 188.542964551214 Dec: 6.98089967772161 [deg; J2000]
Catalogged Source?: NO
Point Source?: YES
GRB Indicated?: YES [ by BAT flight software ]
Image S/N Ratio: 12.63
Image Trigger?: NO
Rate S/N Ratio: 29.8328677803526 [ if not an image trigger ]
Image S/N Ratio: 12.63
Analysis Position: [ source = BAT ]
RA: 188.542964551214 Dec: 6.98089967772161 [deg; J2000]
Refined Position: [ source = BAT pre-slew burst ]
RA: 188.538673448652 Dec: 6.96671144259539 [deg; J2000]
{ 12h 34m 09.3s , +06d 58' 00.2" }
+/- 1.15663426067642 [arcmin] (estimated 90% radius based on SNR)
+/- 0.475345665076019 [arcmin] (formal 1-sigma fit error)
SNR: 24.7080405337351
Angular difference between the analysis and refined position is 0.888827 arcmin
Partial Coding Fraction: 0.1699219 [ including projection effects ]
Duration
T90: 53.2000000476837 +/- 15.37787291802
Measured from: -20.4560000300407
to: 32.744000017643 [s; relative to TRIGTIME]
T50: 21.6320000886917 +/- 1.83630939072554
Measured from: 2.11999994516373
to: 23.7520000338554 [s; relative to TRIGTIME]
Fluence
Peak Flux (peak 1 second)
Measured from: 17.3879999518394
to: 18.3879999518394 [s; relative to TRIGTIME]
Total Fluence
Measured from: -38.9840000271797
to: 38.5999999642372 [s; relative to TRIGTIME]
Band 1 Band 2 Band 3 Band 4
15-25 25-50 50-100 100-350 keV
Total 1.867037 3.026385 2.913393 0.986503
0.145113 0.149580 0.134842 0.110949 [error]
Peak 0.070898 0.122941 0.129270 0.036601
0.017485 0.019918 0.018402 0.015643 [error]
[ fluence units of on-axis counts / fully illuminated detector ]
======================================================================
====== Table of the duration information =============================
Value tstart tstop
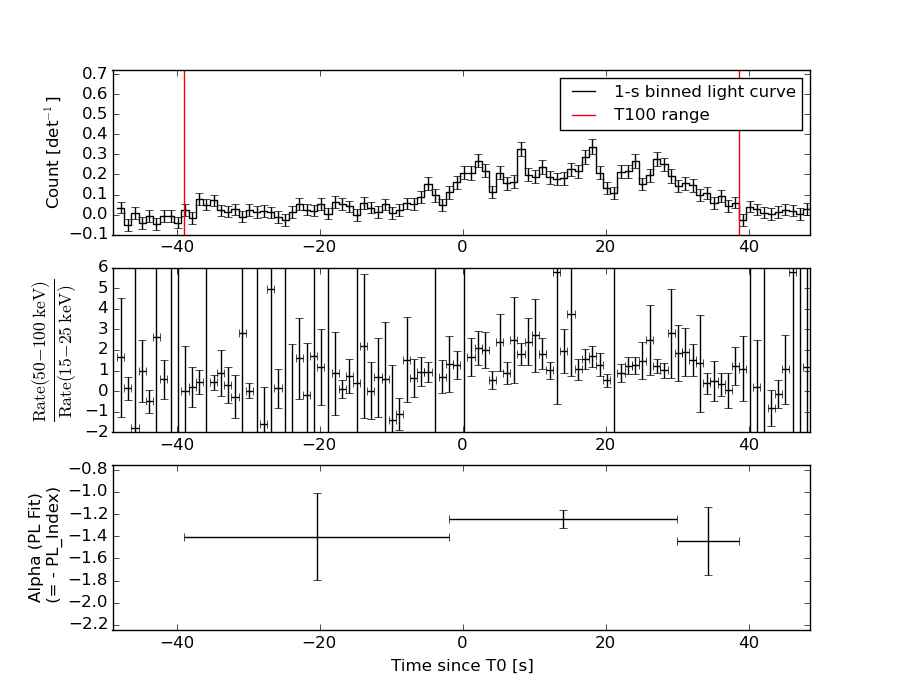
T100 77.584 -38.984 38.600
T90 53.200 -20.456 32.744
T50 21.632 2.120 23.752
Peak 1.000 17.388 18.388
====== Spectral Analysis Summary =====================================
Model : spectral model: simple power-law (PL) and cutoff power-law (CPL)
Ph_index : photon index: E^{Ph_index}
Ph_90err : 90% error of the photon index
Epeak : Epeak in keV
Epeak_90err: 90% error of Epeak
Norm : normalization at 50 keV in both the PL model and CPL model
Nomr_90err : 90% error of the normalization
chi2 : Chi-Squared
dof : degree of freedo
=== Time-averaged spectral analysis ===
(Best model with acceptable fit: PL)
Model Ph_index Ph_90err_low Ph_90err_hi Epeak Epeak_90err_low Epeak_90err_hi Norm Nomr_90err_low Norm_90err_hi chi2 dof
PL -1.282 -0.091 0.092 - - - 8.20e-03 -4.19e-04 4.18e-04 58.320 57
CPL -1.211 -0.126 0.337 602.376 -602.376 -602.376 8.82e-03 -9.42e-04 3.38e-03 58.350 56
=== 1-s peak spectral analysis ===
(Best model with acceptable fit: N/A)
Model Ph_index Ph_90err_low Ph_90err_hi Epeak Epeak_90err_low Epeak_90err_hi Norm Nomr_90err_low Norm_90err_hi chi2 dof
PL -1.390 -0.275 0.275 - - - 2.46e-02 -4.01e-03 3.99e-03 74.590 57
CPL -1.134 -1.557 1.292 180.793 -180.793 -180.793 3.28e-02 -1.19e-02 9.88e-02 74.430 56
=== Fluence/Peak Flux Summary ===
Model Band1 Band2 Band3 Band4 Band5 Total
15-25 25-50 50-100 100-350 15-150 15-350 keV
Fluence PL 6.63e-07 1.39e-06 2.29e-06 8.52e-06 6.32e-06 1.29e-05 erg/cm2
90%_error_low -6.87e-08 -8.70e-08 -1.31e-07 -1.07e-06 -3.33e-07 -1.14e-06 erg/cm2
90%_error_hi 7.14e-08 8.65e-08 1.30e-07 1.18e-06 3.33e-07 1.22e-06 erg/cm2
Peak flux PL 9.13e-01 9.81e-01 7.48e-01 9.32e-01 2.99e+00 3.57e+00 ph/cm2/s
90%_error_low -2.58e-01 -1.82e-01 -1.44e-01 -3.24e-01 -5.05e-01 -5.85e-01 ph/cm2/s
90%_error_hi 2.81e-01 1.78e-01 1.42e-01 4.10e-01 5.06e-01 5.88e-01 ph/cm2/s
Fluence CPL 6.56e-07 1.40e-06 2.30e-06 8.05e-06 6.31e-06 1.27e-05 erg/cm2
90%_error_low -8.97e-08 -7.48e-08 -1.41e-07 -2.83e-06 -3.44e-07 -3.21e-06 erg/cm2
90%_error_hi 6.23e-08 9.00e-08 1.59e-07 7.33e-07 3.35e-07 1.15e-06 erg/cm2
Peak flux CPL 8.66e-01 1.00e+00 7.72e-01 7.11e-01 2.97e+00 3.35e+00 ph/cm2/s
90%_error_low -3.18e-01 -1.99e-01 -1.63e-01 -7.11e-01 -5.16e-01 -7.48e-01 ph/cm2/s
90%_error_hi 3.17e-01 2.12e-01 1.78e-01 3.17e-01 5.17e-01 7.65e-01 ph/cm2/s
======================================================================
Image
Pre-slew 15.0-350.0 keV image (Event data)
#   RAcent    DECcent   POSerr    Theta     Phi              Peak Cts       SNR   Name
  188.5387     6.9667   0.0078    43.7027    36.7805         9.4345585     24.708 TRIG_00639275

Foreground time interval of the image:
-38.984  38.600 (delta_t =  77.584 [sec])
Background time interval of the image:
-239.336 -38.984 (delta_t = 200.352 [sec])
Light Curves
Note: The mask-weighted lightcurves have units of either count/det or counts/sec/det, where a det is 0.4 x 0.4 = 0.16 sq cm.
Full-time range; 1 s binning
Other quick-look light curves:
- 64 ms binning (zoomed)
- 16 ms binning (zoomed)
- 8 ms binning (zoomed)
- 2 ms binning (zoomed)
- SN=5 or 10 s binning (full-time range)
- Raw light curve
Spectra
- 64 ms binning (zoomed)
- 16 ms binning (zoomed)
- 8 ms binning (zoomed)
- 2 ms binning (zoomed)
- SN=5 or 10 s binning (full-time range)
- Raw light curve
Spectra
Notes:
- 1) The fitting includes the systematic errors.
- 2) When the burst includes telescope slew time periods, the fitting uses an average response file made from multiple 5-s response files through out the slew time plus single time preiod for the non-slew times, and weighted by the total counts in the corresponding time period using addrmf. An average response file is needed becuase a spectral fit using the pre-slew DRM will introduce some errors in both a spectral shape and a normalization if the PHA file contains a lot of the slew/post-slew time interval.
- 3) For fits to more complicated models (e.g. a power-law over a cutoff power-law), the BAT team has decided to require a chi-square improvement of more than 6 for each extra dof.
Time averaged spectrum fit using the average DRM
Power-law model
Time interval is from  -38.984 sec. to   38.600 sec.

Spectral model in power-law:
------------------------------------------------------------
Parameters  : value       lower 90%   higher 90%
Photon index: -1.28205     ( -0.0913393   0.092149 )
Norm@50keV  : 8.20483E-03    ( -0.000418841   0.000417965 )
------------------------------------------------------------
#Fit statistic : Chi-Squared =          58.32 using 59 PHA bins.
# Reduced chi-squared =          1.023 for     57 degrees of freedom
# Null hypothesis probability =   4.264261e-01

Photon flux (15-150 keV)    in 77.58 sec: 0.975705 ( -0.054252  0.054545 ) ph/cm2/s
Energy fluence (15-150 keV)             : 6.31888e-06 ( -3.32696e-07  3.3324e-07 ) ergs/cm2
Cutoff power-law model
Time interval is from  -38.984 sec. to   38.600 sec.
Spectral model in the cutoff power-law:
------------------------------------------------------------
Parameters  : value       lower 90%   higher 90%
Photon index: -1.2107     ( -0.0993887   0.364058 )
Epeak [keV] : 602.376      ( -998.611 -998.611 )
Norm@50keV  : 8.81757E-03    ( -0.000707914   0.00361373 )
------------------------------------------------------------
#Fit statistic : Chi-Squared =          58.35 using 59 PHA bins.
# Reduced chi-squared =          1.042 for     56 degrees of freedom
# Null hypothesis probability =   3.891353e-01

Photon flux (15-150 keV)    in 77.58 sec: 0.973586 ( -0.057536  0.053344 ) ph/cm2/s
Energy fluence (15-150 keV)             : 6.30753e-06 ( -3.43779e-07  3.35399e-07 ) ergs/cm2
1-s peak spectrum fit
Power-law model
Time interval is from   17.388 sec. to   18.388 sec.

Spectral model in power-law:
------------------------------------------------------------
Parameters  : value       lower 90%   higher 90%
Photon index: -1.39009     ( -0.27504   0.275052 )
Norm@50keV  : 2.46418E-02    ( -0.00400574   0.00399476 )
------------------------------------------------------------
#Fit statistic : Chi-Squared =          74.59 using 59 PHA bins.
# Reduced chi-squared =          1.309 for     57 degrees of freedom
# Null hypothesis probability =   5.890228e-02

Photon flux (15-150 keV)    in 1 sec: 2.99428 ( -0.50465  0.50635 ) ph/cm2/s
Energy fluence (15-150 keV)             : 2.38622e-07 ( -4.17427e-08  4.1986e-08 ) ergs/cm2
Cutoff power-law model
Time interval is from   17.388 sec. to   18.388 sec.
Spectral model in the cutoff power-law:
------------------------------------------------------------
Parameters  : value       lower 90%   higher 90%
Photon index: -1.13362     ( -1.55692   1.29188 )
Epeak [keV] : 180.793      ( -180.835 -180.835 )
Norm@50keV  : 3.28026E-02    ( -0.01191   0.0988501 )
------------------------------------------------------------
#Fit statistic : Chi-Squared =          74.43 using 59 PHA bins.
# Reduced chi-squared =          1.329 for     56 degrees of freedom
# Null hypothesis probability =   5.031863e-02

Photon flux (15-150 keV)    in 1 sec: 2.96943 ( -0.51633  0.51672 ) ph/cm2/s
Energy fluence (15-150 keV)             : 2.35977e-07 ( -4.40748e-08  4.32645e-08 ) ergs/cm2
Time-resolved spectra
Distribution
T90 vs. Hardness ratio plot
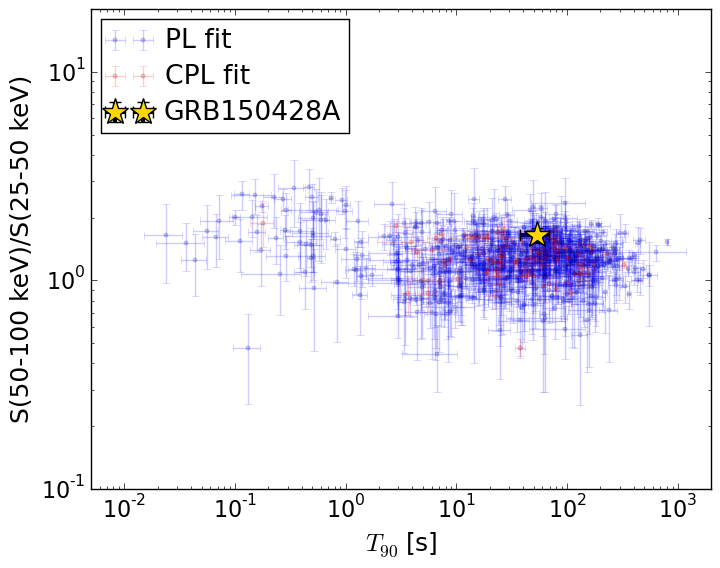
T90                                   = 53.2 sec.
Hardness ratio (energy fluence ratio) = 1.64490221909
S(15-50 keV) vs. S(50-150 keV) plot
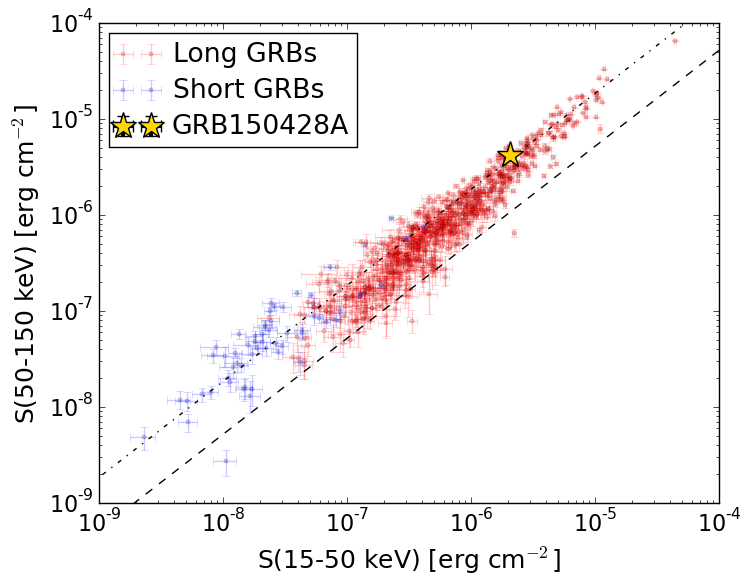
S(15-50 keV)  = 2.0550814e-06
S(50-150 keV) = 4.263762e-06
The dash-dotted line and the dashed line traces the fluences calculated from the Band function with Epeak = 15 and 150 keV, respectively. Both lines assume a canonical values of alpha = -1 and beta = -2.5.
Mask shadow pattern
IMX = 7.654619671080761E-01, IMY = -5.722318943621115E-01
Spacecraft aspect plot
Bright source in the pre-burst/pre-slew/post-slew images
Pre-burst image of 15-350 keV band
Time interval of the image:
-239.336000 -38.984000

# RAcent  DECcent POSerr Theta    Phi  PeakCts   SNR AngSep     Name
#  [deg]    [deg]    ['] [deg]  [deg]                   [']
170.1468 -60.5288    6.2  34.1  -91.6   0.7625   1.9    7.5	Cen X-3
186.7093 -62.7743    1.7  30.5 -105.3   1.9229   6.7    1.5	GX 301-2
244.9943 -15.6450    0.6  41.2  132.9  10.7369  17.8    0.9	Sco X-1
255.9938 -37.8416    1.8  41.7  169.8   2.2892   6.6    0.4	4U 1700-377
256.2596 -36.5287    0.0  42.2  167.9   0.5295   1.4   10.6	GX 349+2
262.8717 -24.6174   31.2  51.5  155.1  -0.3978  -0.4   10.7	GX 1+4
264.6097 -44.4384    9.2  46.9 -179.3   0.5245   1.3    5.7	4U 1735-44
262.9243 -33.8219    6.2  48.2  166.3   1.0757   1.9    3.3	GX 354-0
225.0038  -0.4576    3.6  39.1   93.9   2.5379   3.3 ------	UNKNOWN
217.1023  -4.4131    3.1  32.2   84.4   1.6641   3.7 ------	UNKNOWN
251.8589 -24.0150    2.5  42.7  148.5   2.6651   4.6 ------	UNKNOWN
195.2906 -61.6075    1.4  27.9 -112.0   2.2152   8.2 ------	UNKNOWN
146.5616  -6.8437    3.0  59.4  -17.2   4.6050   3.8 ------	UNKNOWN
263.8997 -67.5848    3.5  47.3 -147.5   1.5436   3.3 ------	UNKNOWN
Pre-slew background subtracted image of 15-350 keV band
Time interval of the image:
-38.984000 38.600000

# RAcent  DECcent POSerr Theta    Phi  PeakCts   SNR AngSep     Name
#  [deg]    [deg]    ['] [deg]  [deg]                   [']
170.5266 -60.5082    5.6  34.0  -91.8   0.4839   2.1    9.3	Cen X-3
186.7731 -62.7876    3.4  30.5 -105.4  -0.6218  -3.4    3.4	GX 301-2
245.1103 -15.7148    4.1  41.3  133.0  -1.0909  -2.8    8.8	Sco X-1
255.9347 -37.9109   17.0  41.6  169.9   0.1501   0.7    4.7	4U 1700-377
256.4479 -36.3633    5.9  42.4  167.8   0.4698   2.0    3.6	GX 349+2
263.0566 -24.7817   99.9  51.6  155.4  -0.0763  -0.1    3.4	GX 1+4
264.7874 -44.5201    5.1  47.0 -179.1   0.5817   2.3    4.6	4U 1735-44
263.1824 -33.9047    5.3  48.3  166.5   0.7198   2.2   10.5	GX 354-0
188.5387   6.9667    0.5  43.7   36.8   9.4345  24.7 ------	UNKNOWN
265.3551 -42.2689    2.5  47.8  178.0   1.1897   4.5 ------	UNKNOWN
159.9053 -33.6921    2.2  36.2  -42.7   0.9115   5.3 ------	UNKNOWN
232.5991 -70.9337    2.0  39.8 -135.0   1.1216   5.7 ------	UNKNOWN
253.4774 -76.0311    2.2  47.5 -135.2   2.0511   5.3 ------	UNKNOWN
143.1257 -30.3931    2.8  50.8  -44.4   2.3592   4.2 ------	UNKNOWN
Post-slew image of 15-350 keV band
Time interval of the image:
158.164600 334.964600

# RAcent  DECcent POSerr Theta    Phi  PeakCts   SNR AngSep     Name
#  [deg]    [deg]    ['] [deg]  [deg]                   [']
191.0539  -8.1591    3.3  15.3  132.4   0.5206   3.5 ------	UNKNOWN
185.0416   7.1117    2.1   3.5 -125.6   0.8350   5.5 ------	UNKNOWN
136.2316  -8.6194    3.5  54.5 -144.1   3.7625   3.3 ------	UNKNOWN
153.1990  30.9862    3.0  40.9  -87.6   3.0363   3.8 ------	UNKNOWN