Analysis Summary
Notes:
- 1) No attempt has been made to eliminate the non-significant decimal places.
- 2) This batgrbproduct analysis is done using the HEASARC data.
- 3) This batgrbproduct analysis is using the flight position for the mask-weighting calculation.
======================================================================
                  BAT GRB EVENT DATA PROCESSING REPORT
    Process Script Ver: batgrbproduct v2.46
    Process Start Time: Sun May 17 01:39:14 EDT 2015
             Host Name: bat1
   Current Working Dir: /local/data/bat1/alien/Swift_3rdBATcatalog/event/batevent_reproc/trigger639278
======================================================================

  Trigger: 00639278      Segment: 000

  BAT Trigger Time: 451883537.024   [s; MET]
      Trigger Stop: 451883539.072   [s; MET]
               UTC: 2015-04-28T03:12:03.518520    [includes UTCF correction]
       Where From?: TDRSS position message

  BAT
    RA: 292.654499855063   Dec: 4.11579888955815  [deg; J2000]

     Catalogged Source?: NO
     Point Source?:      YES
     GRB Indicated?:     YES    [ by BAT flight software ]
     Image S/N Ratio:    7.45
     Image Trigger?:     NO
     Rate S/N Ratio:     10.2469507659596  [ if not an image trigger ]
     Image S/N Ratio:    7.45

  Analysis Position:   [ source = BAT ]
    RA: 292.654499855063   Dec: 4.11579888955815  [deg; J2000]

  Refined Position:   [ source = BAT pre-slew burst ]
    RA: 292.662067235886   Dec: 4.11398149747663  [deg; J2000]
        { 19h 30m 38.9s , +04d 06' 50.3" }
         +/- 1.30434080093989 [arcmin] (estimated 90% radius based on SNR)
         +/- 0.542734138432509 [arcmin] (formal 1-sigma fit error)
    SNR: 20.810091058089

  Angular difference between the analysis and refined position is 0.465815 arcmin

  Partial Coding Fraction: 0.4023438    [ including projection effects ]

  Duration
     T90: 130.947999954224 +/- 15.5505195049043
        Measured from: -34.4679999947548
                   to: 96.4799999594688     [s; relative to TRIGTIME]
     T50: 65.3439999222755 +/- 4.03605998704794
        Measured from: 0.948000013828278
                   to: 66.2919999361038     [s; relative to TRIGTIME]


  Fluence
     Peak Flux  (peak 1 second)
        Measured from: 1.36000001430511
                   to: 2.36000001430511     [s; relative to TRIGTIME]
     Total Fluence
        Measured from: -40.0600000023842
                   to: 121.744000017643     [s; relative to TRIGTIME]

             Band 1     Band 2     Band 3     Band 4
              15-25      25-50     50-100    100-350     keV
 Total     1.863345   2.553690   1.550793   0.318924
           0.129963   0.118215   0.096920   0.078396 [error]
 Peak      0.029061   0.073378   0.054437   0.019138
           0.012712   0.012299   0.010221   0.007633 [error]

     [ fluence units of on-axis counts / fully illuminated detector ]

======================================================================


====== Table of the duration information =============================

        Value   tstart    tstop
T100  161.804  -40.060  121.744
T90   130.948  -34.468   96.480
T50    65.344    0.948   66.292
Peak    1.000    1.360    2.360


====== Spectral Analysis Summary =====================================

Model      : spectral model: simple power-law (PL) and cutoff power-law (CPL)
Ph_index   : photon index: E^{Ph_index}
Ph_90err   : 90% error of the photon index
Epeak      : Epeak in keV
Epeak_90err: 90% error of Epeak
Norm       : normalization at 50 keV in both the PL model and CPL model
Nomr_90err : 90% error of the normalization
chi2       : Chi-Squared
dof        : degree of freedo

=== Time-averaged spectral analysis ===
(Best model with acceptable fit: CPL)

Model Ph_index Ph_90err_low Ph_90err_hi  Epeak  Epeak_90err_low  Epeak_90err_hi  Norm       Nomr_90err_low    Norm_90err_hi    chi2    dof
PL      -1.808    -0.099      0.098       -           -               -         2.56e-03     -1.51e-04          1.51e-04      48.990   57
CPL     -0.965    -0.440      0.492       58.295      -7.751        15.447      7.03e-03     -2.84e-03          5.55e-03      37.310   56


=== 1-s peak spectral analysis ===
(Best model with acceptable fit: PL)

Model Ph_index Ph_90err_low Ph_90err_hi  Epeak  Epeak_90err_low  Epeak_90err_hi  Norm       Nomr_90err_low    Norm_90err_hi    chi2    dof
PL      -1.393     -0.314     0.321       -           -               -         1.23e-02     -2.42e-03          2.41e-03      55.760   57
CPL     -0.120     -1.304     1.830       81.244     -23.839      3168.746      4.76e-02     -4.76e-02          2.81e-01      52.990   56


=== Fluence/Peak Flux Summary ===

              Model    Band1     Band2     Band3     Band4     Band5     Total
                       15-25     25-50    50-100    100-350    15-150    15-350    keV
Fluence         PL   7.06e-07  1.08e-06  1.23e-06  2.68e-06  3.81e-06  5.69e-06   erg/cm2
      90%_error_low -6.45e-08 -6.20e-08 -9.53e-08 -4.11e-07 -2.28e-07 -4.99e-07   erg/cm2
      90%_error_hi   6.63e-08  6.19e-08  9.54e-08  4.57e-07  2.29e-07  5.32e-07   erg/cm2
Peak flux       PL   4.57e-01  4.90e-01  3.73e-01  4.63e-01  1.50e+00  1.78e+00   ph/cm2/s
      90%_error_low -1.57e-01 -1.15e-01 -8.10e-02 -1.75e-01 -3.16e-01 -3.49e-01   ph/cm2/s
      90%_error_hi   1.78e-01  1.13e-01  8.00e-02  2.27e-01  3.20e-01  3.49e-01   ph/cm2/s

Fluence        CPL   6.19e-07  1.17e-06  1.26e-06  8.92e-07  3.57e-06  3.93e-06   erg/cm2
      90%_error_low -7.74e-08 -7.80e-08 -1.08e-07 -3.55e-07 -2.56e-07 -4.38e-07   erg/cm2
      90%_error_hi   7.87e-08  7.96e-08  1.07e-07  6.18e-07  2.58e-07  6.51e-07   erg/cm2
Peak flux      CPL   3.36e-01  5.27e-01  4.26e-01  1.79e-01  1.42e+00  1.47e+00   ph/cm2/s
      90%_error_low -1.72e-01 -1.34e-01 -9.96e-02 -1.79e-01 -3.20e-01 -3.51e-01   ph/cm2/s
      90%_error_hi   2.09e-01  1.38e-01  1.03e-01  3.16e-01  3.28e-01  4.20e-01   ph/cm2/s

======================================================================
Image
Pre-slew 15.0-350.0 keV image (Event data)
#   RAcent    DECcent   POSerr    Theta     Phi              Peak Cts       SNR   Name
  292.6621     4.1140   0.0093    43.5554  -154.6046         4.1803718     20.810 TRIG_00639278

Foreground time interval of the image:
-40.060  29.477 (delta_t =  69.537 [sec])
Background time interval of the image:
-239.024 -40.060 (delta_t = 198.964 [sec])
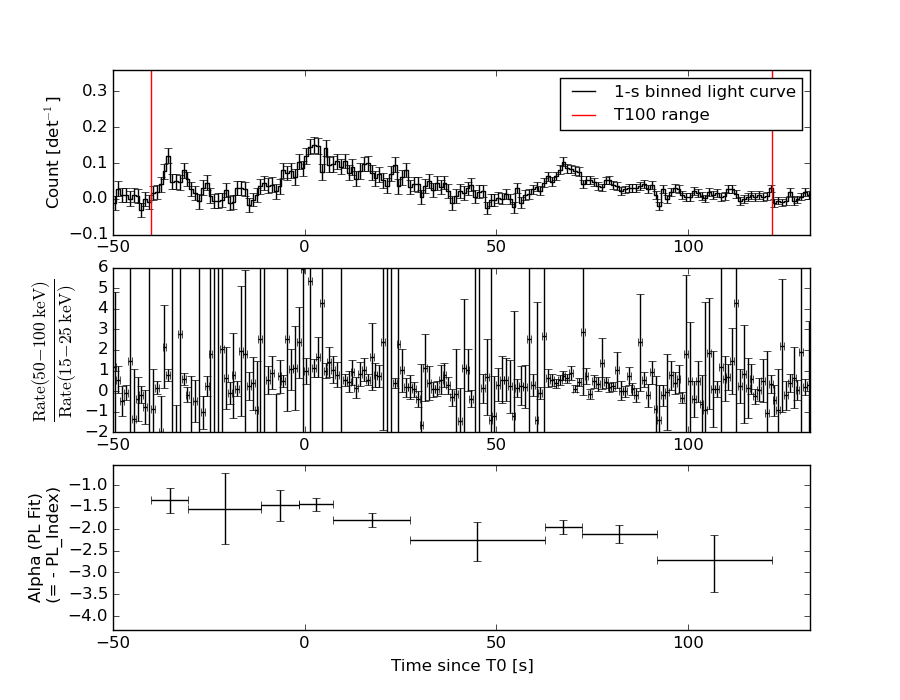
Light Curves
Note: The mask-weighted lightcurves have units of either count/det or counts/sec/det, where a det is 0.4 x 0.4 = 0.16 sq cm.
Full-time range; 1 s binning
Other quick-look light curves:
- 64 ms binning (zoomed)
- 16 ms binning (zoomed)
- 8 ms binning (zoomed)
- 2 ms binning (zoomed)
- SN=5 or 10 s binning (full-time range)
- Raw light curve
Spectra
- 64 ms binning (zoomed)
- 16 ms binning (zoomed)
- 8 ms binning (zoomed)
- 2 ms binning (zoomed)
- SN=5 or 10 s binning (full-time range)
- Raw light curve
Spectra
Notes:
- 1) The fitting includes the systematic errors.
- 2) When the burst includes telescope slew time periods, the fitting uses an average response file made from multiple 5-s response files through out the slew time plus single time preiod for the non-slew times, and weighted by the total counts in the corresponding time period using addrmf. An average response file is needed becuase a spectral fit using the pre-slew DRM will introduce some errors in both a spectral shape and a normalization if the PHA file contains a lot of the slew/post-slew time interval.
- 3) For fits to more complicated models (e.g. a power-law over a cutoff power-law), the BAT team has decided to require a chi-square improvement of more than 6 for each extra dof.
Time averaged spectrum fit using the average DRM
Power-law model
Time interval is from  -40.060 sec. to  121.744 sec.

Spectral model in power-law:
------------------------------------------------------------
Parameters  : value       lower 90%   higher 90%
Photon index: -1.80811     ( -0.0992844   0.0981782 )
Norm@50keV  : 2.55804E-03    ( -0.000151299   0.000150608 )
------------------------------------------------------------
#Fit statistic : Chi-Squared =          48.99 using 59 PHA bins.
# Reduced chi-squared =         0.8596 for     57 degrees of freedom
# Null hypothesis probability =   7.657109e-01

Photon flux (15-150 keV)    in 161.8 sec: 0.353625 ( -0.020871  0.020929 ) ph/cm2/s
Energy fluence (15-150 keV)             : 3.80986e-06 ( -2.28245e-07  2.29373e-07 ) ergs/cm2
Cutoff power-law model
Time interval is from  -40.060 sec. to  121.744 sec.
Spectral model in the cutoff power-law:
------------------------------------------------------------
Parameters  : value       lower 90%   higher 90%
Photon index: -0.964588     ( -0.440441   0.491702 )
Epeak [keV] : 58.2952      ( -7.75111 15.4471 )
Norm@50keV  : 7.03194E-03    ( -0.0028418   0.00554517 )
------------------------------------------------------------
#Fit statistic : Chi-Squared =          37.31 using 59 PHA bins.
# Reduced chi-squared =         0.6662 for     56 degrees of freedom
# Null hypothesis probability =   9.743002e-01

Photon flux (15-150 keV)    in 161.8 sec: 0.338144 ( -0.022232  0.02228 ) ph/cm2/s
Energy fluence (15-150 keV)             : 3.57033e-06 ( -2.56205e-07  2.58348e-07 ) ergs/cm2
1-s peak spectrum fit
Power-law model
Time interval is from    1.360 sec. to    2.360 sec.

Spectral model in power-law:
------------------------------------------------------------
Parameters  : value       lower 90%   higher 90%
Photon index: -1.3934     ( -0.31433   0.321422 )
Norm@50keV  : 1.22969E-02    ( -0.00242018   0.00241424 )
------------------------------------------------------------
#Fit statistic : Chi-Squared =          55.76 using 59 PHA bins.
# Reduced chi-squared =         0.9782 for     57 degrees of freedom
# Null hypothesis probability =   5.217965e-01

Photon flux (15-150 keV)    in 1 sec: 1.49534 ( -0.31596  0.3203 ) ph/cm2/s
Energy fluence (15-150 keV)             : 1.18995e-07 ( -2.40439e-08  2.41348e-08 ) ergs/cm2
Cutoff power-law model
Time interval is from    1.360 sec. to    2.360 sec.
Spectral model in the cutoff power-law:
------------------------------------------------------------
Parameters  : value       lower 90%   higher 90%
Photon index: -0.120369     ( -1.30392   1.83043 )
Epeak [keV] : 81.2439      ( -23.8389 3168.75 )
Norm@50keV  : 4.75519E-02    ( -0.0475526   0.281229 )
------------------------------------------------------------
#Fit statistic : Chi-Squared =          52.99 using 59 PHA bins.
# Reduced chi-squared =         0.9463 for     56 degrees of freedom
# Null hypothesis probability =   5.894798e-01

Photon flux (15-150 keV)    in 1 sec: 1.41528 ( -0.31954  0.32832 ) ph/cm2/s
Energy fluence (15-150 keV)             : 1.13105e-07 ( -2.54453e-08  2.52931e-08 ) ergs/cm2
Time-resolved spectra
Distribution
T90 vs. Hardness ratio plot
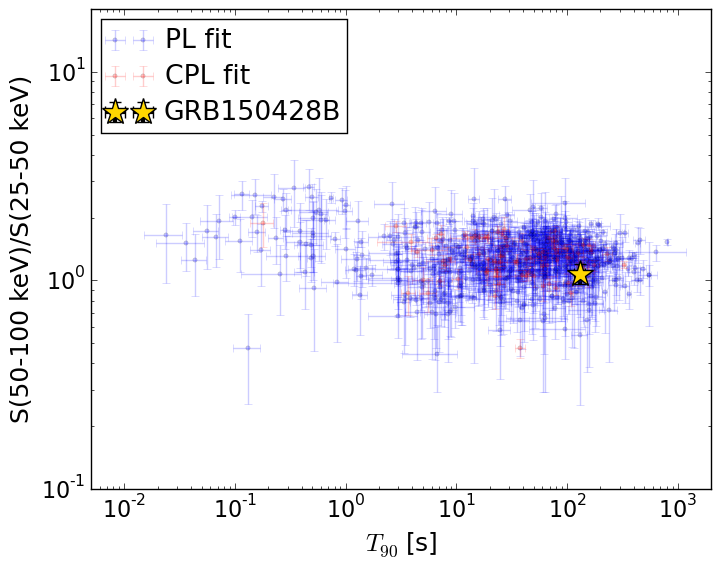
T90                                   = 130.948 sec.
Hardness ratio (energy fluence ratio) = 1.07810250831
S(15-50 keV) vs. S(50-150 keV) plot
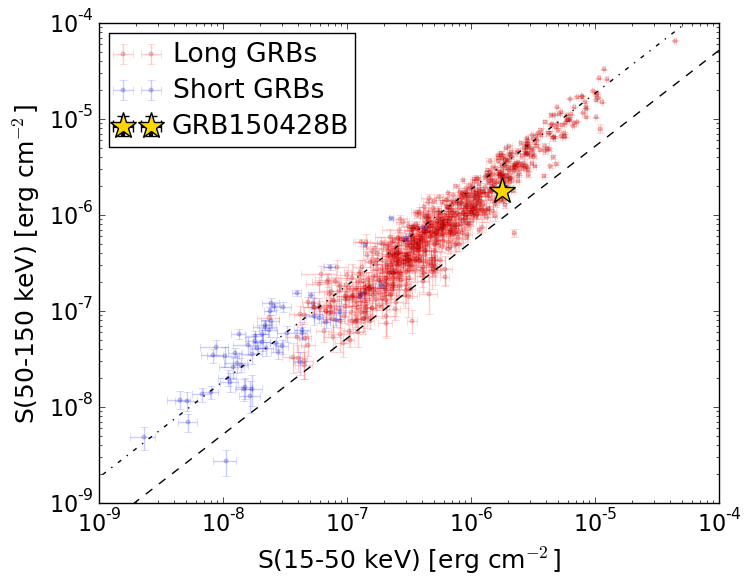
S(15-50 keV)  = 1.7853715e-06
S(50-150 keV) = 1.7849365e-06
The dash-dotted line and the dashed line traces the fluences calculated from the Band function with Epeak = 15 and 150 keV, respectively. Both lines assume a canonical values of alpha = -1 and beta = -2.5.
Mask shadow pattern
IMX = -8.589281366023965E-01, IMY = 4.077643457333014E-01
Spacecraft aspect plot
Bright source in the pre-burst/pre-slew/post-slew images
Pre-burst image of 15-350 keV band
Time interval of the image:
-239.024000 -40.060000

# RAcent  DECcent POSerr Theta    Phi  PeakCts   SNR AngSep     Name
#  [deg]    [deg]    ['] [deg]  [deg]                   [']
244.9869 -15.6329    0.3  23.4  107.5  13.0598  40.1    0.6	Sco X-1
255.9917 -37.7952    2.5  10.4   25.0   1.1162   4.6    2.9	4U 1700-377
256.4968 -36.2818    5.1   9.1   30.3   0.5497   2.3    9.0	GX 349+2
262.9154 -24.6565    6.5   6.0  145.9   0.4309   1.8    7.4	GX 1+4
264.7059 -44.4174   21.5  14.0  -16.8   0.1219   0.5    2.5	4U 1735-44
268.4588  -1.5575    3.2  29.0  170.4  -1.0027  -3.6    8.3	SW J1753.5-0127
270.2784 -25.0855    1.9   7.2 -153.4   1.3110   6.0    0.5	GX 5-1
270.3315 -25.8849    3.7   6.6 -148.5   0.6703   3.2    8.7	GRS 1758-258
273.8826 -14.0083    2.9  18.4 -168.1   0.9594   4.0    7.4	GX 17+2
275.8645 -30.3427    4.5   9.5 -104.5   0.6215   2.6    3.5	H1820-303
284.9300 -24.7593    8.0  18.7 -119.7   0.3635   1.4   11.3	HT1900.1-2455
288.7896  10.9902    1.9  47.3 -164.3   3.1375   6.1    2.7	GRS 1915+105
263.1825 -33.8249    2.8   3.7    4.4   0.9484   4.0    9.7	GX 354-0
196.2693 -53.7559    2.6  53.5   26.0   5.6288   4.5 ------	UNKNOWN
227.0527 -33.9812    2.7  32.0   56.3   1.6543   4.3 ------	UNKNOWN
279.0921 -75.9508    3.5  46.1  -21.9   1.3665   3.3 ------	UNKNOWN
299.7600  16.6969    3.9  57.8 -156.7   5.2576   3.0 ------	UNKNOWN
312.7452 -30.9809    2.8  40.9  -93.6   5.2329   4.1 ------	UNKNOWN
Pre-slew background subtracted image of 15-350 keV band
Time interval of the image:
-40.060000 29.476600

# RAcent  DECcent POSerr Theta    Phi  PeakCts   SNR AngSep     Name
#  [deg]    [deg]    ['] [deg]  [deg]                   [']
245.1040 -15.7337    5.3  23.2  107.5   0.3394   2.2    9.1	Sco X-1
256.0048 -37.8718    8.4  10.5   24.7  -0.1612  -1.4    1.9	4U 1700-377
256.2896 -36.5278    3.5   9.4   29.7   0.4045   3.3    9.4	GX 349+2
262.9578 -24.5733    5.8   6.0  146.5  -0.2198  -2.0   10.7	GX 1+4
264.7998 -44.5547   89.1  14.2  -17.1   0.0154   0.1    6.7	4U 1735-44
268.3164  -1.4973    4.4  29.1  170.1   0.3604   2.6    4.1	SW J1753.5-0127
270.1962 -24.9842    6.2   7.2 -154.4  -0.2006  -1.9    7.4	GX 5-1
270.4993 -25.6348    3.3   6.9 -149.1   0.3801   3.6   12.5	GRS 1758-258
273.8981 -13.8554    0.0  18.5 -168.3   0.1365   1.2   12.5	GX 17+2
275.8938 -30.2102    6.8   9.6 -105.3  -0.1947  -1.7    9.5	H1820-303
284.8608 -25.0066    2.5  18.5 -119.1  -0.5629  -4.6   10.8	HT1900.1-2455
288.8922  10.8039    3.8  47.2 -164.1   0.7138   3.0   10.1	GRS 1915+105
263.0155 -33.6841   24.0   3.7    7.2   0.0527   0.5    9.1	GX 354-0
222.5562 -31.0596    2.6  36.1   60.7   1.2420   4.5 ------	UNKNOWN
233.3586 -16.6165    2.5  31.8   91.3   0.9644   4.6 ------	UNKNOWN
197.8762 -59.0153    2.1  52.6   19.5   3.0511   5.4 ------	UNKNOWN
198.0371 -68.9618    2.3  53.6    7.1   2.1122   4.9 ------	UNKNOWN
292.6621   4.1140    0.6  43.6 -154.6   4.1799  20.8 ------	UNKNOWN
293.2387 -58.6631    2.1  34.3  -43.2   0.8694   5.5 ------	UNKNOWN
303.4782 -25.9569    2.6  34.2 -104.8   0.9131   4.4 ------	UNKNOWN
Post-slew image of 15-350 keV band
Time interval of the image:
95.876670 963.066000

# RAcent  DECcent POSerr Theta    Phi  PeakCts   SNR AngSep     Name
#  [deg]    [deg]    ['] [deg]  [deg]                   [']
254.5950  35.3281    5.7  47.0  152.0   4.1941   2.0    6.8	Her X-1
263.0601 -24.8682    5.5  40.8   58.7   4.0182   2.1    7.9	GX 1+4
268.3528  -1.5501    5.4  24.9   92.7   1.8300   2.2    5.9	SW J1753.5-0127
270.2047 -25.1111    3.2  36.5   51.0   4.4192   3.6    4.7	GX 5-1
270.2647 -25.8766    6.1  37.0   50.1   2.3213   1.9    8.3	GRS 1758-258
273.9934 -14.0657    1.9  25.9   60.6   4.9550   6.1    1.9	GX 17+2
275.7733 -30.3838   18.7  38.1   39.3   0.7205   0.6    7.9	H1820-303
284.8863 -24.9389   19.7  30.0   29.6   0.4304   0.6    8.2	HT1900.1-2455
288.7704  10.9288    0.7   7.8  166.3  10.3986  17.1    1.9	GRS 1915+105
299.5892  35.2026    0.3  31.7 -153.7  25.2905  33.2    0.1	Cyg X-1
308.0686  40.9977    2.1  39.4 -146.1   5.9052   5.6    3.3	Cyg X-3
326.3189  38.4300    0.0  46.0 -127.4   2.1734   0.6    9.5	Cyg X-2
277.3568 -23.7932    2.5  31.6   42.8   4.0094   4.7 ------	UNKNOWN
266.9074  20.3081    2.7  29.8  140.4   3.6974   4.3 ------	UNKNOWN
261.6930  49.2225    2.3  52.2  170.3  10.0334   4.9 ------	UNKNOWN
290.1034  -3.3755    2.4   7.9   34.1   2.6800   4.9 ------	UNKNOWN
307.5034   0.4943    2.7  15.3  -61.3   2.5023   4.2 ------	UNKNOWN
315.5469 -12.9513    3.7  28.4  -37.4   1.9524   3.1 ------	UNKNOWN
323.7427 -11.1717    2.9  34.5  -48.0   3.6743   3.9 ------	UNKNOWN
325.4218  43.8638    3.0  49.1 -133.5  11.9296   3.9 ------	UNKNOWN