Analysis Summary
Notes:
- 1) No attempt has been made to eliminate the non-significant decimal places.
- 2) This batgrbproduct analysis is done using the HEASARC data.
- 3) This batgrbproduct analysis is using the flight position for the mask-weighting calculation.
======================================================================
BAT GRB EVENT DATA PROCESSING REPORT
Process Script Ver: batgrbproduct v2.46
Process Start Time: Sun May 17 23:59:36 EDT 2015
Host Name: bat1
Current Working Dir: /local/data/bat1/alien/Swift_3rdBATcatalog/event/batevent_reproc/trigger639433
======================================================================
Trigger: 00639433 Segment: 000
BAT Trigger Time: 452046088.768 [s; MET]
Trigger Stop: 452046090.816 [s; MET]
UTC: 2015-04-30T00:21:15.254160 [includes UTCF correction]
Where From?: TDRSS position message
BAT
RA: 326.490552682698 Dec: -27.9275457785092 [deg; J2000]
Catalogged Source?: NO
Point Source?: YES
GRB Indicated?: YES [ by BAT flight software ]
Image S/N Ratio: 7.21
Image Trigger?: NO
Rate S/N Ratio: 53.619026473818 [ if not an image trigger ]
Image S/N Ratio: 7.21
Analysis Position: [ source = BAT ]
RA: 326.490552682698 Dec: -27.9275457785092 [deg; J2000]
Refined Position: [ source = BAT pre-slew burst ]
RA: 326.478336224977 Dec: -27.9157234611205 [deg; J2000]
{ 21h 45m 54.8s , -27d 54' 56.6" }
+/- 1.53276330908951 [arcmin] (estimated 90% radius based on SNR)
+/- 0.635985090250733 [arcmin] (formal 1-sigma fit error)
SNR: 16.5254752244778
Angular difference between the analysis and refined position is 0.960534 arcmin
Partial Coding Fraction: 0.05761719 [ including projection effects ]
Duration
T90: 106.879999995232 +/- 7.02755263860171
Measured from: -8.02399998903275
to: 98.8560000061989 [s; relative to TRIGTIME]
T50: 45.6000000238419 +/- 12.1512600658553
Measured from: 0.0400000214576721
to: 45.6400000452995 [s; relative to TRIGTIME]
Fluence
Peak Flux (peak 1 second)
Measured from: 0.972000002861023
to: 1.97200000286102 [s; relative to TRIGTIME]
Total Fluence
Measured from: -10.9359999895096
to: 108.695999979973 [s; relative to TRIGTIME]
Band 1 Band 2 Band 3 Band 4
15-25 25-50 50-100 100-350 keV
Total 2.038652 3.303377 3.218708 0.971239
0.206399 0.222208 0.204792 0.170343 [error]
Peak 0.147112 0.161659 0.256416 0.068977
0.030220 0.039259 0.041162 0.029845 [error]
[ fluence units of on-axis counts / fully illuminated detector ]
======================================================================
====== Table of the duration information =============================
Value tstart tstop
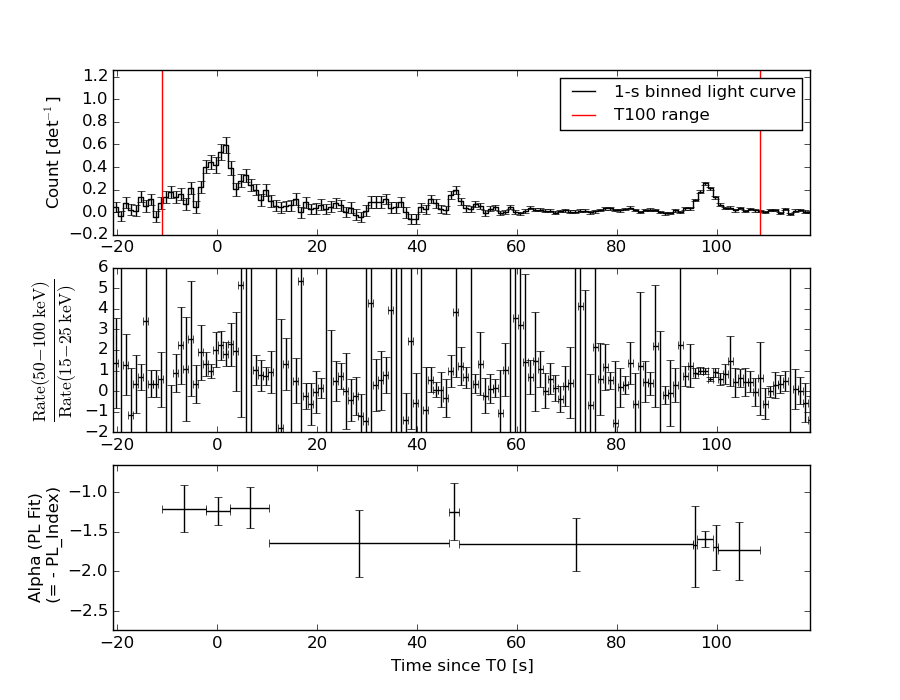
T100 119.632 -10.936 108.696
T90 106.880 -8.024 98.856
T50 45.600 0.040 45.640
Peak 1.000 0.972 1.972
====== Spectral Analysis Summary =====================================
Model : spectral model: simple power-law (PL) and cutoff power-law (CPL)
Ph_index : photon index: E^{Ph_index}
Ph_90err : 90% error of the photon index
Epeak : Epeak in keV
Epeak_90err: 90% error of Epeak
Norm : normalization at 50 keV in both the PL model and CPL model
Nomr_90err : 90% error of the normalization
chi2 : Chi-Squared
dof : degree of freedo
=== Time-averaged spectral analysis ===
(Best model with acceptable fit: PL)
Model Ph_index Ph_90err_low Ph_90err_hi Epeak Epeak_90err_low Epeak_90err_hi Norm Nomr_90err_low Norm_90err_hi chi2 dof
PL -1.366 -0.117 0.118 - - - 5.78e-03 -3.95e-04 3.95e-04 48.090 57
CPL -1.035 -0.384 0.508 158.704 -65.316 -158.704 8.28e-03 -2.74e-03 5.83e-03 46.580 56
=== 1-s peak spectral analysis ===
(Best model with acceptable fit: PL)
Model Ph_index Ph_90err_low Ph_90err_hi Epeak Epeak_90err_low Epeak_90err_hi Norm Nomr_90err_low Norm_90err_hi chi2 dof
PL -1.181 -0.326 0.327 - - - 4.23e-02 -8.25e-03 8.23e-03 54.760 57
CPL -0.935 0.935 1.712 262.386 -262.386 -262.386 5.42e-02 -1.95e-02 2.14e-01 54.660 56
=== Fluence/Peak Flux Summary ===
Model Band1 Band2 Band3 Band4 Band5 Total
15-25 25-50 50-100 100-350 15-150 15-350 keV
Fluence PL 7.79e-07 1.55e-06 2.41e-06 8.22e-06 6.73e-06 1.30e-05 erg/cm2
90%_error_low -9.74e-08 -1.20e-07 -1.98e-07 -1.39e-06 -4.93e-07 -1.53e-06 erg/cm2
90%_error_hi 1.01e-07 1.20e-07 1.97e-07 1.57e-06 4.95e-07 1.67e-06 erg/cm2
Peak flux PL 1.28e+00 1.56e+00 1.38e+00 2.09e+00 4.96e+00 6.32e+00 ph/cm2/s
90%_error_low -4.49e-01 -3.69e-01 -3.01e-01 -8.21e-01 -1.00e+00 -1.26e+00 ph/cm2/s
90%_error_hi 5.08e-01 3.59e-01 2.94e-01 1.05e+00 1.01e+00 1.29e+00 ph/cm2/s
Fluence CPL 7.26e-07 1.60e-06 2.49e-06 5.31e-06 6.62e-06 1.01e-05 erg/cm2
90%_error_low -1.20e-07 -1.36e-07 -2.28e-07 -2.29e-06 -5.22e-07 -2.31e-06 erg/cm2
90%_error_hi 1.23e-07 1.39e-07 2.33e-07 3.40e-06 5.19e-07 3.48e-06 erg/cm2
Peak flux CPL 1.20e+00 1.59e+00 1.43e+00 1.70e+00 4.93e+00 5.92e+00 ph/cm2/s
90%_error_low -6.13e-01 -1.98e-01 -3.46e-01 -1.70e+00 -1.02e+00 -1.65e+00 ph/cm2/s
90%_error_hi 5.75e-01 3.99e-01 4.36e-01 1.38e+00 1.02e+00 1.65e+00 ph/cm2/s
======================================================================
Image
Pre-slew 15.0-350.0 keV image (Event data)
#   RAcent    DECcent   POSerr    Theta     Phi              Peak Cts       SNR   Name
  326.4783   -27.9157   0.0117    48.8758    38.1536         7.2190216     16.525 TRIG_00639433

Foreground time interval of the image:
-10.936  31.133 (delta_t =  42.069 [sec])
Background time interval of the image:
-239.768 -10.936 (delta_t = 228.832 [sec])
Light Curves
Note: The mask-weighted lightcurves have units of either count/det or counts/sec/det, where a det is 0.4 x 0.4 = 0.16 sq cm.
Full-time range; 1 s binning
Other quick-look light curves:
- 64 ms binning (zoomed)
- 16 ms binning (zoomed)
- 8 ms binning (zoomed)
- 2 ms binning (zoomed)
- SN=5 or 10 s binning (full-time range)
- Raw light curve
Spectra
- 64 ms binning (zoomed)
- 16 ms binning (zoomed)
- 8 ms binning (zoomed)
- 2 ms binning (zoomed)
- SN=5 or 10 s binning (full-time range)
- Raw light curve
Spectra
Notes:
- 1) The fitting includes the systematic errors.
- 2) When the burst includes telescope slew time periods, the fitting uses an average response file made from multiple 5-s response files through out the slew time plus single time preiod for the non-slew times, and weighted by the total counts in the corresponding time period using addrmf. An average response file is needed becuase a spectral fit using the pre-slew DRM will introduce some errors in both a spectral shape and a normalization if the PHA file contains a lot of the slew/post-slew time interval.
- 3) For fits to more complicated models (e.g. a power-law over a cutoff power-law), the BAT team has decided to require a chi-square improvement of more than 6 for each extra dof.
Time averaged spectrum fit using the average DRM
Power-law model

Time interval is from  -10.936 sec. to  108.696 sec.

Spectral model in power-law:
------------------------------------------------------------
Parameters  : value       lower 90%   higher 90%
Photon index: -1.36624     ( -0.117355   0.117736 )
Norm@50keV  : 5.77871E-03    ( -0.000394839   0.000394813 )
------------------------------------------------------------
#Fit statistic : Chi-Squared =          48.09 using 59 PHA bins.
# Reduced chi-squared =         0.8436 for     57 degrees of freedom
# Null hypothesis probability =   7.937390e-01

Photon flux (15-150 keV)    in 119.6 sec: 0.698547 ( -0.050368  0.050487 ) ph/cm2/s
Energy fluence (15-150 keV)             : 6.72684e-06 ( -4.93067e-07  4.94887e-07 ) ergs/cm2
Cutoff power-law model
Time interval is from  -10.936 sec. to  108.696 sec.
Spectral model in the cutoff power-law:
------------------------------------------------------------
Parameters  : value       lower 90%   higher 90%
Photon index: -1.03462     ( -0.384326   0.507761 )
Epeak [keV] : 158.704      ( -65.3168 -158.705 )
Norm@50keV  : 8.28267E-03    ( -0.00273645   0.00582929 )
------------------------------------------------------------
#Fit statistic : Chi-Squared =          46.58 using 59 PHA bins.
# Reduced chi-squared =         0.8318 for     56 degrees of freedom
# Null hypothesis probability =   8.110386e-01

Photon flux (15-150 keV)    in 119.6 sec: 0.688590 ( -0.052228  0.052278 ) ph/cm2/s
Energy fluence (15-150 keV)             : 6.62066e-06 ( -5.21766e-07  5.18894e-07 ) ergs/cm2
1-s peak spectrum fit
Power-law model
Time interval is from    0.972 sec. to    1.972 sec.

Spectral model in power-law:
------------------------------------------------------------
Parameters  : value       lower 90%   higher 90%
Photon index: -1.18062     ( -0.325579   0.326713 )
Norm@50keV  : 4.23487E-02    ( -0.00824776   0.0082347 )
------------------------------------------------------------
#Fit statistic : Chi-Squared =          54.76 using 59 PHA bins.
# Reduced chi-squared =         0.9607 for     57 degrees of freedom
# Null hypothesis probability =   5.596512e-01

Photon flux (15-150 keV)    in 1 sec: 4.95775 ( -1.00173  1.00524 ) ph/cm2/s
Energy fluence (15-150 keV)             : 4.32076e-07 ( -8.99863e-08  9.00676e-08 ) ergs/cm2
Cutoff power-law model

Time interval is from    0.972 sec. to    1.972 sec.
Spectral model in the cutoff power-law:
------------------------------------------------------------
Parameters  : value       lower 90%   higher 90%
Photon index: -0.934864     ( 0.934725   1.71219 )
Epeak [keV] : 262.386      ( -262.263 -262.263 )
Norm@50keV  : 5.41692E-02    ( -0.019479   0.213941 )
------------------------------------------------------------
#Fit statistic : Chi-Squared =          54.66 using 59 PHA bins.
# Reduced chi-squared =         0.9761 for     56 degrees of freedom
# Null hypothesis probability =   5.255375e-01

Photon flux (15-150 keV)    in 1 sec: 4.92759 ( -1.01959  1.01521 ) ph/cm2/s
Energy fluence (15-150 keV)             : 9.078e-08 ( 0  0 ) ergs/cm2
Time-resolved spectra
Distribution
T90 vs. Hardness ratio plot
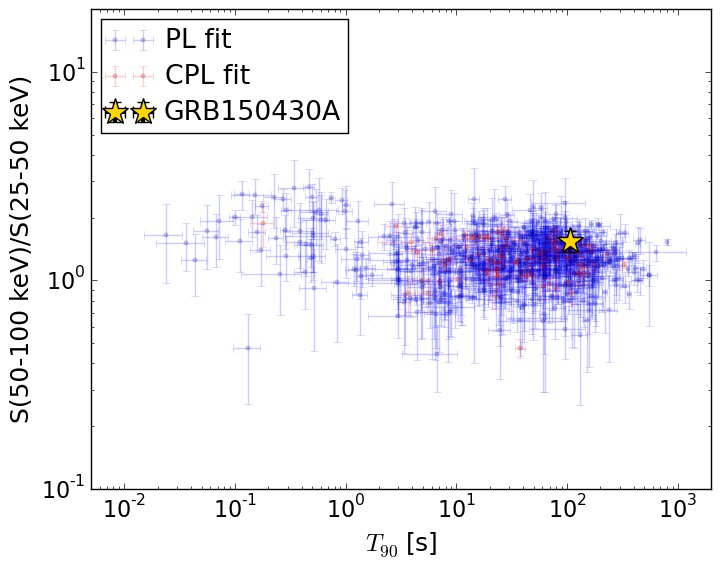
T90                                   = 106.88 sec.
Hardness ratio (energy fluence ratio) = 1.55163646855
S(15-50 keV) vs. S(50-150 keV) plot
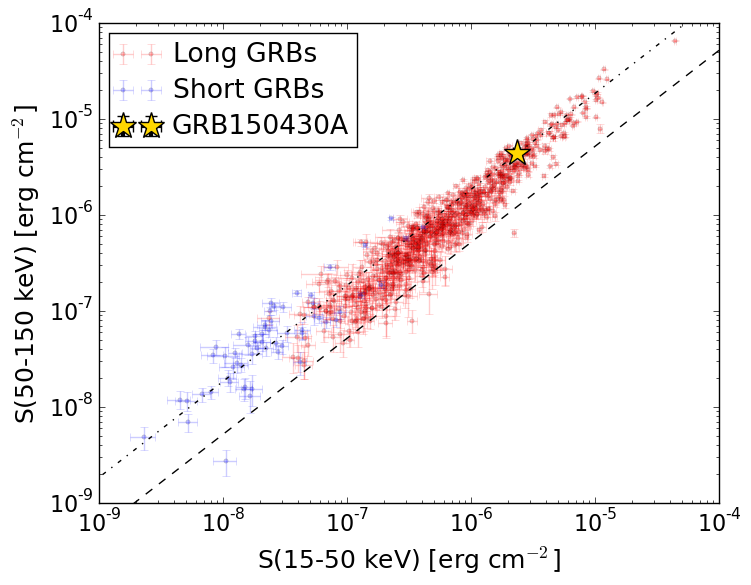
S(15-50 keV)  = 2.3314861e-06
S(50-150 keV) = 4.39534e-06
The dash-dotted line and the dashed line traces the fluences calculated from the Band function with Epeak = 15 and 150 keV, respectively. Both lines assume a canonical values of alpha = -1 and beta = -2.5.
Mask shadow pattern
IMX = 9.006498952128774E-01, IMY = -7.075603182957515E-01
Spacecraft aspect plot
Bright source in the pre-burst/pre-slew/post-slew images
Pre-burst image of 15-350 keV band
Time interval of the image:
-239.768000 -10.936000

# RAcent  DECcent POSerr Theta    Phi  PeakCts   SNR AngSep     Name
#  [deg]    [deg]    ['] [deg]  [deg]                   [']
299.5670  35.2016    1.9  45.4  137.6   2.8098   6.2    1.1	Cyg X-1
308.0676  41.0024    7.6  40.8  148.6   0.3908   1.5    3.6	Cyg X-3
326.2844  38.3513    4.1  27.7  159.0   0.3685   2.8    5.6	Cyg X-2
312.3315  32.3779    2.6  34.4  137.5   0.8922   4.5 ------	UNKNOWN
332.7587  73.4968    2.4  57.1 -170.1   2.5164   4.9 ------	UNKNOWN
 18.5989  10.3660    3.0  31.9  -67.8   0.6452   3.9 ------	UNKNOWN
Pre-slew background subtracted image of 15-350 keV band
Time interval of the image:
-10.936000 31.132590

# RAcent  DECcent POSerr Theta    Phi  PeakCts   SNR AngSep     Name
#  [deg]    [deg]    ['] [deg]  [deg]                   [']
299.6438  35.2380    3.1  45.4  137.6   1.1054   3.7    3.4	Cyg X-1
308.0013  41.0585   14.9  40.9  148.7   0.1460   0.8    8.0	Cyg X-3
326.0504  38.3268    5.8  27.9  158.6   0.1939   2.0    5.7	Cyg X-2
326.4783 -27.9158    0.8  48.9   38.2   7.2203  14.8 ------	UNKNOWN
343.9069  46.0484    2.2  29.2 -169.2   0.4386   5.2 ------	UNKNOWN
 29.6265  28.2099    2.6  41.2  -99.2   1.4793   4.5 ------	UNKNOWN
Post-slew image of 15-350 keV band
Time interval of the image:
95.532590 738.232590

# RAcent  DECcent POSerr Theta    Phi  PeakCts   SNR AngSep     Name
#  [deg]    [deg]    ['] [deg]  [deg]                   [']
285.1222 -24.9441   10.8  37.0  107.3   1.2024   1.1    4.9	HT1900.1-2455
302.3072 -61.9364    2.5  37.6   40.9   3.4307   4.6 ------	UNKNOWN
300.9310  10.4151    3.5  45.6  166.0   3.1518   3.3 ------	UNKNOWN
324.7028  30.7729    4.8  58.7 -159.3   7.8761   2.4 ------	UNKNOWN