Analysis Summary
Notes:
- 1) No attempt has been made to eliminate the non-significant decimal places.
- 2) This batgrbproduct analysis is done using the HEASARC data.
- 3) This batgrbproduct analysis is using the flight position for the mask-weighting calculation.
======================================================================
                  BAT GRB EVENT DATA PROCESSING REPORT
    Process Script Ver: batgrbproduct v2.46
    Process Start Time: Sun May 31 23:04:25 EDT 2015
             Host Name: bat1
   Current Working Dir: /local/data/bat1/alien/Swift_3rdBATcatalog/event/batevent_reproc/trigger640584
======================================================================

  Trigger: 00640584      Segment: 000

  BAT Trigger Time: 453241893.312   [s; MET]
      Trigger Stop: 453241895.36   [s; MET]
               UTC: 2015-05-13T20:31:19.736540    [includes UTCF correction]
       Where From?: TDRSS position message

  BAT
    RA: 49.0579234177396   Dec: -22.9128777277239  [deg; J2000]

     Catalogged Source?: NO
     Point Source?:      YES
     GRB Indicated?:     YES    [ by BAT flight software ]
     Image S/N Ratio:    7.43
     Image Trigger?:     NO
     Rate S/N Ratio:     14.247806848775  [ if not an image trigger ]
     Image S/N Ratio:    7.43

  Analysis Position:   [ source = BAT ]
    RA: 49.0579234177396   Dec: -22.9128777277239  [deg; J2000]

  Refined Position:   [ source = BAT pre-slew burst ]
    RA: 49.0443769914099   Dec: -22.8674867335901  [deg; J2000]
        { 03h 16m 10.7s , -22d 52' 03.0" }
         +/- 0.948822040551798 [arcmin] (estimated 90% radius based on SNR)
         +/- 0.347052834189802 [arcmin] (formal 1-sigma fit error)
    SNR: 32.7877468665144

  Angular difference between the analysis and refined position is 2.824518 arcmin

  Partial Coding Fraction: 0.640625    [ including projection effects ]

  Duration
     T90: 161.563999950886 +/- 4.78045349248968
        Measured from: -42.5239999890327
                   to: 119.039999961853     [s; relative to TRIGTIME]
     T50: 91.9599999189377 +/- 4.75432434088139
        Measured from: -20.8359999656677
                   to: 71.12399995327     [s; relative to TRIGTIME]


  Fluence
     Peak Flux  (peak 1 second)
        Measured from: 115.412000000477
                   to: 116.412000000477     [s; relative to TRIGTIME]
     Total Fluence
        Measured from: -54.3319999575615
                   to: 129.360000014305     [s; relative to TRIGTIME]

             Band 1     Band 2     Band 3     Band 4
              15-25      25-50     50-100    100-350     keV
 Total     1.760649   2.896547   2.610847   0.757879
           0.101620   0.106555   0.093728   0.078441 [error]
 Peak      0.089566   0.118015   0.112426   0.029228
           0.009024   0.010249   0.009346   0.006850 [error]

     [ fluence units of on-axis counts / fully illuminated detector ]

======================================================================


====== Table of the duration information =============================

        Value   tstart    tstop
T100  183.692  -54.332  129.360
T90   161.564  -42.524  119.040
T50    91.960  -20.836   71.124
Peak    1.000  115.412  116.412


====== Spectral Analysis Summary =====================================

Model      : spectral model: simple power-law (PL) and cutoff power-law (CPL)
Ph_index   : photon index: E^{Ph_index}
Ph_90err   : 90% error of the photon index
Epeak      : Epeak in keV
Epeak_90err: 90% error of Epeak
Norm       : normalization at 50 keV in both the PL model and CPL model
Nomr_90err : 90% error of the normalization
chi2       : Chi-Squared
dof        : degree of freedo

=== Time-averaged spectral analysis ===
(Best model with acceptable fit: PL)

Model Ph_index Ph_90err_low Ph_90err_hi  Epeak  Epeak_90err_low  Epeak_90err_hi  Norm       Nomr_90err_low    Norm_90err_hi    chi2    dof
PL      -1.310    -0.072      0.072       -           -               -         3.12e-03     -1.23e-04          1.23e-04      62.320   57
CPL     -1.228    -0.116      0.273      513.193    -513.193      -513.193      3.40e-03     -3.73e-04          1.09e-03      62.040   56


=== 1-s peak spectral analysis ===
(Best model with acceptable fit: PL)

Model Ph_index Ph_90err_low Ph_90err_hi  Epeak  Epeak_90err_low  Epeak_90err_hi  Norm       Nomr_90err_low    Norm_90err_hi    chi2    dof
PL      -1.403     -0.152     0.151       -           -               -         2.40e-02     -2.07e-03          2.07e-03      57.450   57
CPL     -1.399     -0.153     0.543     9997.110    -9997.110      -9997.110      2.41e-02     -2.41e-02          1.90e-02      57.460   56


=== Fluence/Peak Flux Summary ===

              Model    Band1     Band2     Band3     Band4     Band5     Total
                       15-25     25-50    50-100    100-350    15-150    15-350    keV
Fluence         PL   6.12e-07  1.26e-06  2.04e-06  7.36e-06  5.64e-06  1.13e-05   erg/cm2
      90%_error_low -4.86e-08 -5.97e-08 -9.38e-08 -7.49e-07 -2.35e-07 -8.01e-07   erg/cm2
      90%_error_hi   4.99e-08  5.94e-08  9.34e-08  8.08e-07  2.36e-07  8.49e-07   erg/cm2
Peak flux       PL   8.98e-01  9.58e-01  7.25e-01  8.92e-01  2.92e+00  3.47e+00   ph/cm2/s
      90%_error_low -1.38e-01 -9.20e-02 -7.69e-02 -1.84e-01 -2.58e-01 -3.03e-01   ph/cm2/s
      90%_error_hi   1.44e-01  9.10e-02  7.60e-02  2.10e-01  2.58e-01  3.05e-01   ph/cm2/s

Fluence        CPL   6.00e-07  1.27e-06  2.05e-06  6.57e-06  5.62e-06  1.05e-05   erg/cm2
      90%_error_low -6.03e-08 -6.35e-08 -9.76e-08 -1.96e-06 -2.50e-07 -1.95e-06   erg/cm2
      90%_error_hi   5.46e-08  6.44e-08  1.08e-07  1.14e-06  2.49e-07  1.06e-06   erg/cm2
Peak flux      CPL   7.07e-01  4.41e-01  1.85e-01  1.38e-01  1.39e+00  1.45e+00   ph/cm2/s
      90%_error_low -1.93e-01 -1.17e-01 -8.06e-02 2.13e-02 -3.82e-01 -3.99e-01   ph/cm2/s
      90%_error_hi   2.05e-01  1.85e-01  1.11e-01  1.43e-01  4.11e-01  4.90e-01   ph/cm2/s

======================================================================
Image
Pre-slew 15.0-350.0 keV image (Event data)
#   RAcent    DECcent   POSerr    Theta     Phi              Peak Cts       SNR   Name
   49.0444   -22.8675   0.0059    35.2236   -28.5428         8.8075330     32.788 TRIG_00640584

Foreground time interval of the image:
-54.332 129.360 (delta_t = 183.692 [sec])
Background time interval of the image:
-239.312 -54.332 (delta_t = 184.980 [sec])
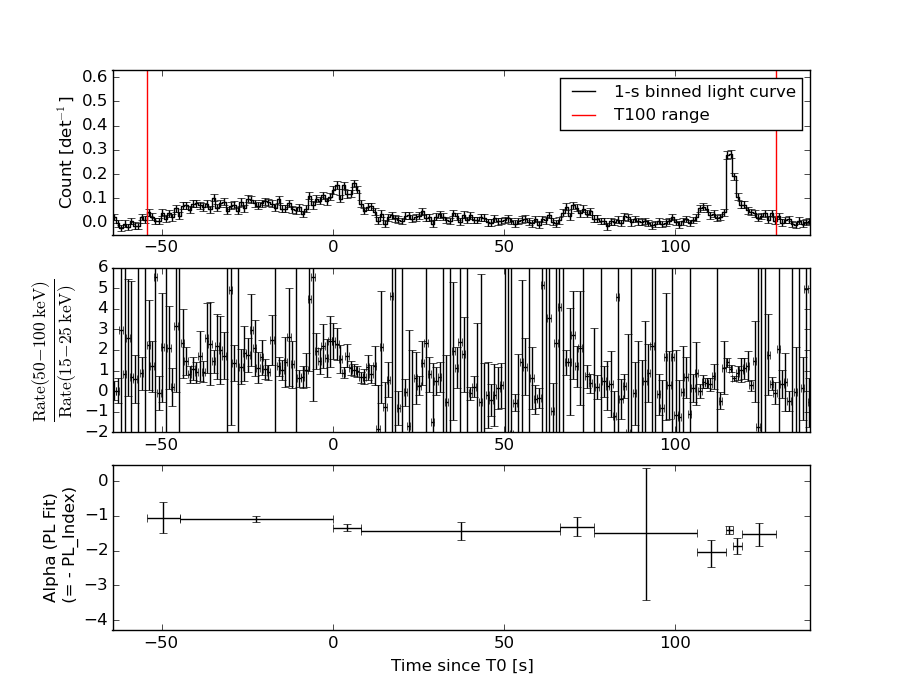
Light Curves
Note: The mask-weighted lightcurves have units of either count/det or counts/sec/det, where a det is 0.4 x 0.4 = 0.16 sq cm.
Full-time range; 1 s binning
Other quick-look light curves:
- 64 ms binning (zoomed)
- 16 ms binning (zoomed)
- 8 ms binning (zoomed)
- 2 ms binning (zoomed)
- SN=5 or 10 s binning (full-time range)
- Raw light curve
Spectra
- 64 ms binning (zoomed)
- 16 ms binning (zoomed)
- 8 ms binning (zoomed)
- 2 ms binning (zoomed)
- SN=5 or 10 s binning (full-time range)
- Raw light curve
Spectra
Notes:
- 1) The fitting includes the systematic errors.
- 2) When the burst includes telescope slew time periods, the fitting uses an average response file made from multiple 5-s response files through out the slew time plus single time preiod for the non-slew times, and weighted by the total counts in the corresponding time period using addrmf. An average response file is needed becuase a spectral fit using the pre-slew DRM will introduce some errors in both a spectral shape and a normalization if the PHA file contains a lot of the slew/post-slew time interval.
- 3) For fits to more complicated models (e.g. a power-law over a cutoff power-law), the BAT team has decided to require a chi-square improvement of more than 6 for each extra dof.
Time averaged spectrum fit using the average DRM
Power-law model
Time interval is from  -54.332 sec. to  129.360 sec.

Spectral model in power-law:
------------------------------------------------------------
Parameters  : value       lower 90%   higher 90%
Photon index: -1.31043     ( -0.0717267   0.0722043 )
Norm@50keV  : 3.11592E-03    ( -0.000122922   0.000122868 )
------------------------------------------------------------
#Fit statistic : Chi-Squared =          62.32 using 59 PHA bins.
# Reduced chi-squared =          1.093 for     57 degrees of freedom
# Null hypothesis probability =   2.927247e-01

Photon flux (15-150 keV)    in 183.7 sec: 0.372465 ( -0.015885  0.015927 ) ph/cm2/s
Energy fluence (15-150 keV)             : 5.64273e-06 ( -2.35448e-07  2.35941e-07 ) ergs/cm2
Cutoff power-law model
Time interval is from  -54.332 sec. to  129.360 sec.
Spectral model in the cutoff power-law:
------------------------------------------------------------
Parameters  : value       lower 90%   higher 90%
Photon index: -1.22811     ( -0.115652   0.27356 )
Epeak [keV] : 513.193      ( -527.58 -527.58 )
Norm@50keV  : 3.39785E-03    ( -0.000371201   0.00108847 )
------------------------------------------------------------
#Fit statistic : Chi-Squared =          62.04 using 59 PHA bins.
# Reduced chi-squared =          1.108 for     56 degrees of freedom
# Null hypothesis probability =   2.695750e-01

Photon flux (15-150 keV)    in 183.7 sec: 0.370745 ( -0.016753  0.016779 ) ph/cm2/s
Energy fluence (15-150 keV)             : 5.6172e-06 ( -2.49856e-07  2.48629e-07 ) ergs/cm2
1-s peak spectrum fit
Power-law model
Time interval is from  115.412 sec. to  116.412 sec.

Spectral model in power-law:
------------------------------------------------------------
Parameters  : value       lower 90%   higher 90%
Photon index: -1.40251     ( -0.15162   0.150916 )
Norm@50keV  : 2.39681E-02    ( -0.00207304   0.00206545 )
------------------------------------------------------------
#Fit statistic : Chi-Squared =          57.45 using 59 PHA bins.
# Reduced chi-squared =          1.008 for     57 degrees of freedom
# Null hypothesis probability =   4.582925e-01

Photon flux (15-150 keV)    in 1 sec: 2.92059 ( -0.2576  0.2581 ) ph/cm2/s
Energy fluence (15-150 keV)             : 2.31505e-07 ( -2.20021e-08  2.2148e-08 ) ergs/cm2
Cutoff power-law model

Time interval is from  115.412 sec. to  116.412 sec.
Spectral model in the cutoff power-law:
------------------------------------------------------------
Parameters  : value       lower 90%   higher 90%
Photon index: -1.3989     ( -0.152555   0.54293 )
Epeak [keV] : 9997.11      ( -9998.84 -9998.84 )
Norm@50keV  : 2.40601E-02    ( -0.0240551   0.0189607 )
------------------------------------------------------------
#Fit statistic : Chi-Squared =          57.46 using 59 PHA bins.
# Reduced chi-squared =          1.026 for     56 degrees of freedom
# Null hypothesis probability =   4.210435e-01

Photon flux (15-150 keV)    in 1 sec: 1.39063 ( -0.3817  0.4108 ) ph/cm2/s
Energy fluence (15-150 keV)             : 2.32012e-07 ( 0  0 ) ergs/cm2
Time-resolved spectra
Distribution
T90 vs. Hardness ratio plot
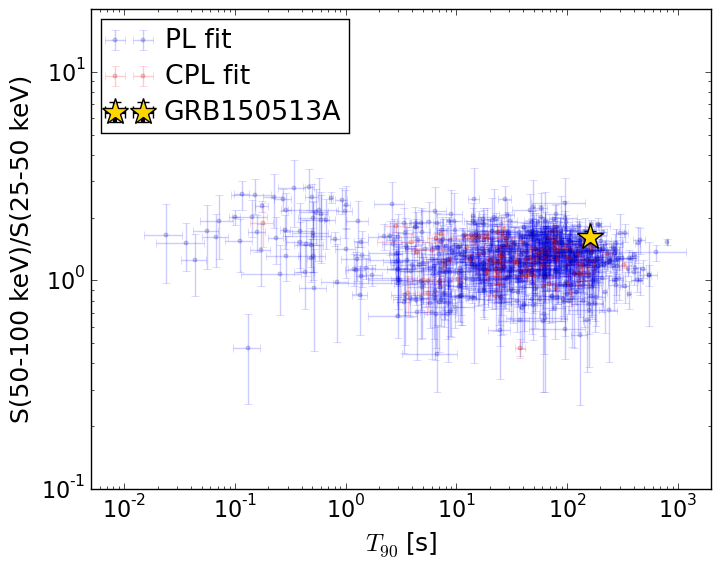
T90                                   = 161.564 sec.
Hardness ratio (energy fluence ratio) = 1.61283471647
S(15-50 keV) vs. S(50-150 keV) plot
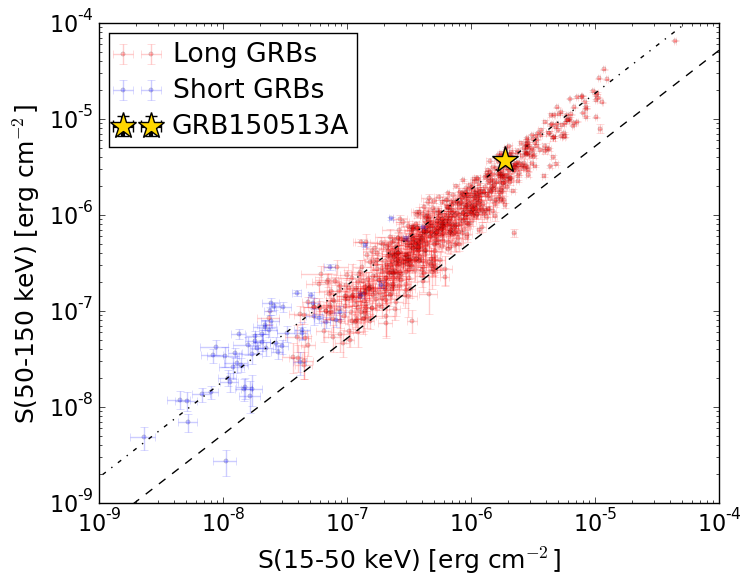
S(15-50 keV)  = 1.8754034e-06
S(50-150 keV) = 3.76732e-06
The dash-dotted line and the dashed line traces the fluences calculated from the Band function with Epeak = 15 and 150 keV, respectively. Both lines assume a canonical values of alpha = -1 and beta = -2.5.
Mask shadow pattern
IMX = 6.202286225659043E-01, IMY = 3.373561259981325E-01
Spacecraft aspect plot
Bright source in the pre-burst/pre-slew/post-slew images
Pre-burst image of 15-350 keV band
Time interval of the image:
-239.312000 -54.332000

# RAcent  DECcent POSerr Theta    Phi  PeakCts   SNR AngSep     Name
#  [deg]    [deg]    ['] [deg]  [deg]                   [']
327.6067  11.4625    2.6  54.1  177.0   3.0105   4.5 ------	UNKNOWN
333.0673   6.7252    2.8  46.9  176.6   1.5368   4.2 ------	UNKNOWN
327.7788  13.4759    2.8  55.3  179.1   3.4430   4.2 ------	UNKNOWN
 25.0866   4.8044    3.1  30.4  -98.1   0.9299   3.7 ------	UNKNOWN
  5.7670  26.7342    2.0  49.2 -133.0   4.4198   5.8 ------	UNKNOWN
Pre-slew background subtracted image of 15-350 keV band
Time interval of the image:
-54.332000 129.360000

# RAcent  DECcent POSerr Theta    Phi  PeakCts   SNR AngSep     Name
#  [deg]    [deg]    ['] [deg]  [deg]                   [']
 49.6879 -45.2244    1.9  39.1    8.4   1.8282   5.9 ------	UNKNOWN
 49.0444 -22.8675    0.4  35.2  -28.5   8.8063  32.8 ------	UNKNOWN
 44.6623  -9.3088    2.4  34.9  -53.4   1.5269   4.7 ------	UNKNOWN
Post-slew image of 15-350 keV band
Time interval of the image:
381.188600 627.888590

# RAcent  DECcent POSerr Theta    Phi  PeakCts   SNR AngSep     Name
#  [deg]    [deg]    ['] [deg]  [deg]                   [']
 83.6563  21.9976    1.0  45.8  -57.8  11.5051  11.3    1.6	Crab
 78.9809 -70.0285    2.7  47.6  139.1   3.8036   4.3 ------	UNKNOWN
 24.7996 -39.4041    2.9  58.4 -170.1   4.7608   4.0 ------	UNKNOWN
121.3130  29.1695    2.8  59.4  -17.2   6.2964   4.1 ------	UNKNOWN