Analysis Summary
Notes:
- 1) No attempt has been made to eliminate the non-significant decimal places.
- 2) This batgrbproduct analysis is done using the HEASARC data.
- 3) This batgrbproduct analysis is using the flight position for the mask-weighting calculation.
======================================================================
BAT GRB EVENT DATA PROCESSING REPORT
Process Script Ver: batgrbproduct v2.46
Process Start Time: Fri Jun 26 00:18:20 EDT 2015
Host Name: bat1
Current Working Dir: /local/data/bat1/alien/Swift_3rdBATcatalog/event/batevent_reproc/trigger642018
======================================================================
Trigger: 00642018 Segment: 000
BAT Trigger Time: 454678951.872 [s; MET]
Trigger Stop: 454678952.896 [s; MET]
UTC: 2015-05-30T11:42:18.222320 [includes UTCF correction]
Where From?: TDRSS position message
BAT
RA: 327.523415997874 Dec: 57.4904208320749 [deg; J2000]
Catalogged Source?: NO
Point Source?: YES
GRB Indicated?: YES [ by BAT flight software ]
Image S/N Ratio: 9.11
Image Trigger?: NO
Rate S/N Ratio: 23.7697286480094 [ if not an image trigger ]
Image S/N Ratio: 9.11
Analysis Position: [ source = BAT ]
RA: 327.523415997874 Dec: 57.4904208320749 [deg; J2000]
Refined Position: [ source = BAT pre-slew burst ]
RA: 327.511672646044 Dec: 57.5186072495788 [deg; J2000]
{ 21h 50m 02.8s , +57d 31' 07.0" }
+/- 1.20346359197235 [arcmin] (estimated 90% radius based on SNR)
+/- 0.401392262154241 [arcmin] (formal 1-sigma fit error)
SNR: 23.3460900749071
Angular difference between the analysis and refined position is 1.733031 arcmin
Partial Coding Fraction: 0.1757812 [ including projection effects ]
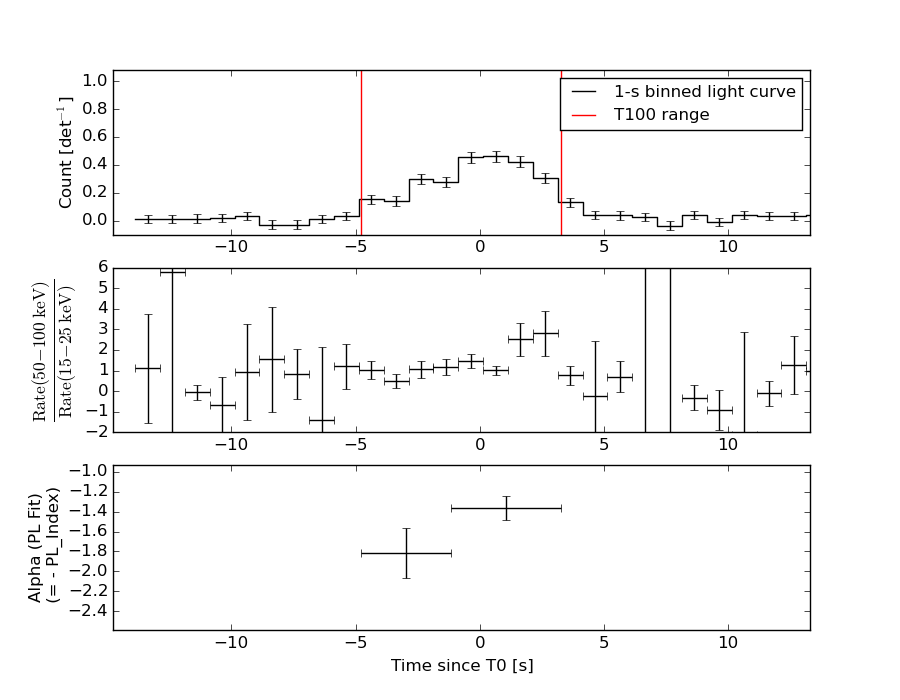
Duration
T90: 6.89600002765656 +/- 0.817253912009944
Measured from: -3.95199996232986
to: 2.94400006532669 [s; relative to TRIGTIME]
T50: 3.0560000538826 +/- 0.572433362789055
Measured from: -1.61599999666214
to: 1.44000005722046 [s; relative to TRIGTIME]
Fluence
Peak Flux (peak 1 second)
Measured from: 0.467999994754791
to: 1.46799999475479 [s; relative to TRIGTIME]
Total Fluence
Measured from: -4.783999979496
to: 3.28000003099442 [s; relative to TRIGTIME]
Band 1 Band 2 Band 3 Band 4
15-25 25-50 50-100 100-350 keV
Total 0.612667 0.896375 0.842826 0.239208
0.052958 0.058947 0.051920 0.039808 [error]
Peak 0.095462 0.155519 0.154298 0.078120
0.018679 0.022651 0.020814 0.015981 [error]
[ fluence units of on-axis counts / fully illuminated detector ]
======================================================================
====== Table of the duration information =============================
Value tstart tstop
T100 8.064 -4.784 3.280
T90 6.896 -3.952 2.944
T50 3.056 -1.616 1.440
Peak 1.000 0.468 1.468
====== Spectral Analysis Summary =====================================
Model : spectral model: simple power-law (PL) and cutoff power-law (CPL)
Ph_index : photon index: E^{Ph_index}
Ph_90err : 90% error of the photon index
Epeak : Epeak in keV
Epeak_90err: 90% error of Epeak
Norm : normalization at 50 keV in both the PL model and CPL model
Nomr_90err : 90% error of the normalization
chi2 : Chi-Squared
dof : degree of freedo
=== Time-averaged spectral analysis ===
(Best model with acceptable fit: PL)
Model Ph_index Ph_90err_low Ph_90err_hi Epeak Epeak_90err_low Epeak_90err_hi Norm Nomr_90err_low Norm_90err_hi chi2 dof
PL -1.488 -0.113 0.113 - - - 2.31e-02 -1.54e-03 1.54e-03 69.790 57
CPL -1.109 -0.417 0.471 128.415 -45.438 -128.415 3.48e-02 -1.23e-02 2.23e-02 67.510 56
=== 1-s peak spectral analysis ===
(Best model with acceptable fit: PL)
Model Ph_index Ph_90err_low Ph_90err_hi Epeak Epeak_90err_low Epeak_90err_hi Norm Nomr_90err_low Norm_90err_hi chi2 dof
PL -1.237 -0.231 0.237 - - - 3.45e-02 -4.65e-03 4.64e-03 43.490 57
CPL -1.229 -0.235 0.235 9998.890 -9998.890 -9998.890 3.46e-02 -3.46e-02 2.99e-02 43.500 56
=== Fluence/Peak Flux Summary ===
Model Band1 Band2 Band3 Band4 Band5 Total
15-25 25-50 50-100 100-350 15-150 15-350 keV
Fluence PL 2.35e-07 4.35e-07 6.21e-07 1.87e-06 1.77e-06 3.16e-06 erg/cm2
90%_error_low -2.77e-08 -3.21e-08 -5.03e-08 -3.07e-07 -1.25e-07 -3.46e-07 erg/cm2
90%_error_hi 2.88e-08 3.19e-08 5.00e-08 3.44e-07 1.25e-07 3.73e-07 erg/cm2
Peak flux PL 1.10e+00 1.30e+00 1.10e+00 1.59e+00 4.07e+00 5.09e+00 ph/cm2/s
90%_error_low -2.85e-01 -2.17e-01 -1.65e-01 -4.53e-01 -5.81e-01 -6.93e-01 ph/cm2/s
90%_error_hi 3.09e-01 2.11e-01 1.63e-01 5.51e-01 5.82e-01 6.98e-01 ph/cm2/s
Fluence CPL 2.17e-07 4.50e-07 6.46e-07 1.16e-06 1.74e-06 2.48e-06 erg/cm2
90%_error_low -3.40e-08 -3.63e-08 -5.82e-08 -4.60e-07 -1.30e-07 -4.70e-07 erg/cm2
90%_error_hi 3.48e-08 3.71e-08 5.94e-08 7.53e-07 1.29e-07 8.15e-07 erg/cm2
Peak flux CPL 1.12e+00 1.30e+00 1.10e+00 1.70e+00 4.09e+00 5.11e+00 ph/cm2/s
90%_error_low N/A -2.20e-01 -1.61e-01 -1.70e+00 -6.41e-01 -9.39e-01 ph/cm2/s
90%_error_hi N/A 2.10e-01 1.75e-01 9.98e-01 6.32e-01 6.68e-01 ph/cm2/s
======================================================================
Image
Pre-slew 15.0-350.0 keV image (Event data)
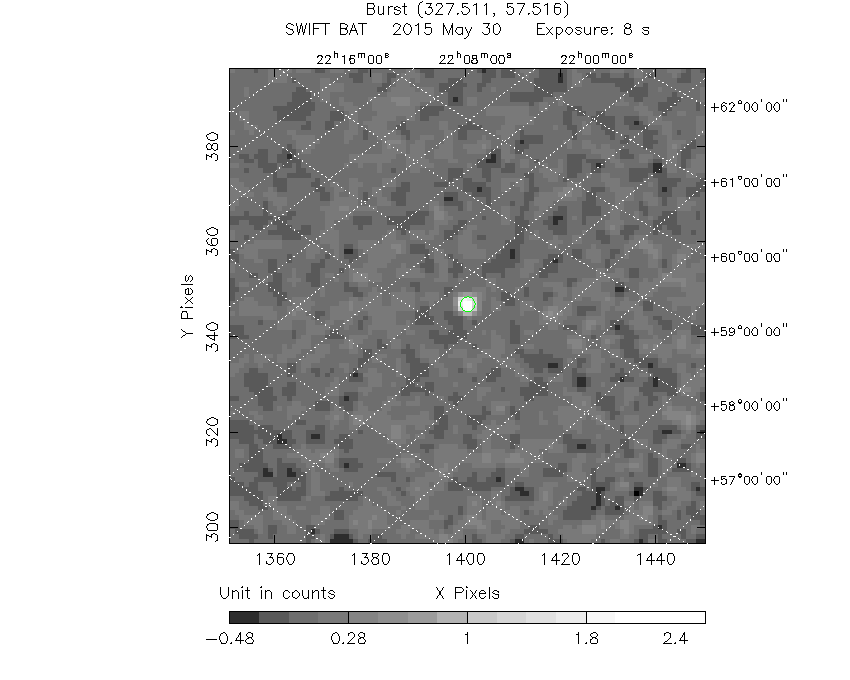
#   RAcent    DECcent   POSerr    Theta     Phi              Peak Cts       SNR   Name
  327.5117    57.5186   0.0083    48.4398   166.0101         2.8673145     23.346 TRIG_00642018

Foreground time interval of the image:
 -4.784   3.280 (delta_t =   8.064 [sec])
Background time interval of the image:
-646.671 -629.213 (delta_t =  17.459 [sec])
-239.872  -4.784 (delta_t = 235.088 [sec])
Light Curves
Note: The mask-weighted lightcurves have units of either count/det or counts/sec/det, where a det is 0.4 x 0.4 = 0.16 sq cm.
Full-time range; 1 s binning
Other quick-look light curves:
- 64 ms binning (zoomed)
- 16 ms binning (zoomed)
- 8 ms binning (zoomed)
- 2 ms binning (zoomed)
- SN=5 or 10 s binning (full-time range)
- Raw light curve
Spectra
- 64 ms binning (zoomed)
- 16 ms binning (zoomed)
- 8 ms binning (zoomed)
- 2 ms binning (zoomed)
- SN=5 or 10 s binning (full-time range)
- Raw light curve
Spectra
Notes:
- 1) The fitting includes the systematic errors.
- 2) When the burst includes telescope slew time periods, the fitting uses an average response file made from multiple 5-s response files through out the slew time plus single time preiod for the non-slew times, and weighted by the total counts in the corresponding time period using addrmf. An average response file is needed becuase a spectral fit using the pre-slew DRM will introduce some errors in both a spectral shape and a normalization if the PHA file contains a lot of the slew/post-slew time interval.
- 3) For fits to more complicated models (e.g. a power-law over a cutoff power-law), the BAT team has decided to require a chi-square improvement of more than 6 for each extra dof.
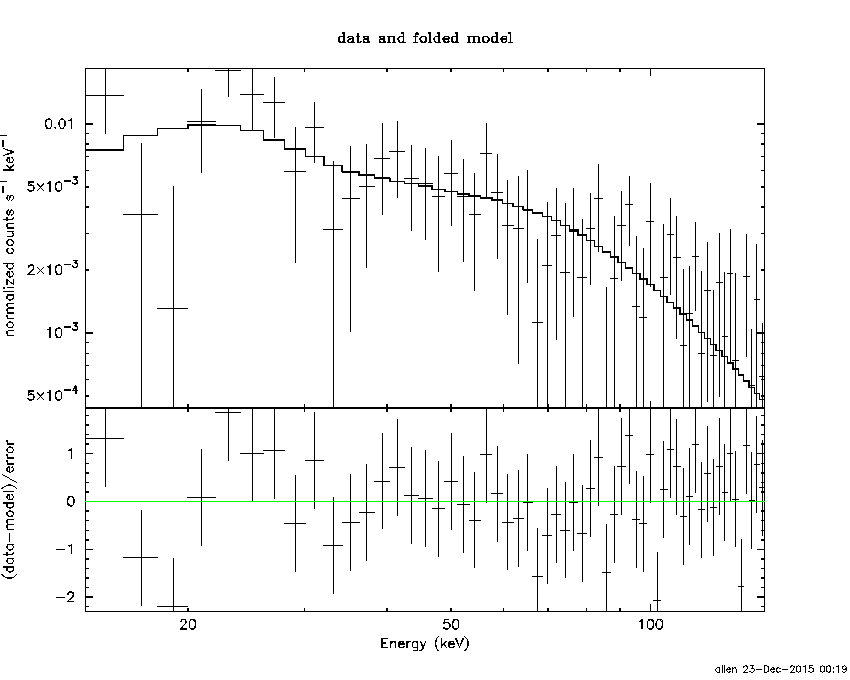
Time averaged spectrum fit using the average DRM
Power-law model
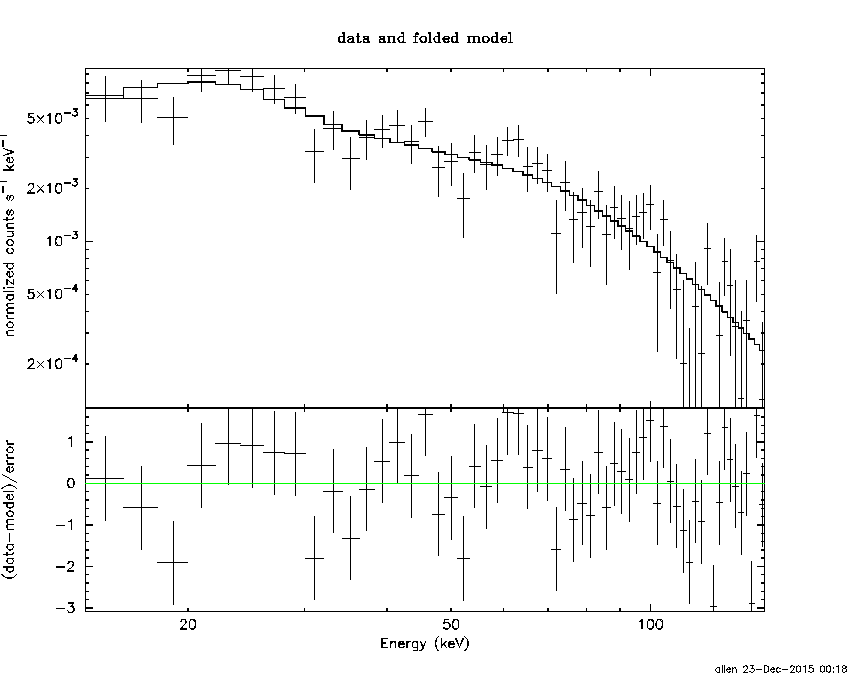
Time interval is from   -4.784 sec. to    3.280 sec.

Spectral model in power-law:
------------------------------------------------------------
Parameters  : value       lower 90%   higher 90%
Photon index: -1.48821     ( -0.112855   0.112611 )
Norm@50keV  : 2.30904E-02    ( -0.00153737   0.00153632 )
------------------------------------------------------------
#Fit statistic : Chi-Squared =          69.79 using 59 PHA bins.
# Reduced chi-squared =          1.224 for     57 degrees of freedom
# Null hypothesis probability =   1.190037e-01

Photon flux (15-150 keV)    in 8.064 sec: 2.87362 ( -0.20316  0.20369 ) ph/cm2/s
Energy fluence (15-150 keV)             : 1.77007e-06 ( -1.246e-07  1.24977e-07 ) ergs/cm2
Cutoff power-law model
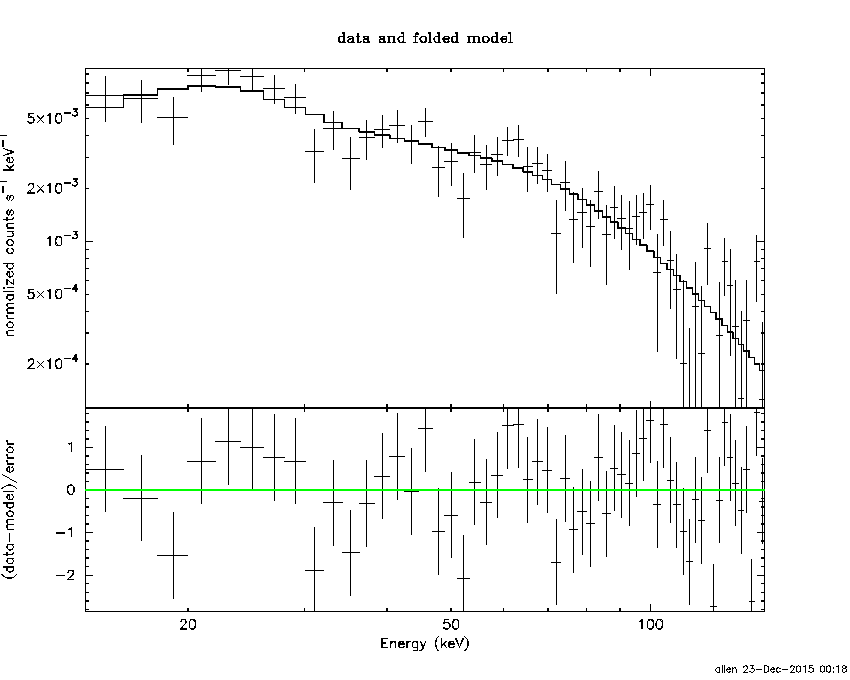
Time interval is from   -4.784 sec. to    3.280 sec.
Spectral model in the cutoff power-law:
------------------------------------------------------------
Parameters  : value       lower 90%   higher 90%
Photon index: -1.10945     ( -0.417446   0.471439 )
Epeak [keV] : 128.415      ( -45.4376 -128.415 )
Norm@50keV  : 3.48431E-02    ( -0.012308   0.02228 )
------------------------------------------------------------
#Fit statistic : Chi-Squared =          67.51 using 59 PHA bins.
# Reduced chi-squared =          1.206 for     56 degrees of freedom
# Null hypothesis probability =   1.394467e-01

Photon flux (15-150 keV)    in 8.064 sec: 2.82580 ( -0.2102  0.21063 ) ph/cm2/s
Energy fluence (15-150 keV)             : 1.74369e-06 ( -1.29557e-07  1.29274e-07 ) ergs/cm2
1-s peak spectrum fit
Power-law model
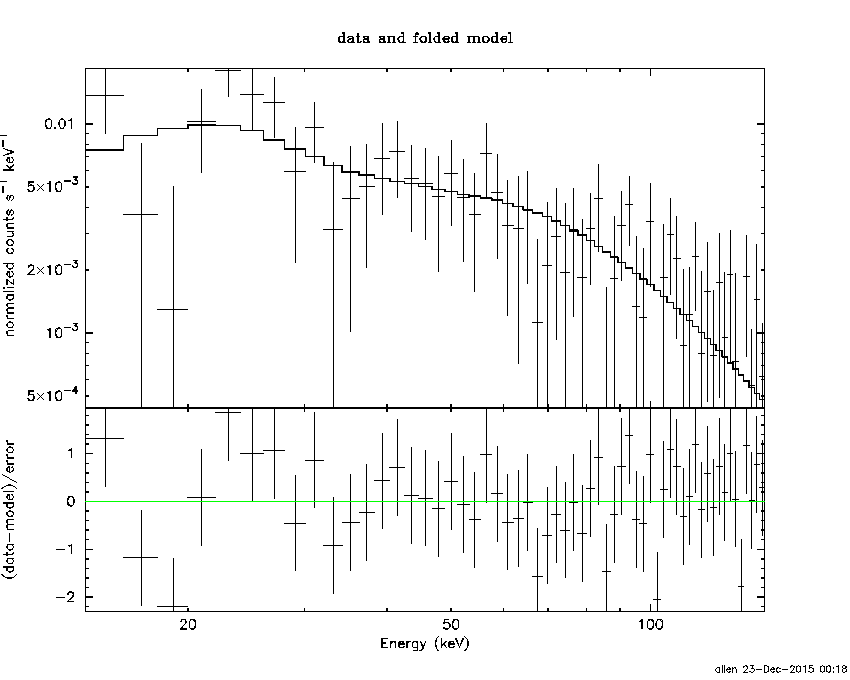
Time interval is from    0.468 sec. to    1.468 sec.

Spectral model in power-law:
------------------------------------------------------------
Parameters  : value       lower 90%   higher 90%
Photon index: -1.23742     ( -0.230639   0.236577 )
Norm@50keV  : 3.45116E-02    ( -0.00464527   0.00463735 )
------------------------------------------------------------
#Fit statistic : Chi-Squared =          43.49 using 59 PHA bins.
# Reduced chi-squared =         0.7630 for     57 degrees of freedom
# Null hypothesis probability =   9.062566e-01

Photon flux (15-150 keV)    in 1 sec: 4.07362 ( -0.58054  0.58217 ) ph/cm2/s
Energy fluence (15-150 keV)             : 3.46585e-07 ( -4.92541e-08  4.93647e-08 ) ergs/cm2
Cutoff power-law model
Time interval is from    0.468 sec. to    1.468 sec.
Spectral model in the cutoff power-law:
------------------------------------------------------------
Parameters  : value       lower 90%   higher 90%
Photon index: -1.22937     ( -0.231715   0.238654 )
Epeak [keV] : 9998.89      ( -9999.36 -9999.36 )
Norm@50keV  : 3.46024E-02    ( -0.0346706   0.029869 )
------------------------------------------------------------
#Fit statistic : Chi-Squared =          43.50 using 59 PHA bins.
# Reduced chi-squared =         0.7768 for     56 degrees of freedom
# Null hypothesis probability =   8.883861e-01

Photon flux (15-150 keV)    in 1 sec: 4.08697 ( -0.64118  0.63191 ) ph/cm2/s
Energy fluence (15-150 keV)             : 3.48257e-07 ( 0  0 ) ergs/cm2
Time-resolved spectra
Distribution
T90 vs. Hardness ratio plot

T90                                   = 6.896 sec.
Hardness ratio (energy fluence ratio) = 1.42587021443
S(15-50 keV) vs. S(50-150 keV) plot
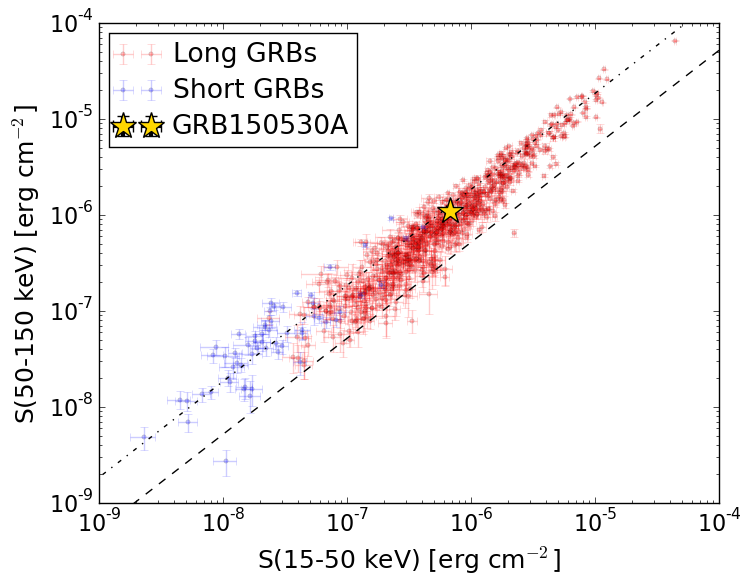
S(15-50 keV)  = 6.703593e-07
S(50-150 keV) = 1.0997264e-06
The dash-dotted line and the dashed line traces the fluences calculated from the Band function with Epeak = 15 and 150 keV, respectively. Both lines assume a canonical values of alpha = -1 and beta = -2.5.
Mask shadow pattern
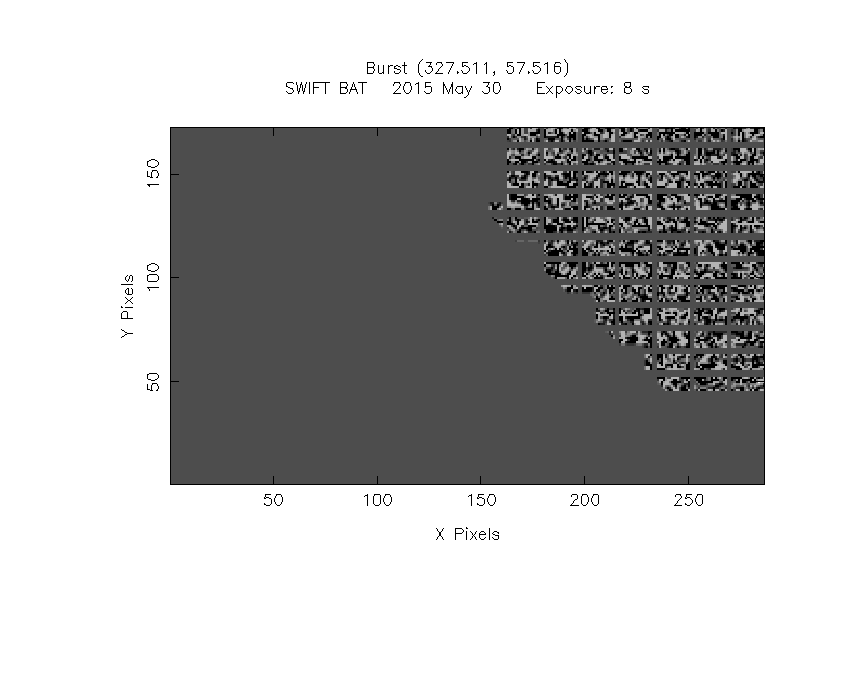
IMX = -1.094449698655726E+00, IMY = -2.726725527081504E-01
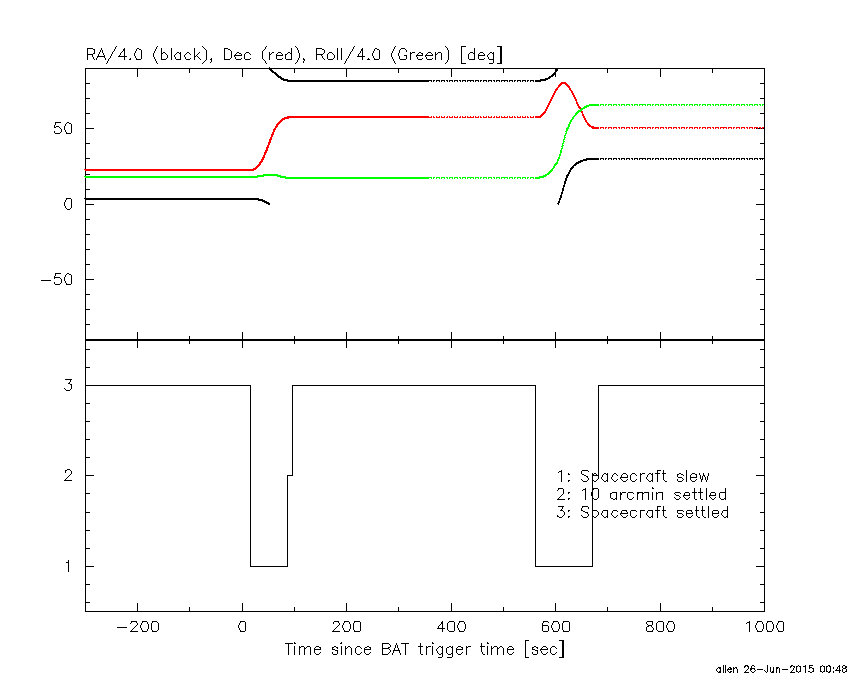
Spacecraft aspect plot
Bright source in the pre-burst/pre-slew/post-slew images
Pre-burst image of 15-350 keV band
Time interval of the image:
-646.671410 -629.212800
-239.872000 -4.784000

# RAcent  DECcent POSerr Theta    Phi  PeakCts   SNR AngSep     Name
#  [deg]    [deg]    ['] [deg]  [deg]                   [']
326.0527  38.4208    5.5  44.0  140.1   1.5224   2.1    8.2	Cyg X-2
334.8341  24.5584    2.7  36.3  118.7   2.0372   4.3 ------	UNKNOWN
330.4102  32.2947    2.2  40.0  131.4   3.3048   5.4 ------	UNKNOWN
 62.6788  61.5056    2.8  50.7 -135.0   4.5915   4.2 ------	UNKNOWN
Pre-slew background subtracted image of 15-350 keV band
Time interval of the image:
-4.784000 3.280000

# RAcent  DECcent POSerr Theta    Phi  PeakCts   SNR AngSep     Name
#  [deg]    [deg]    ['] [deg]  [deg]                   [']
326.2943  38.4061    7.8  43.9  140.1  -0.2237  -1.5    7.7	Cyg X-2
327.5117  57.5186    0.5  48.4  166.0   2.8676  23.3 ------	UNKNOWN
 35.3120  73.0442    2.5  51.6 -154.7   0.4758   4.6 ------	UNKNOWN
Post-slew image of 15-350 keV band
Time interval of the image:
86.228590 562.428600

# RAcent  DECcent POSerr Theta    Phi  PeakCts   SNR AngSep     Name
#  [deg]    [deg]    ['] [deg]  [deg]                   [']
299.5824  35.1939    0.4  29.1   72.0  17.7159  27.0    0.6	Cyg X-1
308.1259  40.9812    2.0  20.6   65.3   2.6646   5.8    1.9	Cyg X-3
326.0879  38.4443    4.0  19.1   23.4   1.1313   2.9    8.3	Cyg X-2
342.6599  39.7349    2.7  20.3  -15.5   1.5107   4.2 ------	UNKNOWN
  5.0091  50.9903    3.2  22.5  -69.6   1.7873   3.6 ------	UNKNOWN
 30.9455  67.1739    3.5  29.5 -115.2   1.6507   3.3 ------	UNKNOWN
 78.5962  65.3860    3.6  46.7 -127.8   6.5633   3.2 ------	UNKNOWN