Analysis Summary
Notes:
- 1) No attempt has been made to eliminate the non-significant decimal places.
- 2) This batgrbproduct analysis is done using the HEASARC data.
- 3) This batgrbproduct analysis is using the flight position for the mask-weighting calculation.
==========================================================================
BAT GROUND-DETECTED GRB DATA PROCESSING REPORT
(This burst occurred during telescope slew)
Process Script Ver: batgrbproduct v2.46
Process Start Time: Sun Jul 12 16:14:34 EDT 2015
Host Name: bat1
Current Working Dir: /local/data/bat1/alien/Swift_3rdBATcatalog/event/batevent_reproc/GRB150530B
======================================================================
Trigger: 00084922 Segment: 008
BAT Trigger Time: 454685332.0
UTC: 2015-05-30T13:28:38.350 [includes UTCF correction]
Where From?: Ground analysis (best_duration.txt)
NOTE: BAT trigger time for ground-detected burst during slew is the T100 start time.
Refined Position: [ source = BAT mosaic image ]
RA: 7.50912844527939 Dec: 44.2871313723644 [deg; J2000]
{ 00h 30m 02.2s , +44d 17' 13.7" }
+/- 1.96182816378 [arcmin] (estimated 90% radius based on SNR)
SNR: 11.6168425975
Angular difference between the analysis and refined position is Usage: arcmin
Partial Coding Fraction: Unavailable because the burst occurred during slew.
Duration
T90: 3. +/- 1.4142135623731
Measured from: 0
to: 3 [s; relative to TRIGTIME]
T50: 1. +/- 1.
Measured from: 1
to: 2 [s; relative to TRIGTIME]
====== Table of the duration information =============================
Value tstart tstop
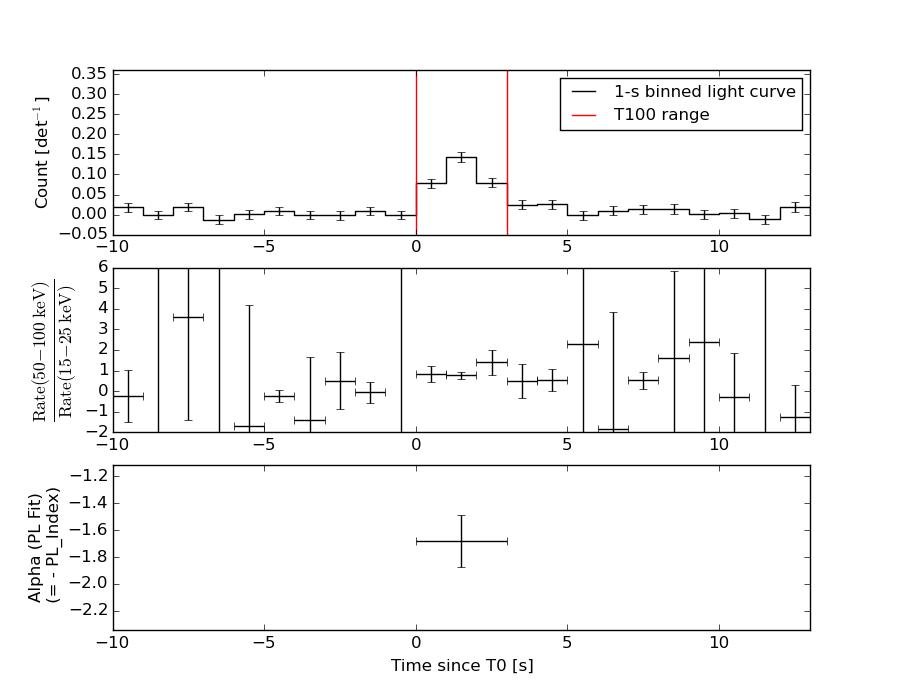
T100 3.000 0.000 3.000
T90 3.000 0.000 3.000
T50 1.000 1.000 2.000
Peak 1.000 1.000 2.000
====== Spectral Analysis Summary =====================================
Model : spectral model: simple power-law (PL) and cutoff power-law (CPL)
Ph_index : photon index: E^{Ph_index}
Ph_90err : 90% error of the photon index
Epeak : Epeak in keV
Epeak_90err: 90% error of Epeak
Norm : normalization at 50 keV in both the PL model and CPL model
Nomr_90err : 90% error of the normalization
chi2 : Chi-Squared
dof : degree of freedo
=== Time-averaged spectral analysis ===
(Best model with acceptable fit: PL)
Model Ph_index Ph_90err_low Ph_90err_hi Epeak Epeak_90err_low Epeak_90err_hi Norm Nomr_90err_low Norm_90err_hi chi2 dof
PL -1.679 -0.194 0.188 - - - 6.23e-03 -7.74e-04 7.63e-04 46.760 57
CPL -0.582 -0.907 1.137 58.584 -11.960 62.919 2.47e-02 -2.47e-02 7.73e-02 42.380 56
=== 1-s peak spectral analysis ===
(Best model with acceptable fit: PL)
Model Ph_index Ph_90err_low Ph_90err_hi Epeak Epeak_90err_low Epeak_90err_hi Norm Nomr_90err_low Norm_90err_hi chi2 dof
PL -1.803 -0.276 0.259 - - - 8.32e-03 -1.44e-03 1.39e-03 42.880 57
CPL -1.808 -0.272 0.924 9999.360 -9999.350 -9999.360 8.30e-03 -1.42e-03 2.14e-02 42.880 56
=== Fluence/Peak Flux Summary ===
Model Band1 Band2 Band3 Band4 Band5 Total
15-25 25-50 50-100 100-350 15-150 15-350 keV
Fluence PL 2.83e-08 4.65e-08 5.81e-08 1.44e-07 1.73e-07 2.77e-07 erg/cm2
90%_error_low -4.71e-09 -5.25e-09 -9.49e-09 -4.26e-08 -2.25e-08 -5.29e-08 erg/cm2
90%_error_hi 4.87e-09 5.24e-09 9.52e-09 5.28e-08 2.29e-08 6.09e-08 erg/cm2
Peak flux PL 4.58e-01 3.86e-01 2.21e-01 1.88e-01 1.15e+00 1.25e+00 ph/cm2/s
90%_error_low -9.87e-02 -5.61e-02 -4.97e-02 -7.16e-02 -1.67e-01 -1.84e-01 ph/cm2/s
90%_error_hi 1.03e-01 5.59e-02 4.94e-02 9.30e-02 1.67e-01 1.85e-01 ph/cm2/s
Fluence CPL 2.48e-08 5.29e-08 5.88e-08 3.32e-08 1.58e-07 1.70e-07 erg/cm2
90%_error_low -5.64e-09 -7.37e-09 -1.14e-08 -2.24e-08 -2.42e-08 -3.30e-08 erg/cm2
90%_error_hi 5.67e-09 7.71e-09 1.10e-08 7.25e-08 2.57e-08 7.35e-08 erg/cm2
Peak flux CPL 4.60e-01 3.52e-01 1.87e-01 1.71e-01 1.07e+00 1.17e+00 ph/cm2/s
90%_error_low -1.14e-01 -8.92e-02 -4.61e-02 -1.09e-01 -2.69e-01 -2.90e-01 ph/cm2/s
90%_error_hi 1.06e-01 7.64e-02 3.74e-02 2.58e-02 2.29e-01 2.27e-01 ph/cm2/s
======================================================================
Image
Note1: The mosaic image is made with timebin = 0.05 s; energybin = 15-350 keV
Note2: The mosaic image uses Galactic coordinate.
#RAcent DECcent POSerr Theta  Phi  Peak_Cts  SNR Name
7.509 44.287 0.006 30.199 34.569 0.083 11.617 UNKNOWN

Image time interval: 0.000 to 3.000 [sec]
Light Curves
Note: The mask-weighted lightcurves have units of either count/det or counts/sec/det, where a det is 0.4 x 0.4 = 0.16 sq cm.
Best duration plot
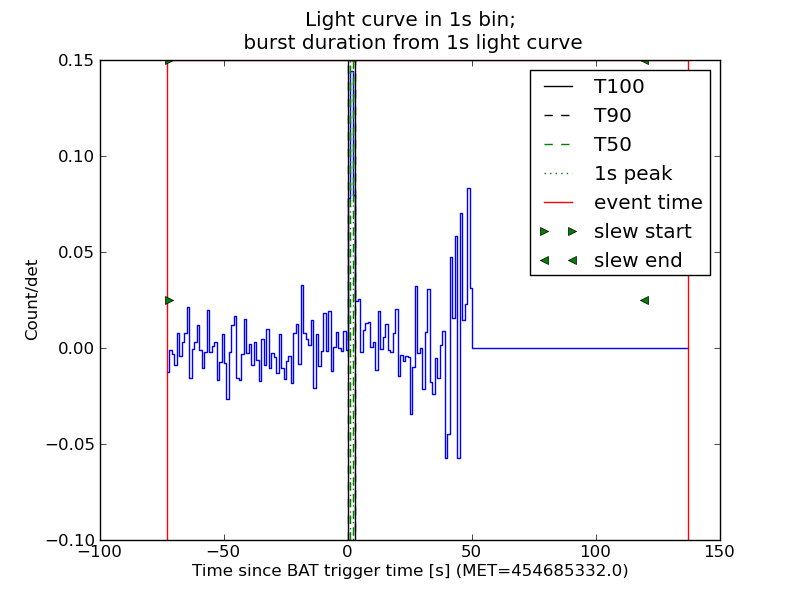
Full-time range; 1 s binning
Other quick-look light curves:
- 64 ms binning (zoomed)
- 16 ms binning (zoomed)
- 8 ms binning (zoomed)
- 2 ms binning (zoomed)
- SN=5 or 10 s binning (full-time range)
- Raw light curve
Spectra
- 64 ms binning (zoomed)
- 16 ms binning (zoomed)
- 8 ms binning (zoomed)
- 2 ms binning (zoomed)
- SN=5 or 10 s binning (full-time range)
- Raw light curve
Spectra
Notes:
- 1) The fitting includes the systematic errors.
- 2) When the burst includes telescope slew time periods, the fitting uses an average response file made from multiple 5-s response files through out the slew time plus single time preiod for the non-slew times, and weighted by the total counts in the corresponding time period using addrmf. An average response file is needed becuase a spectral fit using the pre-slew DRM will introduce some errors in both a spectral shape and a normalization if the PHA file contains a lot of the slew/post-slew time interval.
- 3) For fits to more complicated models (e.g. a power-law over a cutoff power-law), the BAT team has decided to require a chi-square improvement of more than 6 for each extra dof.
Time averaged spectrum fit using the average DRM
Power-law model
Time interval is from    0.000 sec. to    3.000 sec.

Spectral model in power-law:
------------------------------------------------------------
Parameters  : value       lower 90%   higher 90%
Photon index: -1.6795     ( -0.194341   0.187957 )
Norm@50keV  : 6.23168E-03    ( -0.000774161   0.000763209 )
------------------------------------------------------------
#Fit statistic : Chi-Squared =          46.76 using 59 PHA bins.
# Reduced chi-squared =         0.8204 for     57 degrees of freedom
# Null hypothesis probability =   8.313369e-01

Photon flux (15-150 keV)    in 3 sec: 0.821830 ( -0.092756  0.092801 ) ph/cm2/s
Energy fluence (15-150 keV)             : 1.73417e-07 ( -2.25439e-08  2.28656e-08 ) ergs/cm2
Cutoff power-law model
Time interval is from    0.000 sec. to    3.000 sec.
Spectral model in the cutoff power-law:
------------------------------------------------------------
Parameters  : value       lower 90%   higher 90%
Photon index: -0.582301     ( -0.906559   1.13657 )
Epeak [keV] : 58.5837      ( -11.9592 62.9201 )
Norm@50keV  : 2.46773E-02    ( -0.0246788   0.0772549 )
------------------------------------------------------------
#Fit statistic : Chi-Squared =          42.38 using 59 PHA bins.
# Reduced chi-squared =         0.7567 for     56 degrees of freedom
# Null hypothesis probability =   9.107068e-01

Photon flux (15-150 keV)    in 3 sec: 0.791368 ( -0.096333  0.096254 ) ph/cm2/s
Energy fluence (15-150 keV)             : 1.58461e-07 ( -2.42115e-08  2.5651e-08 ) ergs/cm2
1-s peak spectrum fit
Power-law model
Time interval is from    1.000 sec. to    2.000 sec.

Spectral model in power-law:
------------------------------------------------------------
Parameters  : value       lower 90%   higher 90%
Photon index: -1.803     ( -0.276365   0.258739 )
Norm@50keV  : 8.31688E-03    ( -0.0014391   0.00139024 )
------------------------------------------------------------
#Fit statistic : Chi-Squared =          42.88 using 59 PHA bins.
# Reduced chi-squared =         0.7522 for     57 degrees of freedom
# Null hypothesis probability =   9.173183e-01

Photon flux (15-150 keV)    in 1 sec: 1.14744 ( -0.166745  0.16681 ) ph/cm2/s
Energy fluence (15-150 keV)             : 7.65702e-08 ( -1.32226e-08  1.34604e-08 ) ergs/cm2
Cutoff power-law model
Time interval is from    1.000 sec. to    2.000 sec.
Spectral model in the cutoff power-law:
------------------------------------------------------------
Parameters  : value       lower 90%   higher 90%
Photon index: -1.80792     ( -0.27385   0.921858 )
Epeak [keV] : 9999.36      ( -9999.35 -9999.36 )
Norm@50keV  : 8.29863E-03    ( -0.00143554   0.021365 )
------------------------------------------------------------
#Fit statistic : Chi-Squared =          42.88 using 59 PHA bins.
# Reduced chi-squared =         0.7657 for     56 degrees of freedom
# Null hypothesis probability =   9.011538e-01

Photon flux (15-150 keV)    in 1 sec: 1.06727 ( -0.268744  0.22934 ) ph/cm2/s
Energy fluence (15-150 keV)             : 7.68493e-08 ( -1.49266e-08  1.10975e-08 ) ergs/cm2
Time-resolved spectra
Distribution
T90 vs. Hardness ratio plot
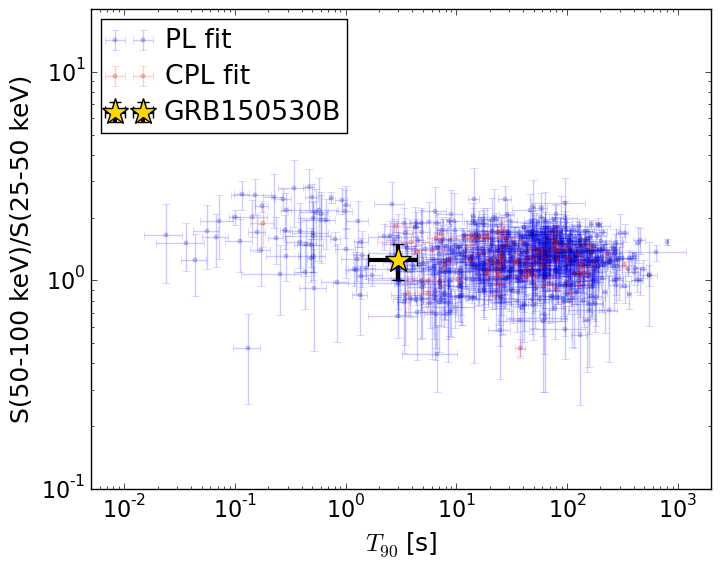
T90                                   = 3.0 sec.
Hardness ratio (energy fluence ratio) = 1.24882014209
S(15-50 keV) vs. S(50-150 keV) plot
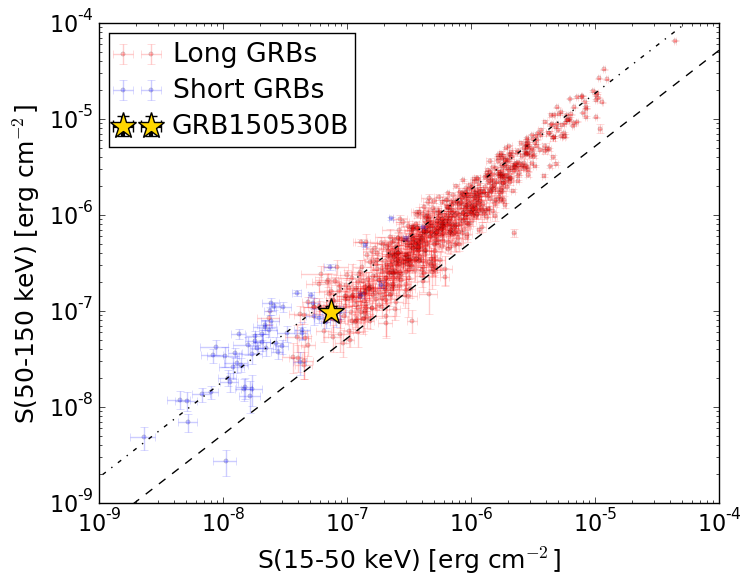
S(15-50 keV)  = 7.480173e-08
S(50-150 keV) = 9.861507e-08
The dash-dotted line and the dashed line traces the fluences calculated from the Band function with Epeak = 15 and 150 keV, respectively. Both lines assume a canonical values of alpha = -1 and beta = -2.5.
Mask shadow pattern
Mask shadow pattern unavailable because this burst occurs during telescope slews.Spacecraft aspect plot