Analysis Summary
Notes:
- 1) No attempt has been made to eliminate the non-significant decimal places.
- 2) This batgrbproduct analysis is done using the HEASARC data.
- 3) This batgrbproduct analysis is using the flight position for the mask-weighting calculation.
======================================================================
                  BAT GRB EVENT DATA PROCESSING REPORT
    Process Script Ver: batgrbproduct v2.46
    Process Start Time: Fri Jun 26 00:21:27 EDT 2015
             Host Name: bat1
   Current Working Dir: /local/data/bat1/alien/Swift_3rdBATcatalog/event/batevent_reproc/trigger642620
======================================================================

  Trigger: 00642620      Segment: 000

  BAT Trigger Time: 455356523.264   [s; MET]
      Trigger Stop: 455356523.776   [s; MET]
               UTC: 2015-06-07T07:55:09.579340    [includes UTCF correction]
       Where From?: TDRSS position message

  BAT
    RA: 140.023986719496   Dec: 68.4424007671775  [deg; J2000]

     Catalogged Source?: NO
     Point Source?:      YES
     GRB Indicated?:     YES    [ by BAT flight software ]
     Image S/N Ratio:    10.81
     Image Trigger?:     NO
     Rate S/N Ratio:     19.6214168703486  [ if not an image trigger ]
     Image S/N Ratio:    10.81

  Analysis Position:   [ source = BAT ]
    RA: 140.023986719496   Dec: 68.4424007671775  [deg; J2000]

  Refined Position:   [ source = BAT pre-slew burst ]
    RA: 140.015635737346   Dec: 68.4363205197354  [deg; J2000]
        { 09h 20m 03.8s , +68d 26' 10.8" }
         +/- 1.20425883454019 [arcmin] (estimated 90% radius based on SNR)
         +/- 0.481030501269048 [arcmin] (formal 1-sigma fit error)
    SNR: 23.3240692072097

  Angular difference between the analysis and refined position is 0.408650 arcmin

  Partial Coding Fraction: 0.3125    [ including projection effects ]

  Duration
     T90: 25.9879999756813 +/- 0.888740739111531
        Measured from: 0.199999988079071
                   to: 26.1879999637604     [s; relative to TRIGTIME]
     T50: 13.7519999742508 +/- 5.36835469047248
        Measured from: 1.85199999809265
                   to: 15.6039999723434     [s; relative to TRIGTIME]


  Fluence
     Peak Flux  (peak 1 second)
        Measured from: 7.28799998760223
                   to: 8.28799998760223     [s; relative to TRIGTIME]
     Total Fluence
        Measured from: -0.23199999332428
                   to: 27.8999999761581     [s; relative to TRIGTIME]

             Band 1     Band 2     Band 3     Band 4
              15-25      25-50     50-100    100-350     keV
 Total     0.849630   1.437389   1.034507   0.233620
           0.065227   0.069513   0.061041   0.048400 [error]
 Peak      0.136335   0.230792   0.162200   0.049348
           0.015492   0.017542   0.016009   0.010549 [error]

     [ fluence units of on-axis counts / fully illuminated detector ]

======================================================================


====== Table of the duration information =============================

        Value   tstart    tstop
T100   28.132   -0.232   27.900
T90    25.988    0.200   26.188
T50    13.752    1.852   15.604
Peak    1.000    7.288    8.288


====== Spectral Analysis Summary =====================================

Model      : spectral model: simple power-law (PL) and cutoff power-law (CPL)
Ph_index   : photon index: E^{Ph_index}
Ph_90err   : 90% error of the photon index
Epeak      : Epeak in keV
Epeak_90err: 90% error of Epeak
Norm       : normalization at 50 keV in both the PL model and CPL model
Nomr_90err : 90% error of the normalization
chi2       : Chi-Squared
dof        : degree of freedo

=== Time-averaged spectral analysis ===
(Best model with acceptable fit: CPL)

Model Ph_index Ph_90err_low Ph_90err_hi  Epeak  Epeak_90err_low  Epeak_90err_hi  Norm       Nomr_90err_low    Norm_90err_hi    chi2    dof
PL      -1.590    -0.096      0.096       -           -               -         9.06e-03     -5.23e-04          5.22e-04      50.000   57
CPL     -0.975    -0.389      0.428       84.167     -16.702        57.031      1.84e-02     -6.54e-03          1.15e-02      42.330   56


=== 1-s peak spectral analysis ===
(Best model with acceptable fit: CPL)

Model Ph_index Ph_90err_low Ph_90err_hi  Epeak  Epeak_90err_low  Epeak_90err_hi  Norm       Nomr_90err_low    Norm_90err_hi    chi2    dof
PL      -1.446     -0.137     0.137       -           -               -         3.98e-02     -3.57e-03          3.57e-03      67.500   57
CPL     -0.606     -0.558     0.649       85.188     -18.754        65.959      1.05e-01     -4.91e-02          1.14e-01      60.400   56


=== Fluence/Peak Flux Summary ===

              Model    Band1     Band2     Band3     Band4     Band5     Total
                       15-25     25-50    50-100    100-350    15-150    15-350    keV
Fluence         PL   3.54e-07  6.16e-07  8.18e-07  2.22e-06  2.39e-06  4.01e-06   erg/cm2
      90%_error_low -3.37e-08 -3.70e-08 -5.97e-08 -3.24e-07 -1.46e-07 -3.75e-07   erg/cm2
      90%_error_hi   3.47e-08  3.69e-08  5.96e-08  3.58e-07  1.46e-07  4.01e-07   erg/cm2
Peak flux       PL   1.55e+00  1.61e+00  1.19e+00  1.40e+00  4.90e+00  5.75e+00   ph/cm2/s
      90%_error_low -2.27e-01 -1.57e-01 -1.25e-01 -2.69e-01 -4.50e-01 -5.17e-01   ph/cm2/s
      90%_error_hi   2.36e-01  1.56e-01  1.24e-01  3.02e-01  4.50e-01  5.18e-01   ph/cm2/s

Fluence        CPL   3.18e-07  6.55e-07  8.53e-07  9.90e-07  2.30e-06  2.82e-06   erg/cm2
      90%_error_low -3.99e-08 -4.49e-08 -6.66e-08 -3.67e-07 -1.58e-07 -3.94e-07   erg/cm2
      90%_error_hi   4.07e-08  4.58e-08  6.75e-08  6.24e-07  1.57e-07  6.25e-07   erg/cm2
Peak flux      CPL   1.34e+00  1.76e+00  1.30e+00  6.43e-01  4.81e+00  5.05e+00   ph/cm2/s
      90%_error_low -2.63e-01 -1.90e-01 -1.50e-01 -2.66e-01 -4.54e-01 -5.28e-01   ph/cm2/s
      90%_error_hi   2.72e-01  1.96e-01  1.54e-01  4.27e-01  4.54e-01  5.78e-01   ph/cm2/s

======================================================================
Image
Pre-slew 15.0-350.0 keV image (Event data)
#   RAcent    DECcent   POSerr    Theta     Phi              Peak Cts       SNR   Name
  140.0156    68.4363   0.0082    42.4481  -137.4803         3.5595986     23.324 TRIG_00642620

Foreground time interval of the image:
 -0.232  27.900 (delta_t =  28.132 [sec])
Background time interval of the image:
-274.363 -254.674 (delta_t =  19.689 [sec])
-239.264  -0.232 (delta_t = 239.032 [sec])
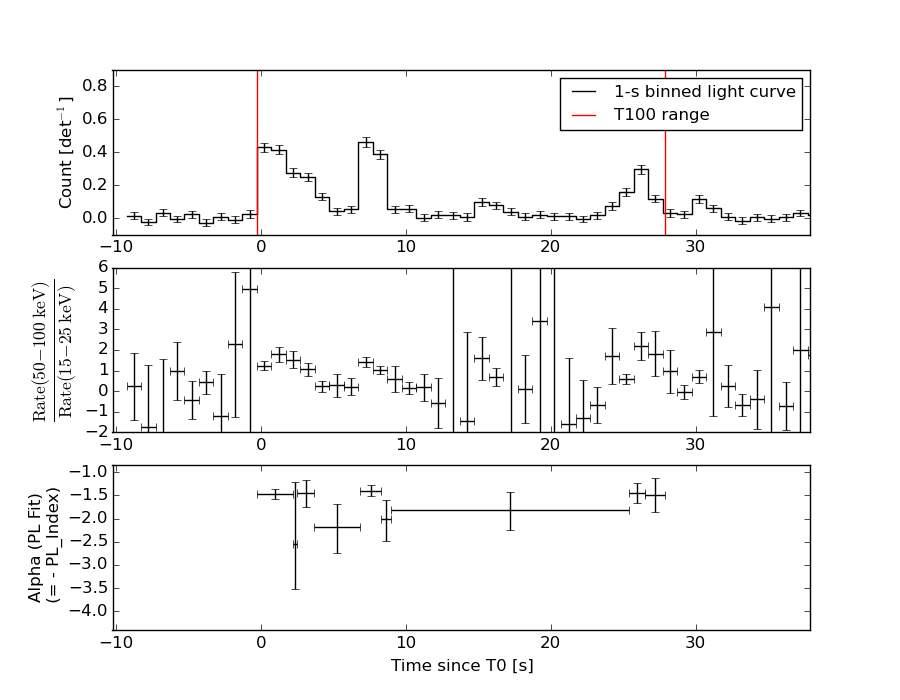
Light Curves
Note: The mask-weighted lightcurves have units of either count/det or counts/sec/det, where a det is 0.4 x 0.4 = 0.16 sq cm.
Full-time range; 1 s binning
Other quick-look light curves:
- 64 ms binning (zoomed)
- 16 ms binning (zoomed)
- 8 ms binning (zoomed)
- 2 ms binning (zoomed)
- SN=5 or 10 s binning (full-time range)
- Raw light curve
Spectra
- 64 ms binning (zoomed)
- 16 ms binning (zoomed)
- 8 ms binning (zoomed)
- 2 ms binning (zoomed)
- SN=5 or 10 s binning (full-time range)
- Raw light curve
Spectra
Notes:
- 1) The fitting includes the systematic errors.
- 2) When the burst includes telescope slew time periods, the fitting uses an average response file made from multiple 5-s response files through out the slew time plus single time preiod for the non-slew times, and weighted by the total counts in the corresponding time period using addrmf. An average response file is needed becuase a spectral fit using the pre-slew DRM will introduce some errors in both a spectral shape and a normalization if the PHA file contains a lot of the slew/post-slew time interval.
- 3) For fits to more complicated models (e.g. a power-law over a cutoff power-law), the BAT team has decided to require a chi-square improvement of more than 6 for each extra dof.
Time averaged spectrum fit using the average DRM
Power-law model
Time interval is from   -0.232 sec. to   27.900 sec.

Spectral model in power-law:
------------------------------------------------------------
Parameters  : value       lower 90%   higher 90%
Photon index: -1.59023     ( -0.096134   0.0955718 )
Norm@50keV  : 9.05656E-03    ( -0.000522785   0.000521753 )
------------------------------------------------------------
#Fit statistic : Chi-Squared =          50.00 using 59 PHA bins.
# Reduced chi-squared =         0.8773 for     57 degrees of freedom
# Null hypothesis probability =   7.326653e-01

Photon flux (15-150 keV)    in 28.13 sec: 1.16035 ( -0.06869  0.06882 ) ph/cm2/s
Energy fluence (15-150 keV)             : 2.38578e-06 ( -1.45664e-07  1.46201e-07 ) ergs/cm2
Cutoff power-law model
Time interval is from   -0.232 sec. to   27.900 sec.
Spectral model in the cutoff power-law:
------------------------------------------------------------
Parameters  : value       lower 90%   higher 90%
Photon index: -0.975244     ( -0.38916   0.428414 )
Epeak [keV] : 84.1671      ( -16.7024 57.0308 )
Norm@50keV  : 1.84289E-02    ( -0.0065413   0.0114692 )
------------------------------------------------------------
#Fit statistic : Chi-Squared =          42.33 using 59 PHA bins.
# Reduced chi-squared =         0.7559 for     56 degrees of freedom
# Null hypothesis probability =   9.115238e-01

Photon flux (15-150 keV)    in 28.13 sec: 1.12985 ( -0.07117  0.07127 ) ph/cm2/s
Energy fluence (15-150 keV)             : 2.29721e-06 ( -1.5762e-07  1.57445e-07 ) ergs/cm2
1-s peak spectrum fit
Power-law model
Time interval is from    7.288 sec. to    8.288 sec.

Spectral model in power-law:
------------------------------------------------------------
Parameters  : value       lower 90%   higher 90%
Photon index: -1.44633     ( -0.137383   0.136986 )
Norm@50keV  : 3.97561E-02    ( -0.00357117   0.0035674 )
------------------------------------------------------------
#Fit statistic : Chi-Squared =          67.50 using 59 PHA bins.
# Reduced chi-squared =          1.184 for     57 degrees of freedom
# Null hypothesis probability =   1.610714e-01

Photon flux (15-150 keV)    in 1 sec: 4.89503 ( -0.44956  0.45016 ) ph/cm2/s
Energy fluence (15-150 keV)             : 3.8075e-07 ( -3.65111e-08  3.66957e-08 ) ergs/cm2
Cutoff power-law model
Time interval is from    7.288 sec. to    8.288 sec.
Spectral model in the cutoff power-law:
------------------------------------------------------------
Parameters  : value       lower 90%   higher 90%
Photon index: -0.605589     ( -0.557659   0.649328 )
Epeak [keV] : 85.1883      ( -18.7547 65.9585 )
Norm@50keV  : 0.105180    ( -0.0490848   0.114137 )
------------------------------------------------------------
#Fit statistic : Chi-Squared =          60.40 using 59 PHA bins.
# Reduced chi-squared =          1.078 for     56 degrees of freedom
# Null hypothesis probability =   3.200449e-01

Photon flux (15-150 keV)    in 1 sec: 4.81376 ( -0.45362  0.45405 ) ph/cm2/s
Energy fluence (15-150 keV)             : 3.68137e-07 ( -3.88535e-08  3.85685e-08 ) ergs/cm2
Time-resolved spectra
Distribution
T90 vs. Hardness ratio plot
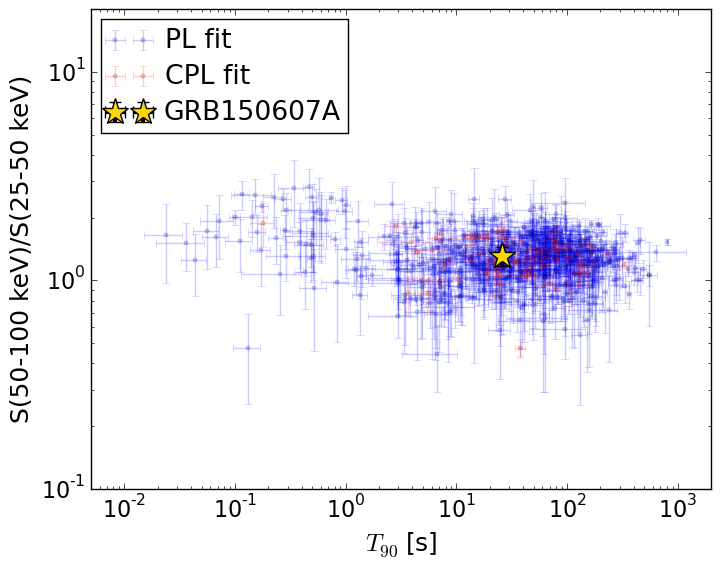
T90                                   = 25.988 sec.
Hardness ratio (energy fluence ratio) = 1.30325702559
S(15-50 keV) vs. S(50-150 keV) plot
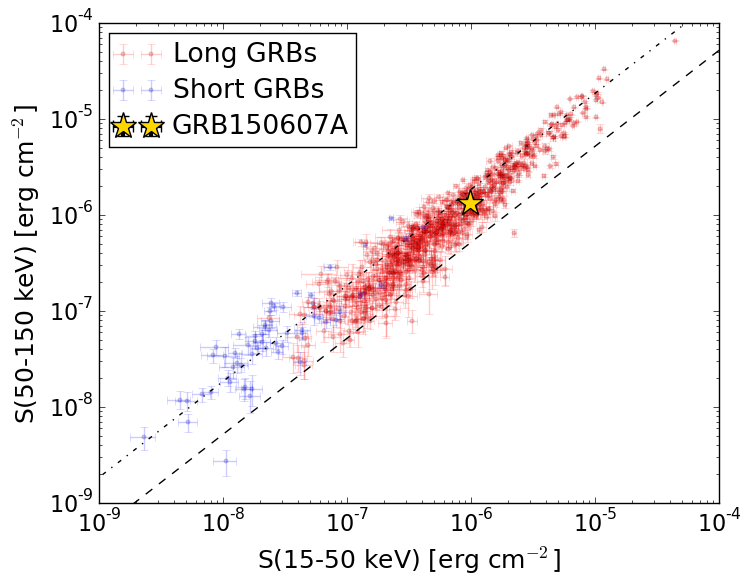
S(15-50 keV)  = 9.732015e-07
S(50-150 keV) = 1.3240034e-06
The dash-dotted line and the dashed line traces the fluences calculated from the Band function with Epeak = 15 and 150 keV, respectively. Both lines assume a canonical values of alpha = -1 and beta = -2.5.
Mask shadow pattern
IMX = -6.741509474386460E-01, IMY = 6.181711465592979E-01
Spacecraft aspect plot
Bright source in the pre-burst/pre-slew/post-slew images
Pre-burst image of 15-350 keV band
Time interval of the image:
-274.363400 -254.674000
-239.264000 -0.232000

# RAcent  DECcent POSerr Theta    Phi  PeakCts   SNR AngSep     Name
#  [deg]    [deg]    ['] [deg]  [deg]                   [']
299.5678  35.1977    1.1  34.7   66.3   6.1962  10.5    1.1	Cyg X-1
308.0759  40.9659    2.8  28.2   54.8   1.4923   4.1    1.7	Cyg X-3
326.3020  38.3620    4.0  31.5   26.7  -0.8690  -2.9    6.6	Cyg X-2
354.9459  42.4073    3.2  34.1  -14.5   0.9026   3.6 ------	UNKNOWN
112.0931  64.7779    3.3  45.3 -121.3   3.6728   3.6 ------	UNKNOWN
Pre-slew background subtracted image of 15-350 keV band
Time interval of the image:
-0.232000 27.900000

# RAcent  DECcent POSerr Theta    Phi  PeakCts   SNR AngSep     Name
#  [deg]    [deg]    ['] [deg]  [deg]                   [']
299.5181  35.0764    4.1  34.9   66.3   0.4096   2.8    8.3	Cyg X-1
308.0987  41.0640   54.1  28.1   54.8  -0.0197  -0.2    6.7	Cyg X-3
325.9753  38.3001   12.6  31.5   27.2  -0.0875  -0.9    9.3	Cyg X-2
217.5797  52.9454    2.1  43.7  165.9   0.7165   5.4 ------	UNKNOWN
330.2000  42.3321    1.7  28.1   19.3   0.4893   6.8 ------	UNKNOWN
343.3502  46.0514    2.3  27.4   -2.5   0.3590   4.9 ------	UNKNOWN
133.6330  77.2013    2.6  33.8 -134.0   0.4321   4.4 ------	UNKNOWN
140.0156  68.4363    0.5  42.4 -137.5   3.5593  23.3 ------	UNKNOWN
Post-slew image of 15-350 keV band
Time interval of the image:
117.436610 962.871300

# RAcent  DECcent POSerr Theta    Phi  PeakCts   SNR AngSep     Name
#  [deg]    [deg]    ['] [deg]  [deg]                   [']
168.8504  71.0678    3.2  10.2   77.1   1.7400   3.6 ------	UNKNOWN
159.5897  37.2710    3.0  33.0  165.8   2.8450   3.9 ------	UNKNOWN
124.4548  23.2925    3.2  46.2 -144.9   4.3825   3.6 ------	UNKNOWN
 13.8520  45.9745    3.4  58.8  -25.9  11.1596   3.4 ------	UNKNOWN
 71.5320  45.1270    3.3  41.1  -73.2   7.1524   3.5 ------	UNKNOWN