Analysis Summary
Notes:
- 1) No attempt has been made to eliminate the non-significant decimal places.
- 2) This batgrbproduct analysis is done using the HEASARC data.
- 3) This batgrbproduct analysis is using the flight position for the mask-weighting calculation.
======================================================================
BAT GRB EVENT DATA PROCESSING REPORT
Process Script Ver: batgrbproduct v2.46
Process Start Time: Fri Jul 10 23:58:17 EDT 2015
Host Name: bat1
Current Working Dir: /local/data/bat1/alien/Swift_3rdBATcatalog/event/batevent_reproc/trigger643833
======================================================================
Trigger: 00643833 Segment: 000
BAT Trigger Time: 456036160.768 [s; MET]
Trigger Stop: 456036168.96 [s; MET]
UTC: 2015-06-15T04:42:27.048040 [includes UTCF correction]
Where From?: TDRSS position message
BAT
RA: 107.570242386832 Dec: -22.471915183491 [deg; J2000]
Catalogged Source?: NO
Point Source?: YES
GRB Indicated?: YES [ by BAT flight software ]
Image S/N Ratio: 10.52
Image Trigger?: NO
Rate S/N Ratio: 14.142135623731 [ if not an image trigger ]
Image S/N Ratio: 10.52
Analysis Position: [ source = BAT ]
RA: 107.570242386832 Dec: -22.471915183491 [deg; J2000]
Refined Position: [ source = BAT pre-slew burst ]
RA: 107.544771652447 Dec: -22.4681600613637 [deg; J2000]
{ 07h 10m 10.7s , -22d 28' 05.4" }
+/- 1.83988874689869 [arcmin] (estimated 90% radius based on SNR)
+/- 0.934000086233514 [arcmin] (formal 1-sigma fit error)
SNR: 12.7304782220261
Angular difference between the analysis and refined position is 1.430079 arcmin
Partial Coding Fraction: 0.8515625 [ including projection effects ]
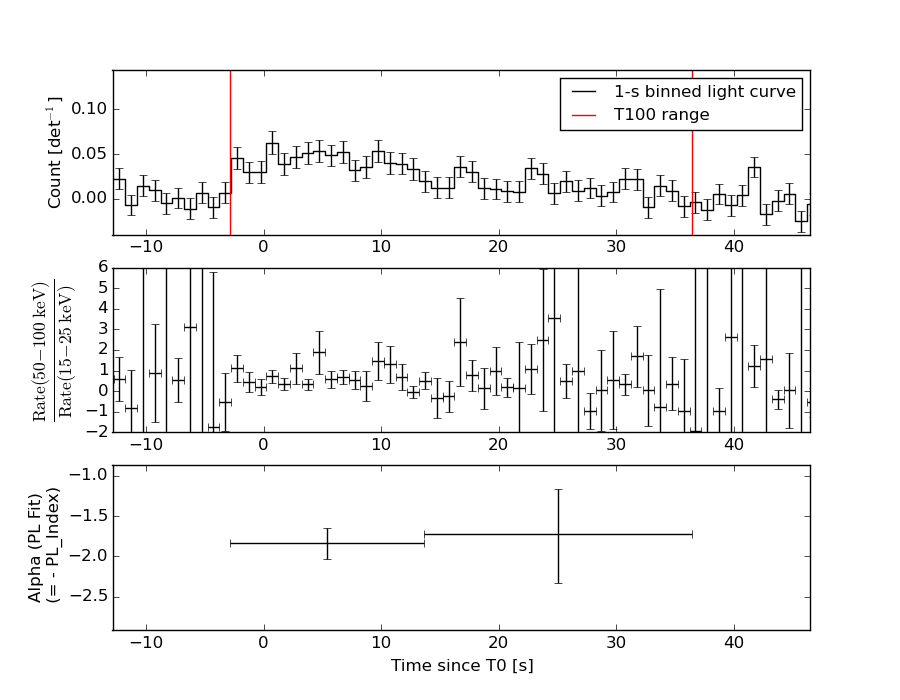
Duration
T90: 32.6839999556541 +/- 7.48940716116703
Measured from: -1.95600003004074
to: 30.7279999256134 [s; relative to TRIGTIME]
T50: 13.8359999060631 +/- 5.33741215626278
Measured from: 3.06800001859665
to: 16.9039999246597 [s; relative to TRIGTIME]
Fluence
Peak Flux (peak 1 second)
Measured from: 5.80000001192093
to: 6.80000001192093 [s; relative to TRIGTIME]
Total Fluence
Measured from: -2.86000001430511
to: 36.4800000190735 [s; relative to TRIGTIME]
Band 1 Band 2 Band 3 Band 4
15-25 25-50 50-100 100-350 keV
Total 0.374145 0.391850 0.247264 0.028964
0.039414 0.040938 0.035736 0.031677 [error]
Peak 0.026813 0.023162 0.014257 0.007697
0.006540 0.006725 0.005902 0.004840 [error]
[ fluence units of on-axis counts / fully illuminated detector ]
======================================================================
====== Table of the duration information =============================
Value tstart tstop
T100 39.340 -2.860 36.480
T90 32.684 -1.956 30.728
T50 13.836 3.068 16.904
Peak 1.000 5.800 6.800
====== Spectral Analysis Summary =====================================
Model : spectral model: simple power-law (PL) and cutoff power-law (CPL)
Ph_index : photon index: E^{Ph_index}
Ph_90err : 90% error of the photon index
Epeak : Epeak in keV
Epeak_90err: 90% error of Epeak
Norm : normalization at 50 keV in both the PL model and CPL model
Nomr_90err : 90% error of the normalization
chi2 : Chi-Squared
dof : degree of freedo
=== Time-averaged spectral analysis ===
(Best model with acceptable fit: PL)
Model Ph_index Ph_90err_low Ph_90err_hi Epeak Epeak_90err_low Epeak_90err_hi Norm Nomr_90err_low Norm_90err_hi chi2 dof
PL -1.798 -0.214 0.205 - - - 1.67e-03 -2.20e-04 2.15e-04 41.740 57
CPL -1.805 -0.208 0.730 9999.360 -9999.350 -9999.360 1.67e-03 -7.57e-04 2.49e-03 41.740 56
=== 1-s peak spectral analysis ===
(Best model with acceptable fit: PL)
Model Ph_index Ph_90err_low Ph_90err_hi Epeak Epeak_90err_low Epeak_90err_hi Norm Nomr_90err_low Norm_90err_hi chi2 dof
PL -1.924 -0.642 0.536 - - - 4.09e-03 -1.55e-03 1.38e-03 59.360 57
CPL -1.915 -1.964 0.476 9999.270 N/A N/A 4.11e-03 N/A N/A 59.360 56
=== Fluence/Peak Flux Summary ===
Model Band1 Band2 Band3 Band4 Band5 Total
15-25 25-50 50-100 100-350 15-150 15-350 keV
Fluence PL 1.11e-07 1.71e-07 1.96e-07 4.32e-07 6.06e-07 9.10e-07 erg/cm2
90%_error_low -1.86e-08 -1.89e-08 -3.51e-08 -1.40e-07 -8.03e-08 -1.77e-07 erg/cm2
90%_error_hi 1.91e-08 1.88e-08 3.53e-08 1.78e-07 8.18e-08 2.08e-07 erg/cm2
Peak flux PL 2.54e-01 1.99e-01 1.05e-01 8.01e-02 5.94e-01 6.37e-01 ph/cm2/s
90%_error_low -1.00e-01 -5.37e-02 -5.00e-02 -5.55e-02 -1.60e-01 -1.75e-01 ph/cm2/s
90%_error_hi 1.07e-01 5.36e-02 5.00e-02 9.91e-02 1.60e-01 1.77e-01 ph/cm2/s
Fluence CPL 1.12e-07 1.69e-07 1.96e-07 4.42e-07 6.10e-07 8.95e-07 erg/cm2
90%_error_low -2.14e-08 -1.79e-08 -4.10e-08 -2.28e-07 -1.03e-07 -3.09e-07 erg/cm2
90%_error_hi 2.00e-08 2.60e-08 4.16e-08 8.92e-08 6.32e-08 1.88e-07 erg/cm2
Peak flux CPL 2.28e-01 1.62e-01 7.99e-02 6.56e-02 4.99e-01 5.37e-01 ph/cm2/s
90%_error_low N/A -1.62e-01 -7.99e-02 -3.53e-02 -2.58e-01 -2.77e-01 ph/cm2/s
90%_error_hi N/A 6.56e-02 4.48e-02 3.72e-02 2.38e-01 2.56e-01 ph/cm2/s
======================================================================
Image
Pre-slew 15.0-350.0 keV image (Event data)
#   RAcent    DECcent   POSerr    Theta     Phi              Peak Cts       SNR   Name
  107.5448   -22.4682   0.0152    28.1396  -176.2403         1.0160731     12.730 TRIG_00643833

Foreground time interval of the image:
 -2.860  36.480 (delta_t =  39.340 [sec])
Background time interval of the image:
-525.667 -509.378 (delta_t =  16.289 [sec])
-239.768  -2.860 (delta_t = 236.908 [sec])
Light Curves
Note: The mask-weighted lightcurves have units of either count/det or counts/sec/det, where a det is 0.4 x 0.4 = 0.16 sq cm.
Full-time range; 1 s binning
Other quick-look light curves:
- 64 ms binning (zoomed)
- 16 ms binning (zoomed)
- 8 ms binning (zoomed)
- 2 ms binning (zoomed)
- SN=5 or 10 s binning (full-time range)
- Raw light curve
Spectra
- 64 ms binning (zoomed)
- 16 ms binning (zoomed)
- 8 ms binning (zoomed)
- 2 ms binning (zoomed)
- SN=5 or 10 s binning (full-time range)
- Raw light curve
Spectra
Notes:
- 1) The fitting includes the systematic errors.
- 2) When the burst includes telescope slew time periods, the fitting uses an average response file made from multiple 5-s response files through out the slew time plus single time preiod for the non-slew times, and weighted by the total counts in the corresponding time period using addrmf. An average response file is needed becuase a spectral fit using the pre-slew DRM will introduce some errors in both a spectral shape and a normalization if the PHA file contains a lot of the slew/post-slew time interval.
- 3) For fits to more complicated models (e.g. a power-law over a cutoff power-law), the BAT team has decided to require a chi-square improvement of more than 6 for each extra dof.
Time averaged spectrum fit using the average DRM
Power-law model

Time interval is from   -2.860 sec. to   36.480 sec.

Spectral model in power-law:
------------------------------------------------------------
Parameters  : value       lower 90%   higher 90%
Photon index: -1.79834     ( -0.213872   0.205208 )
Norm@50keV  : 1.67305E-03    ( -0.000220207   0.000214682 )
------------------------------------------------------------
#Fit statistic : Chi-Squared =          41.74 using 59 PHA bins.
# Reduced chi-squared =         0.7323 for     57 degrees of freedom
# Null hypothesis probability =   9.354084e-01

Photon flux (15-150 keV)    in 39.34 sec: 0.230407 ( -0.025627  0.025641 ) ph/cm2/s
Energy fluence (15-150 keV)             : 6.06056e-07 ( -8.03366e-08  8.17945e-08 ) ergs/cm2
Cutoff power-law model
Time interval is from   -2.860 sec. to   36.480 sec.
Spectral model in the cutoff power-law:
------------------------------------------------------------
Parameters  : value       lower 90%   higher 90%
Photon index: -1.80469     ( -0.210769   0.727598 )
Epeak [keV] : 9999.36      ( -9999.35 -9999.36 )
Norm@50keV  : 1.66811E-03    ( -0.000761685   0.00248608 )
------------------------------------------------------------
#Fit statistic : Chi-Squared =          41.74 using 59 PHA bins.
# Reduced chi-squared =         0.7454 for     56 degrees of freedom
# Null hypothesis probability =   9.218283e-01

Photon flux (15-150 keV)    in 39.34 sec: 0.231003 ( -0.027922  0.026414 ) ph/cm2/s
Energy fluence (15-150 keV)             : 6.10344e-07 ( -1.03057e-07  6.31816e-08 ) ergs/cm2
1-s peak spectrum fit
Power-law model
Time interval is from    5.800 sec. to    6.800 sec.

Spectral model in power-law:
------------------------------------------------------------
Parameters  : value       lower 90%   higher 90%
Photon index: -1.92374     ( -0.642354   0.53639 )
Norm@50keV  : 4.09380E-03    ( -0.00155178   0.00138386 )
------------------------------------------------------------
#Fit statistic : Chi-Squared =          59.36 using 59 PHA bins.
# Reduced chi-squared =          1.041 for     57 degrees of freedom
# Null hypothesis probability =   3.897269e-01

Photon flux (15-150 keV)    in 1 sec: 0.593554 ( -0.159885  0.159891 ) ph/cm2/s
Energy fluence (15-150 keV)             : 3.76556e-08 ( -1.27217e-08  1.32658e-08 ) ergs/cm2
Cutoff power-law model
Time interval is from    5.800 sec. to    6.800 sec.
Spectral model in the cutoff power-law:
------------------------------------------------------------
Parameters  : value       lower 90%   higher 90%
Photon index: -3.41212     ( -0.46828   1.97106 )
Epeak [keV] : 380.842      (   )
Norm@50keV  : 7.98873E-04    (     )
------------------------------------------------------------
#Fit statistic : Chi-Squared =          57.52 using 59 PHA bins.
# Reduced chi-squared =          1.027 for     56 degrees of freedom
# Null hypothesis probability =   4.186935e-01

Photon flux (15-150 keV)    in 1 sec: 0.499182 ( -0.257657  0.237849 ) ph/cm2/s
Energy fluence (15-150 keV)             : 3.3655e-08 ( -1.72744e-08  1.31821e-08 ) ergs/cm2
Time-resolved spectra
Distribution
T90 vs. Hardness ratio plot
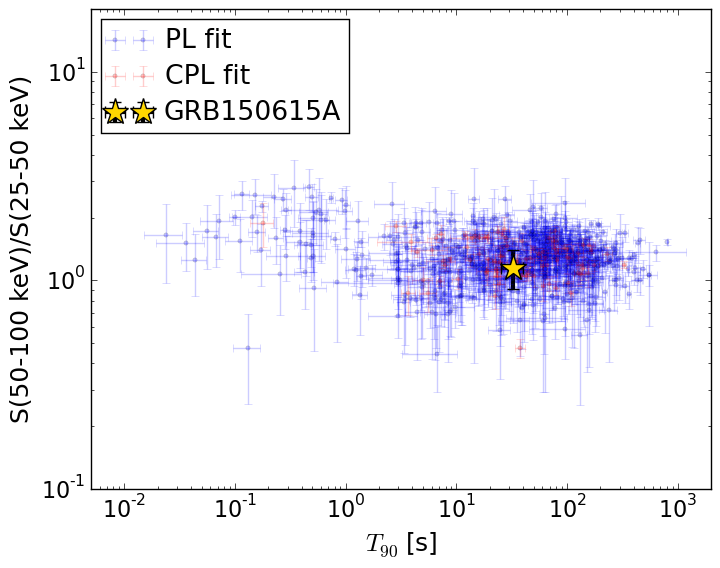
T90                                   = 32.684 sec.
Hardness ratio (energy fluence ratio) = 1.15003236717
S(15-50 keV) vs. S(50-150 keV) plot
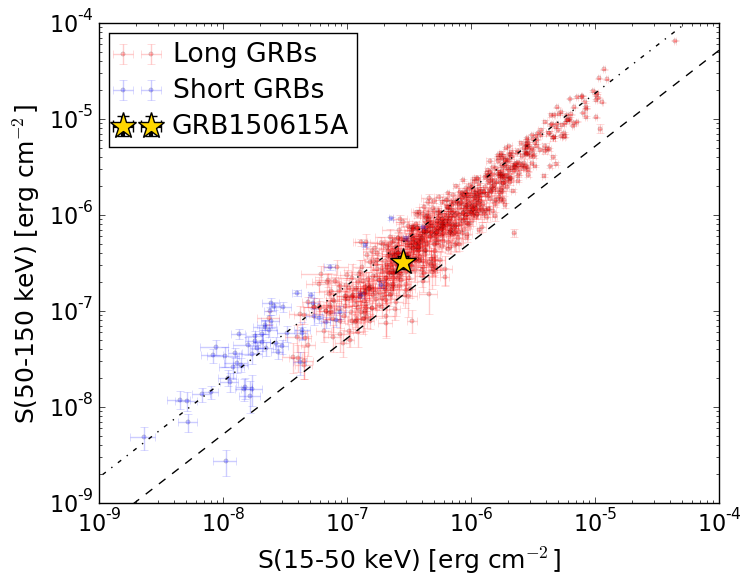
S(15-50 keV)  = 2.81825e-07
S(50-150 keV) = 3.242258e-07
The dash-dotted line and the dashed line traces the fluences calculated from the Band function with Epeak = 15 and 150 keV, respectively. Both lines assume a canonical values of alpha = -1 and beta = -2.5.
Mask shadow pattern
IMX = -5.336869788725411E-01, IMY = 3.507030346768814E-02
Spacecraft aspect plot
Bright source in the pre-burst/pre-slew/post-slew images
Pre-burst image of 15-350 keV band
Time interval of the image:
-525.667390 -509.378000
-239.768000 -2.860000

# RAcent  DECcent POSerr Theta    Phi  PeakCts   SNR AngSep     Name
#  [deg]    [deg]    ['] [deg]  [deg]                   [']
135.7477 -40.5403    5.2  36.3  127.9  -1.2975  -2.2   10.0	Vela X-1
116.6947 -16.2374    2.5  17.5 -177.4   0.8873   4.7 ------	UNKNOWN
155.8634  39.8514    2.3  50.4  -19.0   2.4790   5.0 ------	UNKNOWN
 71.6646 -25.4295    5.1  59.6 -161.6   4.1579   2.3 ------	UNKNOWN
138.3436  41.3486    3.2  46.6  -36.1   1.5611   3.6 ------	UNKNOWN
 85.9397   6.2256    2.3  45.3 -121.3   4.5613   5.2 ------	UNKNOWN
 85.6492   6.0650    2.5  45.6 -121.6   4.4702   5.0 ------	UNKNOWN
Pre-slew background subtracted image of 15-350 keV band
Time interval of the image:
-2.860000 36.480000

# RAcent  DECcent POSerr Theta    Phi  PeakCts   SNR AngSep     Name
#  [deg]    [deg]    ['] [deg]  [deg]                   [']
135.3840 -40.5932    5.7  36.3  128.4   0.3541   2.0    7.0	Vela X-1
107.5448 -22.4681    0.9  28.1 -176.2   1.0159  12.7 ------	UNKNOWN
Post-slew image of 15-350 keV band
Time interval of the image:
101.732590 962.364100

# RAcent  DECcent POSerr Theta    Phi  PeakCts   SNR AngSep     Name
#  [deg]    [deg]    ['] [deg]  [deg]                   [']
135.5861 -40.7238    4.2  29.8   73.4  -2.9771  -2.7   10.5	Vela X-1
 46.4020 -38.3878    3.5  54.1  177.1   7.3952   3.3 ------	UNKNOWN
137.9974  20.0759    3.2  51.9  -23.7   5.1722   3.6 ------	UNKNOWN
136.8881  26.7800    3.4  56.8  -29.4  12.7934   3.4 ------	UNKNOWN
 69.0304   3.2291    3.0  45.6 -121.5   9.6825   3.8 ------	UNKNOWN