Analysis Summary
Notes:
- 1) No attempt has been made to eliminate the non-significant decimal places.
- 2) This batgrbproduct analysis is done using the HEASARC data.
- 3) This batgrbproduct analysis is using the flight position for the mask-weighting calculation.
======================================================================
                  BAT GRB EVENT DATA PROCESSING REPORT
    Process Script Ver: batgrbproduct v2.46
    Process Start Time: Sat Jul 11 00:00:48 EDT 2015
             Host Name: bat1
   Current Working Dir: /local/data/bat1/alien/Swift_3rdBATcatalog/event/batevent_reproc/trigger644259
======================================================================

  Trigger: 00644259      Segment: 000

  BAT Trigger Time: 456187772.992   [s; MET]
      Trigger Stop: 456187789.376   [s; MET]
               UTC: 2015-06-16T22:49:19.264160    [includes UTCF correction]
       Where From?: TDRSS position message

  BAT
    RA: 314.704655959612   Dec: -53.3935296118629  [deg; J2000]

     Catalogged Source?: NO
     Point Source?:      YES
     GRB Indicated?:     YES    [ by BAT flight software ]
     Image S/N Ratio:    12.26
     Image Trigger?:     NO
     Rate S/N Ratio:     16.9115345252878  [ if not an image trigger ]
     Image S/N Ratio:    12.26

  Analysis Position:   [ source = BAT ]
    RA: 314.704655959612   Dec: -53.3935296118629  [deg; J2000]

  Refined Position:   [ source = BAT pre-slew burst ]
    RA: 314.712148232386   Dec: -53.4023536225514  [deg; J2000]
        { 20h 58m 50.9s , -53d 24' 08.5" }
         +/- 1.16954694878419 [arcmin] (estimated 90% radius based on SNR)
         +/- 0.435875366271755 [arcmin] (formal 1-sigma fit error)
    SNR: 24.3192565317787

  Angular difference between the analysis and refined position is 0.593424 arcmin

  Partial Coding Fraction: 0.2890625    [ including projection effects ]

  Duration
     T90: 608.407999992371 +/- 104.219640720468
        Measured from: -30.472000002861
                   to: 577.93599998951     [s; relative to TRIGTIME]
     T50: 108.547999978065 +/- 12.5894971790742
        Measured from: 65.8600000143051
                   to: 174.407999992371     [s; relative to TRIGTIME]


  Fluence
     Peak Flux  (peak 1 second)
        Measured from: 93.5839999914169
                   to: 94.5839999914169     [s; relative to TRIGTIME]
     Total Fluence
        Measured from: -48.1399999856949
                   to: 705.776000022888     [s; relative to TRIGTIME]

             Band 1     Band 2     Band 3     Band 4
              15-25      25-50     50-100    100-350     keV
 Total     8.654023  11.538063   8.432227   1.844344
           0.298362   0.287188   0.241535   0.200517 [error]
 Peak      0.100634   0.100453   0.107287   0.031644
           0.013932   0.013766   0.012114   0.009574 [error]

     [ fluence units of on-axis counts / fully illuminated detector ]

======================================================================


====== Table of the duration information =============================

        Value   tstart    tstop
T100  753.916  -48.140  705.776
T90   608.408  -30.472  577.936
T50   108.548   65.860  174.408
Peak    1.000   93.584   94.584


====== Spectral Analysis Summary =====================================

Model      : spectral model: simple power-law (PL) and cutoff power-law (CPL)
Ph_index   : photon index: E^{Ph_index}
Ph_90err   : 90% error of the photon index
Epeak      : Epeak in keV
Epeak_90err: 90% error of Epeak
Norm       : normalization at 50 keV in both the PL model and CPL model
Nomr_90err : 90% error of the normalization
chi2       : Chi-Squared
dof        : degree of freedo

=== Time-averaged spectral analysis ===
(Best model with acceptable fit: PL)

Model Ph_index Ph_90err_low Ph_90err_hi  Epeak  Epeak_90err_low  Epeak_90err_hi  Norm       Nomr_90err_low    Norm_90err_hi    chi2    dof
PL      -1.661    -0.057      0.057       -           -               -         2.80e-03     -8.50e-05          8.50e-05      44.530   57
CPL     -1.428    -0.224      0.236      131.726     -40.695       868.273      3.60e-03     -7.54e-04          1.01e-03      41.370   56


=== 1-s peak spectral analysis ===
(Best model with acceptable fit: PL)

Model Ph_index Ph_90err_low Ph_90err_hi  Epeak  Epeak_90err_low  Epeak_90err_hi  Norm       Nomr_90err_low    Norm_90err_hi    chi2    dof
PL      -1.588     -0.222     0.218       -           -               -         2.19e-02     -2.83e-03          2.81e-03      60.150   57
CPL     -1.354     -0.445     0.913      146.958    -146.958      -146.958      2.84e-02        N/A               N/A         59.900   56


=== Fluence/Peak Flux Summary ===

              Model    Band1     Band2     Band3     Band4     Band5     Total
                       15-25     25-50    50-100    100-350    15-150    15-350    keV
Fluence         PL   3.14e-06  5.22e-06  6.61e-06  1.67e-05  1.96e-05  3.17e-05   erg/cm2
      90%_error_low -1.83e-07 -1.79e-07 -2.52e-07 -1.39e-06 -6.14e-07 -1.55e-06   erg/cm2
      90%_error_hi   1.88e-07  1.79e-07  2.52e-07  1.48e-06  6.15e-07  1.61e-06   erg/cm2
Peak flux       PL   9.81e-01  9.38e-01  6.24e-01  6.46e-01  2.81e+00  3.19e+00   ph/cm2/s
      90%_error_low -2.08e-01 -1.28e-01 -1.01e-01 -1.91e-01 -3.67e-01 -4.01e-01   ph/cm2/s
      90%_error_hi   2.23e-01  1.27e-01  9.88e-02  2.31e-01  3.68e-01  4.01e-01   ph/cm2/s

Fluence        CPL   2.97e-06  5.30e-06  6.73e-06  1.22e-05  1.93e-05  2.73e-05   erg/cm2
      90%_error_low -2.35e-07 -1.96e-07 -2.78e-07 -3.03e-06 -6.83e-07 -3.10e-06   erg/cm2
      90%_error_hi   2.40e-07  1.97e-07  2.81e-07  4.26e-06  6.81e-07  4.27e-06   erg/cm2
Peak flux      CPL   9.34e-01  9.56e-01  6.41e-01  5.09e-01  2.78e+00  3.04e+00   ph/cm2/s
      90%_error_low -2.62e-01 -1.40e-01 -1.01e-01 -2.79e-01 -3.81e-01 -5.08e-01   ph/cm2/s
      90%_error_hi   2.41e-01  1.45e-01  1.19e-01  1.97e-01  3.80e-01  5.19e-01   ph/cm2/s

======================================================================
Image
Pre-slew 15.0-350.0 keV image (Event data)
#   RAcent    DECcent   POSerr    Theta     Phi              Peak Cts       SNR   Name
  314.7121   -53.4024   0.0079    40.1680  -123.2269        24.9704569     24.319 TRIG_00644259

Foreground time interval of the image:
-48.140 492.809 (delta_t = 540.949 [sec])
Background time interval of the image:
-239.992 -48.140 (delta_t = 191.852 [sec])
Light Curves
Note: The mask-weighted lightcurves have units of either count/det or counts/sec/det, where a det is 0.4 x 0.4 = 0.16 sq cm.
Full-time range; 1 s binning
Other quick-look light curves:
- 64 ms binning (zoomed)
- 16 ms binning (zoomed)
- 8 ms binning (zoomed)
- 2 ms binning (zoomed)
- SN=5 or 10 s binning (full-time range)
- Raw light curve
Spectra
- 64 ms binning (zoomed)
- 16 ms binning (zoomed)
- 8 ms binning (zoomed)
- 2 ms binning (zoomed)
- SN=5 or 10 s binning (full-time range)
- Raw light curve
Spectra
Notes:
- 1) The fitting includes the systematic errors.
- 2) When the burst includes telescope slew time periods, the fitting uses an average response file made from multiple 5-s response files through out the slew time plus single time preiod for the non-slew times, and weighted by the total counts in the corresponding time period using addrmf. An average response file is needed becuase a spectral fit using the pre-slew DRM will introduce some errors in both a spectral shape and a normalization if the PHA file contains a lot of the slew/post-slew time interval.
- 3) For fits to more complicated models (e.g. a power-law over a cutoff power-law), the BAT team has decided to require a chi-square improvement of more than 6 for each extra dof.
Time averaged spectrum fit using the average DRM
Power-law model
Time interval is from  -48.140 sec. to  705.776 sec.

Spectral model in power-law:
------------------------------------------------------------
Parameters  : value       lower 90%   higher 90%
Photon index: -1.66075     ( -0.0570713   0.0569761 )
Norm@50keV  : 2.80031E-03    ( -8.50317e-05   8.50102e-05 )
------------------------------------------------------------
#Fit statistic : Chi-Squared =          44.53 using 59 PHA bins.
# Reduced chi-squared =         0.7813 for     57 degrees of freedom
# Null hypothesis probability =   8.853150e-01

Photon flux (15-150 keV)    in 753.9 sec: 0.366972 ( -0.012573  0.012624 ) ph/cm2/s
Energy fluence (15-150 keV)             : 1.96166e-05 ( -6.13997e-07  6.15135e-07 ) ergs/cm2
Cutoff power-law model
Time interval is from  -48.140 sec. to  705.776 sec.
Spectral model in the cutoff power-law:
------------------------------------------------------------
Parameters  : value       lower 90%   higher 90%
Photon index: -1.42786     ( -0.223617   0.235622 )
Epeak [keV] : 131.726      ( -40.6963 868.272 )
Norm@50keV  : 3.60029E-03    ( -0.000754083   0.00101209 )
------------------------------------------------------------
#Fit statistic : Chi-Squared =          41.37 using 59 PHA bins.
# Reduced chi-squared =         0.7388 for     56 degrees of freedom
# Null hypothesis probability =   9.279019e-01

Photon flux (15-150 keV)    in 753.9 sec: 0.360475 ( -0.013898  0.013966 ) ph/cm2/s
Energy fluence (15-150 keV)             : 1.93078e-05 ( -6.83369e-07  6.80831e-07 ) ergs/cm2
1-s peak spectrum fit
Power-law model
Time interval is from   93.584 sec. to   94.584 sec.

Spectral model in power-law:
------------------------------------------------------------
Parameters  : value       lower 90%   higher 90%
Photon index: -1.58792     ( -0.221935   0.217534 )
Norm@50keV  : 2.19124E-02    ( -0.00282874   0.00280999 )
------------------------------------------------------------
#Fit statistic : Chi-Squared =          60.15 using 59 PHA bins.
# Reduced chi-squared =          1.055 for     57 degrees of freedom
# Null hypothesis probability =   3.623411e-01

Photon flux (15-150 keV)    in 1 sec: 2.80550 ( -0.36683  0.36837 ) ph/cm2/s
Energy fluence (15-150 keV)             : 2.05263e-07 ( -2.80931e-08  2.82709e-08 ) ergs/cm2
Cutoff power-law model
Time interval is from   93.584 sec. to   94.584 sec.
Spectral model in the cutoff power-law:
------------------------------------------------------------
Parameters  : value       lower 90%   higher 90%
Photon index: -1.35384     ( -0.444519   0.91339 )
Epeak [keV] : 146.958      ( -146.964 -146.964 )
Norm@50keV  : 2.84429E-02    (     )
------------------------------------------------------------
#Fit statistic : Chi-Squared =          59.90 using 59 PHA bins.
# Reduced chi-squared =          1.070 for     56 degrees of freedom
# Null hypothesis probability =   3.361131e-01

Photon flux (15-150 keV)    in 1 sec: 2.77637 ( -0.38147  0.38 ) ph/cm2/s
Energy fluence (15-150 keV)             : 2.03161e-07 ( -2.91447e-08  2.91234e-08 ) ergs/cm2
Time-resolved spectra

Distribution
T90 vs. Hardness ratio plot
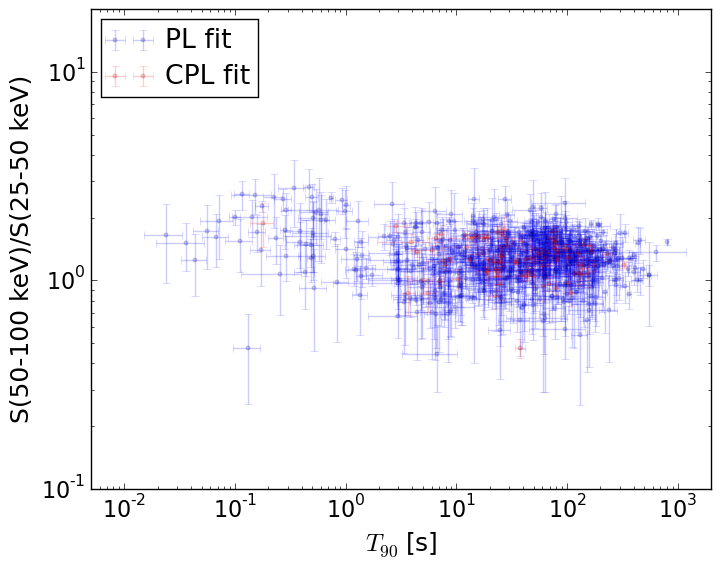
T90                                   = N/A sec.
Hardness ratio (energy fluence ratio) = N/A
S(15-50 keV) vs. S(50-150 keV) plot
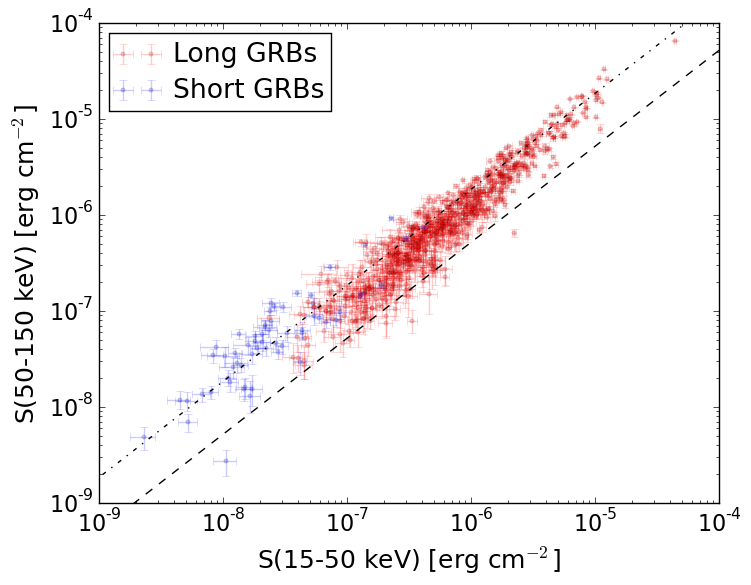
S(15-50 keV)  = N/A
S(50-150 keV) = N/A
The dash-dotted line and the dashed line traces the fluences calculated from the Band function with Epeak = 15 and 150 keV, respectively. Both lines assume a canonical values of alpha = -1 and beta = -2.5.
Mask shadow pattern
IMX = -4.625346132641776E-01, IMY = 7.061034131319260E-01
Spacecraft aspect plot
Bright source in the pre-burst/pre-slew/post-slew images
Pre-burst image of 15-350 keV band
Time interval of the image:
-239.992000 -48.140000

# RAcent  DECcent POSerr Theta    Phi  PeakCts   SNR AngSep     Name
#  [deg]    [deg]    ['] [deg]  [deg]                   [']
244.9892 -15.6351    0.4  25.6   45.8   7.1498  27.1    0.6	Sco X-1
256.0070 -37.7787    2.7  10.2  -25.4   0.8279   4.3    4.0	4U 1700-377
256.5355 -36.4489    5.2   9.2  -19.4   0.4302   2.2    5.1	GX 349+2
262.8692 -24.9004   17.1   8.0   76.4  -0.1236  -0.7   12.0	GX 1+4
264.8734 -44.4618   12.3  12.3  -74.3  -0.1795  -0.9    5.6	4U 1735-44
268.3480  -1.4560   88.5  30.9  104.1  -0.0539  -0.1    1.2	SW J1753.5-0127
270.2776 -25.0278    3.0   8.0  126.3   0.7390   3.8    3.1	GX 5-1
270.3491 -25.7625    8.7   7.3  129.1   0.2464   1.3    2.8	GRS 1758-258
274.0059 -14.0781    4.3  19.5  122.9   0.5855   2.7    2.5	GX 17+2
275.9779 -30.3400    6.8   8.4  179.6   0.3091   1.7    3.2	H1820-303
284.9329 -25.1037    0.0  17.7  171.2   0.2203   1.2   12.3	HT1900.1-2455
263.0828 -33.6716    4.4   3.1  -17.0   0.4857   2.6   10.8	GX 354-0
266.6228 -32.2957    1.5   0.2 -158.3   1.3561   7.6 ------	UNKNOWN
333.3019 -21.8767    3.9  59.5 -161.6   5.3957   3.0 ------	UNKNOWN
197.6286 -59.0879    2.7  52.0  -42.2   4.4555   4.3 ------	UNKNOWN
327.8658 -49.9785    2.9  48.0 -129.1   3.3672   4.0 ------	UNKNOWN
Pre-slew background subtracted image of 15-350 keV band
Time interval of the image:
-48.140000 492.808600

# RAcent  DECcent POSerr Theta    Phi  PeakCts   SNR AngSep     Name
#  [deg]    [deg]    ['] [deg]  [deg]                   [']
244.8351 -15.5077    0.0  25.8   45.8   1.5056   2.2   11.5	Sco X-1
255.9467 -37.8610    2.0  10.2  -25.6   3.0215   5.8    2.1	4U 1700-377
256.3516 -36.5770    8.3   9.4  -19.8   0.7319   1.4   10.1	GX 349+2
263.1634 -24.6803    3.3   8.1   78.8   1.7774   3.5    9.3	GX 1+4
264.8304 -44.4040    4.6  12.2  -74.2   1.2812   2.5    4.7	4U 1735-44
268.3557  -1.5320   15.9  30.8  104.1  -0.7263  -0.7    4.8	SW J1753.5-0127
270.3807 -25.1702    9.7   7.9  127.3  -0.5972  -1.2    7.6	GX 5-1
270.2862 -25.7682    9.5   7.3  128.7   0.6475   1.3    1.7	GRS 1758-258
273.8908 -14.1771    5.1  19.3  122.7   1.3297   2.2   10.8	GX 17+2
275.9232 -30.5213   28.9   8.3 -179.3  -0.1927  -0.4    9.3	H1820-303
285.0159 -24.7757    4.4  17.9  170.4   1.2903   2.6    8.8	HT1900.1-2455
263.1406 -33.6644    0.0   3.1  -17.3  -0.7951  -1.6   12.7	GX 354-0
294.9005   7.8434    2.6  48.4  139.5  11.2468   4.3 ------	UNKNOWN
314.7121 -53.4024    0.5  40.2 -123.2  24.9712  24.3 ------	UNKNOWN
Post-slew image of 15-350 keV band
Time interval of the image:
559.808600 962.143200

# RAcent  DECcent POSerr Theta    Phi  PeakCts   SNR AngSep     Name
#  [deg]    [deg]    ['] [deg]  [deg]                   [']
264.7908 -44.5643    9.1  33.2   66.0   0.9979   1.3    7.2	4U 1735-44
275.8686 -30.4894   34.2  36.1   94.8  -0.3474  -0.3    7.9	H1820-303
285.0348 -24.9233   16.0  36.1  111.6   0.6033   0.7    0.2	HT1900.1-2455
308.9706  -3.5032    3.0  50.1  153.8   4.2217   3.9 ------	UNKNOWN
288.0068 -41.4511    3.8  21.4   94.2   1.1431   3.1 ------	UNKNOWN
314.7427 -53.3532    1.6   0.1 -158.0   1.9056   7.2 ------	UNKNOWN
325.9090 -78.1058    3.3  25.0  -24.2   0.8780   3.5 ------	UNKNOWN
347.6895  -1.3851    3.9  58.7 -159.2   5.9282   3.0 ------	UNKNOWN
 21.4701 -48.4924    3.5  40.8  -87.5   4.4423   3.4 ------	UNKNOWN