Analysis Summary
Notes:
- 1) No attempt has been made to eliminate the non-significant decimal places.
- 2) This batgrbproduct analysis is done using the HEASARC data.
- 3) This batgrbproduct analysis is using the flight position for the mask-weighting calculation.
======================================================================
                  BAT GRB EVENT DATA PROCESSING REPORT
    Process Script Ver: batgrbproduct v2.46
    Process Start Time: Sat Jul 11 00:03:29 EDT 2015
             Host Name: bat1
   Current Working Dir: /local/data/bat1/alien/Swift_3rdBATcatalog/event/batevent_reproc/trigger646603
======================================================================

  Trigger: 00646603      Segment: 000

  BAT Trigger Time: 456977583.296   [s; MET]
      Trigger Stop: 456977584.32   [s; MET]
               UTC: 2015-06-26T02:12:49.527100    [includes UTCF correction]
       Where From?: TDRSS position message

  BAT
    RA: 111.341156726315   Dec: -37.7641175175662  [deg; J2000]

     Catalogged Source?: NO
     Point Source?:      YES
     GRB Indicated?:     YES    [ by BAT flight software ]
     Image S/N Ratio:    8.71
     Image Trigger?:     NO
     Rate S/N Ratio:     11.8743420870379  [ if not an image trigger ]
     Image S/N Ratio:    8.71

  Analysis Position:   [ source = BAT ]
    RA: 111.341156726315   Dec: -37.7641175175662  [deg; J2000]

  Refined Position:   [ source = BAT pre-slew burst ]
    RA: 111.349578289419   Dec: -37.7910275296836  [deg; J2000]
        { 07h 25m 23.9s , -37d 47' 27.7" }
         +/- 1.4523476363406 [arcmin] (estimated 90% radius based on SNR)
         +/- 0.536805660548311 [arcmin] (formal 1-sigma fit error)
    SNR: 17.8479761430266

  Angular difference between the analysis and refined position is 1.663262 arcmin

  Partial Coding Fraction: 0.3789062    [ including projection effects ]

  Duration
     T90: 97.2640000581741 +/- 34.9372740079621
        Measured from: -4.97600001096725
                   to: 92.2880000472069     [s; relative to TRIGTIME]
     T50: 18.7520000338554 +/- 24.5833843108381
        Measured from: 0.128000020980835
                   to: 18.8800000548363     [s; relative to TRIGTIME]


  Fluence
     Peak Flux  (peak 1 second)
        Measured from: 0.356000006198883
                   to: 1.35600000619888     [s; relative to TRIGTIME]
     Total Fluence
        Measured from: -6.57599997520447
                   to: 115.152000010014     [s; relative to TRIGTIME]

             Band 1     Band 2     Band 3     Band 4
              15-25      25-50     50-100    100-350     keV
 Total     0.881846   0.864663   0.589523   0.097491
           0.070931   0.073324   0.063740   0.055761 [error]
 Peak      0.045648   0.086832   0.045458  -0.003504
           0.009499   0.010582   0.008766   0.006993 [error]

     [ fluence units of on-axis counts / fully illuminated detector ]

======================================================================


====== Table of the duration information =============================

        Value   tstart    tstop
T100  121.728   -6.576  115.152
T90    97.264   -4.976   92.288
T50    18.752    0.128   18.880
Peak    1.000    0.356    1.356


====== Spectral Analysis Summary =====================================

Model      : spectral model: simple power-law (PL) and cutoff power-law (CPL)
Ph_index   : photon index: E^{Ph_index}
Ph_90err   : 90% error of the photon index
Epeak      : Epeak in keV
Epeak_90err: 90% error of Epeak
Norm       : normalization at 50 keV in both the PL model and CPL model
Nomr_90err : 90% error of the normalization
chi2       : Chi-Squared
dof        : degree of freedo

=== Time-averaged spectral analysis ===
(Best model with acceptable fit: PL)

Model Ph_index Ph_90err_low Ph_90err_hi  Epeak  Epeak_90err_low  Epeak_90err_hi  Norm       Nomr_90err_low    Norm_90err_hi    chi2    dof
PL      -2.032    -0.185      0.176       -           -               -         1.22e-03     -1.39e-04          1.36e-04      54.600   57
CPL     -2.123    -0.109      0.515       63.839      N/A           N/A         1.08e-03        N/A               N/A         54.370   56


=== 1-s peak spectral analysis ===
(Best model with acceptable fit: PL)

Model Ph_index Ph_90err_low Ph_90err_hi  Epeak  Epeak_90err_low  Epeak_90err_hi  Norm       Nomr_90err_low    Norm_90err_hi    chi2    dof
PL      -1.744     -0.264     0.252       -           -               -         1.25e-02     -2.13e-03          2.10e-03      69.170   57
CPL     -0.455     -1.205     1.684       56.364     -12.986       108.470      6.06e-02     -6.06e-02          4.28e-01      65.820   56


=== Fluence/Peak Flux Summary ===

              Model    Band1     Band2     Band3     Band4     Band5     Total
                       15-25     25-50    50-100    100-350    15-150    15-350    keV
Fluence         PL   3.13e-07  4.17e-07  4.08e-07  7.14e-07  1.37e-06  1.85e-06   erg/cm2
      90%_error_low -4.15e-08 -3.70e-08 -6.41e-08 -2.04e-07 -1.43e-07 -2.76e-07   erg/cm2
      90%_error_hi   4.27e-08  3.70e-08  6.48e-08  2.52e-07  1.46e-07  3.11e-07   erg/cm2
Peak flux       PL   6.51e-01  5.67e-01  3.39e-01  3.04e-01  1.69e+00  1.86e+00   ph/cm2/s
      90%_error_low -1.54e-01 -9.20e-02 -7.18e-02 -1.09e-01 -2.72e-01 -2.94e-01   ph/cm2/s
      90%_error_hi   1.63e-01  9.15e-02  7.13e-02  1.38e-01  2.72e-01  2.94e-01   ph/cm2/s

Fluence        CPL   3.16e-07  4.02e-07  3.94e-07  8.25e-07  1.37e-06  1.87e-06   erg/cm2
      90%_error_low -4.70e-08 -6.06e-08 -1.47e-07 -3.04e-07 -4.53e-07    N/A      erg/cm2
      90%_error_hi   4.01e-08  5.28e-08  7.15e-08  2.06e-07  1.53e-07    N/A      erg/cm2
Peak flux      CPL   5.39e-01  6.49e-01  3.65e-01  9.17e-02  1.63e+00  1.65e+00   ph/cm2/s
      90%_error_low -1.82e-01 -1.21e-01 -8.71e-02 -9.17e-02 -2.79e-01 -2.91e-01   ph/cm2/s
      90%_error_hi   1.92e-01  1.30e-01  8.65e-02  1.92e-01  2.79e-01  3.10e-01   ph/cm2/s

======================================================================
Image
Pre-slew 15.0-350.0 keV image (Event data)

#   RAcent    DECcent   POSerr    Theta     Phi              Peak Cts       SNR   Name
  111.3496   -37.7910   0.0107    43.7989   -28.5522         1.5736167     17.848 TRIG_00646603

Foreground time interval of the image:
 -6.576  16.205 (delta_t =  22.781 [sec])
Background time interval of the image:
-239.296  -6.576 (delta_t = 232.720 [sec])
Light Curves
Note: The mask-weighted lightcurves have units of either count/det or counts/sec/det, where a det is 0.4 x 0.4 = 0.16 sq cm.
Full-time range; 1 s binning
Other quick-look light curves:
- 64 ms binning (zoomed)
- 16 ms binning (zoomed)
- 8 ms binning (zoomed)
- 2 ms binning (zoomed)
- SN=5 or 10 s binning (full-time range)
- Raw light curve
Spectra
- 64 ms binning (zoomed)
- 16 ms binning (zoomed)
- 8 ms binning (zoomed)
- 2 ms binning (zoomed)
- SN=5 or 10 s binning (full-time range)
- Raw light curve
Spectra
Notes:
- 1) The fitting includes the systematic errors.
- 2) When the burst includes telescope slew time periods, the fitting uses an average response file made from multiple 5-s response files through out the slew time plus single time preiod for the non-slew times, and weighted by the total counts in the corresponding time period using addrmf. An average response file is needed becuase a spectral fit using the pre-slew DRM will introduce some errors in both a spectral shape and a normalization if the PHA file contains a lot of the slew/post-slew time interval.
- 3) For fits to more complicated models (e.g. a power-law over a cutoff power-law), the BAT team has decided to require a chi-square improvement of more than 6 for each extra dof.
Time averaged spectrum fit using the average DRM
Power-law model
Time interval is from   -6.576 sec. to  115.152 sec.

Spectral model in power-law:
------------------------------------------------------------
Parameters  : value       lower 90%   higher 90%
Photon index: -2.03226     ( -0.184774   0.175927 )
Norm@50keV  : 1.21989E-03    ( -0.000139226   0.000135509 )
------------------------------------------------------------
#Fit statistic : Chi-Squared =          54.60 using 59 PHA bins.
# Reduced chi-squared =         0.9580 for     57 degrees of freedom
# Null hypothesis probability =   5.654623e-01

Photon flux (15-150 keV)    in 121.7 sec: 0.185765 ( -0.016679  0.016707 ) ph/cm2/s
Energy fluence (15-150 keV)             : 1.37196e-06 ( -1.43388e-07  1.45721e-07 ) ergs/cm2
Cutoff power-law model

Time interval is from   -6.576 sec. to  115.152 sec.
Spectral model in the cutoff power-law:
------------------------------------------------------------
Parameters  : value       lower 90%   higher 90%
Photon index: -2.12293     ( -0.109184   0.514566 )
Epeak [keV] : 63.8388      (   )
Norm@50keV  : 1.08478E-03    (     )
------------------------------------------------------------
#Fit statistic : Chi-Squared =          54.37 using 59 PHA bins.
# Reduced chi-squared =         0.9709 for     56 degrees of freedom
# Null hypothesis probability =   5.366711e-01

Photon flux (15-150 keV)    in 121.7 sec: 0.184041 ( -0.027287  0.018896 ) ph/cm2/s
Energy fluence (15-150 keV)             : 1.36719e-06 ( -4.52907e-07  1.5301e-07 ) ergs/cm2
1-s peak spectrum fit
Power-law model
Time interval is from    0.356 sec. to    1.356 sec.

Spectral model in power-law:
------------------------------------------------------------
Parameters  : value       lower 90%   higher 90%
Photon index: -1.74394     ( -0.263818   0.252464 )
Norm@50keV  : 1.25033E-02    ( -0.00213072   0.0020985 )
------------------------------------------------------------
#Fit statistic : Chi-Squared =          69.17 using 59 PHA bins.
# Reduced chi-squared =          1.213 for     57 degrees of freedom
# Null hypothesis probability =   1.294714e-01

Photon flux (15-150 keV)    in 1 sec: 1.68697 ( -0.27166  0.27219 ) ph/cm2/s
Energy fluence (15-150 keV)             : 1.15433e-07 ( -2.0059e-08  2.0267e-08 ) ergs/cm2
Cutoff power-law model

Time interval is from    0.356 sec. to    1.356 sec.
Spectral model in the cutoff power-law:
------------------------------------------------------------
Parameters  : value       lower 90%   higher 90%
Photon index: -0.454917     ( -1.20662   1.68221 )
Epeak [keV] : 56.3644      ( -12.9611 108.495 )
Norm@50keV  : 6.05903E-02    ( -0.0607933   0.427708 )
------------------------------------------------------------
#Fit statistic : Chi-Squared =          65.82 using 59 PHA bins.
# Reduced chi-squared =          1.175 for     56 degrees of freedom
# Null hypothesis probability =   1.734325e-01

Photon flux (15-150 keV)    in 1 sec: 1.62580 ( -0.27892  0.27914 ) ph/cm2/s
Energy fluence (15-150 keV)             : 1.07394e-07 ( -2.10465e-08  2.17071e-08 ) ergs/cm2
Time-resolved spectra

Distribution
T90 vs. Hardness ratio plot

T90                                   = 97.264 sec.
Hardness ratio (energy fluence ratio) = 0.977912686633
S(15-50 keV) vs. S(50-150 keV) plot
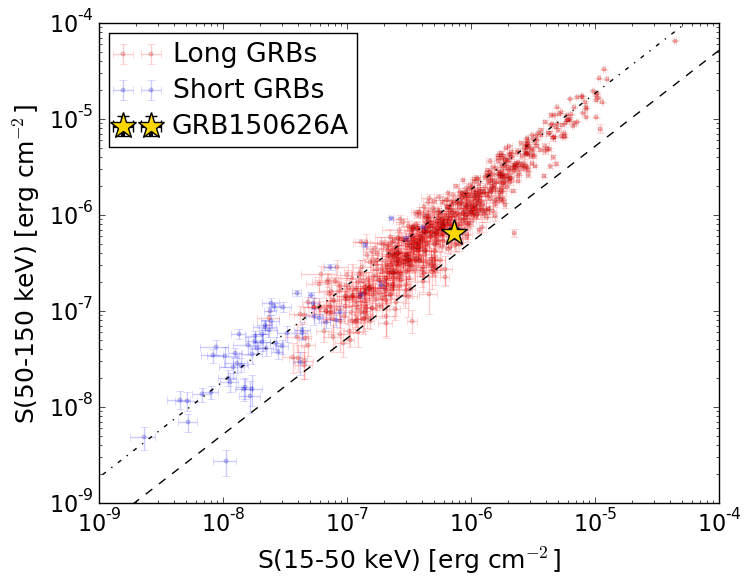
S(15-50 keV)  = 7.300907e-07
S(50-150 keV) = 6.418847e-07
The dash-dotted line and the dashed line traces the fluences calculated from the Band function with Epeak = 15 and 150 keV, respectively. Both lines assume a canonical values of alpha = -1 and beta = -2.5.
Mask shadow pattern

IMX = 8.423049718904094E-01, IMY = 4.583284421965760E-01
Spacecraft aspect plot

Bright source in the pre-burst/pre-slew/post-slew images
Pre-burst image of 15-350 keV band
Time interval of the image:
-239.296000 -6.576000

# RAcent  DECcent POSerr Theta    Phi  PeakCts   SNR AngSep     Name
#  [deg]    [deg]    ['] [deg]  [deg]                   [']
135.6020 -40.6231   31.9  55.7   -9.1   0.2254   0.4    5.3	Vela X-1
259.3158 -85.6548    3.0  40.1   60.4   2.2714   3.9 ------	UNKNOWN
148.1251 -67.7949    3.3  44.2   24.7   1.2538   3.5 ------	UNKNOWN
124.8088 -51.8821    3.4  42.8   -3.8   0.9851   3.4 ------	UNKNOWN
 19.0002 -15.0668    3.1  45.9 -167.5   1.2683   3.8 ------	UNKNOWN
 14.6072  -2.8481    2.6  58.8 -166.0   5.2494   4.5 ------	UNKNOWN
Pre-slew background subtracted image of 15-350 keV band
Time interval of the image:
-6.576000 16.204600

# RAcent  DECcent POSerr Theta    Phi  PeakCts   SNR AngSep     Name
#  [deg]    [deg]    ['] [deg]  [deg]                   [']
135.5681 -40.6096    6.2  55.7   -9.1   0.3071   1.9    3.8	Vela X-1
111.3496 -37.7910    0.6  43.8  -28.6   1.5739  17.9 ------	UNKNOWN
Post-slew image of 15-350 keV band
Time interval of the image:
77.004590 962.784000

# RAcent  DECcent POSerr Theta    Phi  PeakCts   SNR AngSep     Name
#  [deg]    [deg]    ['] [deg]  [deg]                   [']
135.5275 -40.5500    0.7  18.9   33.5   7.7707  15.8    0.3	Vela X-1
143.4726 -20.6725    2.6  32.6   -5.1   2.6881   4.4 ------	UNKNOWN
 87.9874 -16.0686    3.2  29.9 -122.4   2.5842   3.7 ------	UNKNOWN
 53.0791 -17.7811    2.5  54.3 -157.9   8.7151   4.6 ------	UNKNOWN
 65.9822 -14.7118    3.6  46.2 -145.2   3.7976   3.2 ------	UNKNOWN
 78.9722  -3.4172    3.0  45.3 -121.3   9.5498   3.9 ------	UNKNOWN