Analysis Summary
Notes:
- 1) No attempt has been made to eliminate the non-significant decimal places.
- 2) This batgrbproduct analysis is done using the HEASARC data.
- 3) This batgrbproduct analysis is using the flight position for the mask-weighting calculation.
======================================================================
                  BAT GRB EVENT DATA PROCESSING REPORT
    Process Script Ver: batgrbproduct v2.46
    Process Start Time: Sat Jul 11 00:06:23 EDT 2015
             Host Name: bat1
   Current Working Dir: /local/data/bat1/alien/Swift_3rdBATcatalog/event/batevent_reproc/trigger646786
======================================================================

  Trigger: 00646786      Segment: 000

  BAT Trigger Time: 457042986.56   [s; MET]
      Trigger Stop: 457042990.656   [s; MET]
               UTC: 2015-06-26T20:22:52.787720    [includes UTCF correction]
       Where From?: TDRSS position message

  BAT
    RA: 187.672182135   Dec: 66.7793620338311  [deg; J2000]

     Catalogged Source?: NO
     Point Source?:      YES
     GRB Indicated?:     YES    [ by BAT flight software ]
     Image S/N Ratio:    7.54
     Image Trigger?:     NO
     Rate S/N Ratio:     12.1243556529821  [ if not an image trigger ]
     Image S/N Ratio:    7.54

  Analysis Position:   [ source = BAT ]
    RA: 187.672182135   Dec: 66.7793620338311  [deg; J2000]

  Refined Position:   [ source = BAT pre-slew burst ]
    RA: 187.623026706687   Dec: 66.7960499586806  [deg; J2000]
        { 12h 30m 29.5s , +66d 47' 45.8" }
         +/- 1.92762806675177 [arcmin] (estimated 90% radius based on SNR)
         +/- 1.18681440926208 [arcmin] (formal 1-sigma fit error)
    SNR: 11.9108380941976

  Angular difference between the analysis and refined position is 1.534220 arcmin

  Partial Coding Fraction: 0.3554688    [ including projection effects ]

  Duration
     T90: 48 +/- 22.6274169979695
        Measured from: -15.5600000023842
                   to: 32.4399999976158     [s; relative to TRIGTIME]
     T50: 16 +/- 16
        Measured from: 0.439999997615814
                   to: 16.4399999976158     [s; relative to TRIGTIME]


  Fluence
     Peak Flux  (peak 1 second)
        Measured from: 7.93999999761581
                   to: 8.93999999761581     [s; relative to TRIGTIME]
     Total Fluence
        Measured from: -15.5600000023842
                   to: 32.4399999976158     [s; relative to TRIGTIME]

             Band 1     Band 2     Band 3     Band 4
              15-25      25-50     50-100    100-350     keV
 Total     0.310989   0.525082   0.500034   0.093473
           0.061842   0.064320   0.056167   0.047193 [error]
 Peak      0.011171   0.034548   0.009913  -0.006026
           0.009234   0.009503   0.008297   0.006739 [error]

     [ fluence units of on-axis counts / fully illuminated detector ]

======================================================================


====== Table of the duration information =============================

        Value   tstart    tstop
T100   48.000  -15.560   32.440
T90    48.000  -15.560   32.440
T50    16.000    0.440   16.440
Peak    1.000    7.940    8.940


====== Spectral Analysis Summary =====================================

Model      : spectral model: simple power-law (PL) and cutoff power-law (CPL)
Ph_index   : photon index: E^{Ph_index}
Ph_90err   : 90% error of the photon index
Epeak      : Epeak in keV
Epeak_90err: 90% error of Epeak
Norm       : normalization at 50 keV in both the PL model and CPL model
Nomr_90err : 90% error of the normalization
chi2       : Chi-Squared
dof        : degree of freedo

=== Time-averaged spectral analysis ===
(Best model with acceptable fit: PL)

Model Ph_index Ph_90err_low Ph_90err_hi  Epeak  Epeak_90err_low  Epeak_90err_hi  Norm       Nomr_90err_low    Norm_90err_hi    chi2    dof
PL      -1.265    -0.213      0.218       -           -               -         2.16e-03     -2.69e-04          2.68e-04      60.270   57
CPL     -1.023    -0.431      0.882      231.912    -231.912      -231.912      2.78e-03     -2.78e-03          3.79e-03      59.980   56


=== 1-s peak spectral analysis ===
(Best model with acceptable fit: N/A)

Model Ph_index Ph_90err_low Ph_90err_hi  Epeak  Epeak_90err_low  Epeak_90err_hi  Norm       Nomr_90err_low    Norm_90err_hi    chi2    dof
PL      -1.673     -0.782     0.795       -           -               -         3.83e-03     -1.91e-03          1.87e-03      59.960   57
CPL      3.797      N/A       N/A          36.886      N/A           N/A         1.11e+01        N/A               N/A         56.110   56


=== Fluence/Peak Flux Summary ===

              Model    Band1     Band2     Band3     Band4     Band5     Total
                       15-25     25-50    50-100    100-350    15-150    15-350    keV
Fluence         PL   1.07e-07  2.26e-07  3.76e-07  1.42e-06  1.04e-06  2.13e-06   erg/cm2
      90%_error_low -2.54e-08 -3.40e-08 -5.26e-08 -3.99e-07 -1.34e-07 -4.34e-07   erg/cm2
      90%_error_hi   2.74e-08  3.34e-08  5.19e-08  4.96e-07  1.34e-07  5.12e-07   erg/cm2
Peak flux       PL   1.86e-01  1.69e-01  1.06e-01  1.02e-01  5.04e-01  5.63e-01   ph/cm2/s
      90%_error_low -1.21e-01 -8.39e-02 -6.11e-02 -1.02e-01 -2.42e-01 -2.66e-01   ph/cm2/s
      90%_error_hi   1.43e-01  8.25e-02  6.32e-02  1.65e-01  2.45e-01  2.67e-01   ph/cm2/s

Fluence        CPL   1.00e-07  2.30e-07  3.87e-07  1.05e-06  1.03e-06  1.77e-06   erg/cm2
      90%_error_low -3.14e-08 -3.60e-08 -6.02e-08 -6.18e-07 -1.38e-07 -6.27e-07   erg/cm2
      90%_error_hi   2.54e-08  3.71e-08  6.36e-08  4.96e-07  1.37e-07  6.25e-07   erg/cm2
Peak flux      CPL   1.01e-01  3.29e-01  1.56e-02  3.35e-07  4.28e-01  4.28e-01   ph/cm2/s
      90%_error_low -6.41e-02 -1.37e-01 -9.86e-03 -3.35e-07 -1.57e-01 -1.57e-01   ph/cm2/s
      90%_error_hi   1.69e-01  1.17e-01  9.27e-02  3.88e-03  2.34e-01  2.34e-01   ph/cm2/s

======================================================================
Image
Pre-slew 15.0-350.0 keV image (Event data)
#   RAcent    DECcent   POSerr    Theta     Phi              Peak Cts       SNR   Name
  187.6230    66.7960   0.0161    44.4767     8.5100         1.6144993     11.911 TRIG_00646786

Foreground time interval of the image:
-15.560  32.440 (delta_t =  48.000 [sec])
Background time interval of the image:
-239.560 -15.560 (delta_t = 224.000 [sec])
Light Curves
Note: The mask-weighted lightcurves have units of either count/det or counts/sec/det, where a det is 0.4 x 0.4 = 0.16 sq cm.
Full-time range; 1 s binning
Other quick-look light curves:
- 64 ms binning (zoomed)
- 16 ms binning (zoomed)
- 8 ms binning (zoomed)
- 2 ms binning (zoomed)
- SN=5 or 10 s binning (full-time range)
- Raw light curve
Spectra
- 64 ms binning (zoomed)
- 16 ms binning (zoomed)
- 8 ms binning (zoomed)
- 2 ms binning (zoomed)
- SN=5 or 10 s binning (full-time range)
- Raw light curve
Spectra
Notes:
- 1) The fitting includes the systematic errors.
- 2) When the burst includes telescope slew time periods, the fitting uses an average response file made from multiple 5-s response files through out the slew time plus single time preiod for the non-slew times, and weighted by the total counts in the corresponding time period using addrmf. An average response file is needed becuase a spectral fit using the pre-slew DRM will introduce some errors in both a spectral shape and a normalization if the PHA file contains a lot of the slew/post-slew time interval.
- 3) For fits to more complicated models (e.g. a power-law over a cutoff power-law), the BAT team has decided to require a chi-square improvement of more than 6 for each extra dof.
Time averaged spectrum fit using the average DRM
Power-law model
Time interval is from  -15.560 sec. to   32.440 sec.

Spectral model in power-law:
------------------------------------------------------------
Parameters  : value       lower 90%   higher 90%
Photon index: -1.26518     ( -0.212758   0.21845 )
Norm@50keV  : 2.16446E-03    ( -0.000269055   0.000268435 )
------------------------------------------------------------
#Fit statistic : Chi-Squared =          60.27 using 59 PHA bins.
# Reduced chi-squared =          1.057 for     57 degrees of freedom
# Null hypothesis probability =   3.585407e-01

Photon flux (15-150 keV)    in 48 sec: 0.256645 ( -0.034206  0.034416 ) ph/cm2/s
Energy fluence (15-150 keV)             : 1.03579e-06 ( -1.33507e-07  1.33877e-07 ) ergs/cm2
Cutoff power-law model
Time interval is from  -15.560 sec. to   32.440 sec.
Spectral model in the cutoff power-law:
------------------------------------------------------------
Parameters  : value       lower 90%   higher 90%
Photon index: -1.02328     ( -0.43137   0.882054 )
Epeak [keV] : 231.912      ( -231.713 -231.713 )
Norm@50keV  : 2.77884E-03    ( -0.00277964   0.00378573 )
------------------------------------------------------------
#Fit statistic : Chi-Squared =          59.98 using 59 PHA bins.
# Reduced chi-squared =          1.071 for     56 degrees of freedom
# Null hypothesis probability =   3.336318e-01

Photon flux (15-150 keV)    in 48 sec: 0.253809 ( -0.035395  0.035508 ) ph/cm2/s
Energy fluence (15-150 keV)             : 1.0267e-06 ( -1.37779e-07  1.37031e-07 ) ergs/cm2
1-s peak spectrum fit
Power-law model
Time interval is from    7.940 sec. to    8.940 sec.

Spectral model in power-law:
------------------------------------------------------------
Parameters  : value       lower 90%   higher 90%
Photon index: -1.67266     ( -0.783923   0.793898 )
Norm@50keV  : 3.83039E-03    ( -0.00190678   0.00187069 )
------------------------------------------------------------
#Fit statistic : Chi-Squared =          59.96 using 59 PHA bins.
# Reduced chi-squared =          1.052 for     57 degrees of freedom
# Null hypothesis probability =   3.687939e-01

Photon flux (15-150 keV)    in 1 sec: 0.503893 ( -0.241927  0.244635 ) ph/cm2/s
Energy fluence (15-150 keV)             : 3.55631e-08 ( -1.7513e-08  1.85061e-08 ) ergs/cm2
Cutoff power-law model
Time interval is from    7.940 sec. to    8.940 sec.
Spectral model in the cutoff power-law:
------------------------------------------------------------
Parameters  : value       lower 90%   higher 90%
Photon index: 9.96989     (       )
Epeak [keV] : 34.2065      (   )
Norm@50keV  : 1.17708E+05    (     )
------------------------------------------------------------
#Fit statistic : Chi-Squared =          54.64 using 59 PHA bins.
# Reduced chi-squared =         0.9757 for     56 degrees of freedom
# Null hypothesis probability =   5.264812e-01

Photon flux (15-150 keV)    in 1 sec: 0.428128 ( -0.157094  0.233839 ) ph/cm2/s
Energy fluence (15-150 keV)             : 2.18937e-08 ( -7.96085e-09  1.21001e-08 ) ergs/cm2
Time-resolved spectra
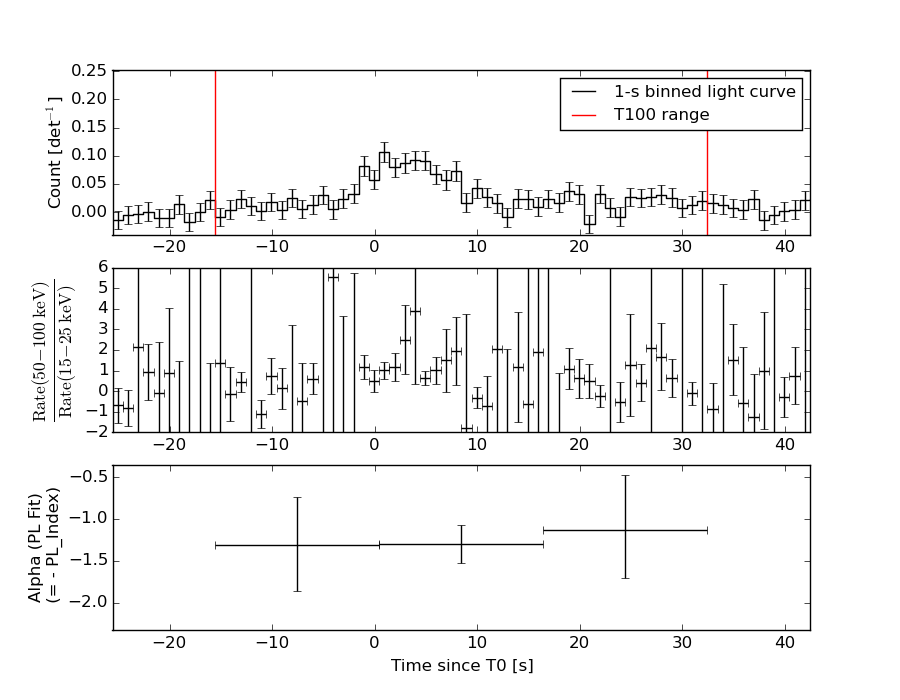
Distribution
T90 vs. Hardness ratio plot
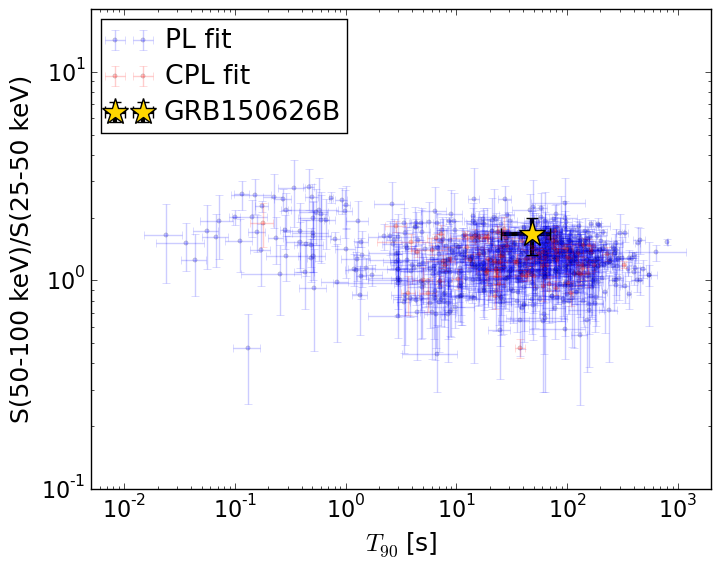
T90                                   = 48.0 sec.
Hardness ratio (energy fluence ratio) = 1.66421676091
S(15-50 keV) vs. S(50-150 keV) plot
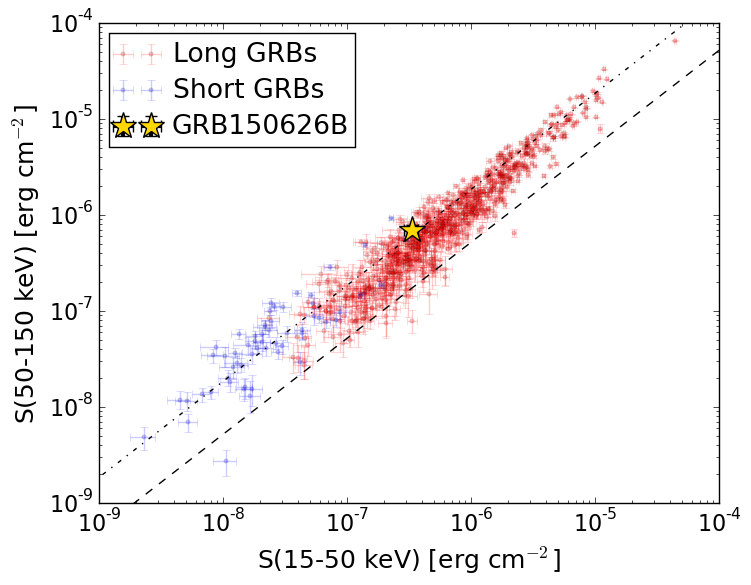
S(15-50 keV)  = 3.325276e-07
S(50-150 keV) = 7.032581e-07
The dash-dotted line and the dashed line traces the fluences calculated from the Band function with Epeak = 15 and 150 keV, respectively. Both lines assume a canonical values of alpha = -1 and beta = -2.5.
Mask shadow pattern
IMX = 9.710885768240416E-01, IMY = -1.453035710561384E-01
Spacecraft aspect plot
Bright source in the pre-burst/pre-slew/post-slew images
Pre-burst image of 15-350 keV band
Time interval of the image:
-239.560000 -15.560000

# RAcent  DECcent POSerr Theta    Phi  PeakCts   SNR AngSep     Name
#  [deg]    [deg]    ['] [deg]  [deg]                   [']
163.2774  49.3225    2.1  23.1   11.9   0.8563   5.6 ------	UNKNOWN
105.6827  12.5606    2.5  43.5 -114.7   3.2736   4.7 ------	UNKNOWN
Pre-slew background subtracted image of 15-350 keV band
Time interval of the image:
-15.560000 32.440000

# RAcent  DECcent POSerr Theta    Phi  PeakCts   SNR AngSep     Name
#  [deg]    [deg]    ['] [deg]  [deg]                   [']
191.8663  20.2605    2.1  39.6   80.6   1.6360   5.4 ------	UNKNOWN
159.8740 -22.0795    2.1  52.0  155.4   1.9292   5.5 ------	UNKNOWN
187.6233  66.7959    1.0  44.5    8.5   1.6149  11.9 ------	UNKNOWN
141.4585 -10.9481    2.5  40.5  179.7   0.5199   4.6 ------	UNKNOWN
 85.8429  78.0839    2.7  56.4  -24.8   1.2742   4.2 ------	UNKNOWN
Post-slew image of 15-350 keV band
Time interval of the image:
110.340600 962.554200

# RAcent  DECcent POSerr Theta    Phi  PeakCts   SNR AngSep     Name
#  [deg]    [deg]    ['] [deg]  [deg]                   [']
223.6218  72.5701    4.0  13.5   37.4   1.1711   2.9 ------	UNKNOWN
 13.6910  58.7334    3.3  54.4  -15.3   4.6904   3.6 ------	UNKNOWN
 71.9404  57.3859    3.2  47.0  -53.0   8.7744   3.6 ------	UNKNOWN
139.0405  28.5640    3.9  48.0 -129.1   5.8946   3.0 ------	UNKNOWN