Analysis Summary
Notes:
- 1) No attempt has been made to eliminate the non-significant decimal places.
- 2) This batgrbproduct analysis is done using the HEASARC data.
- 3) This batgrbproduct analysis is using the flight position for the mask-weighting calculation.
==========================================================================
BAT GROUND-DETECTED GRB DATA PROCESSING REPORT
(This burst occurred during telescope slew)
Process Script Ver: batgrbproduct v2.46
Process Start Time: Sat Jul 11 23:45:09 EDT 2015
Host Name: bat1
Current Working Dir: /local/data/bat1/alien/Swift_3rdBATcatalog/event/batevent_reproc/GRB150710B
======================================================================
Trigger: 00084694 Segment: 006
BAT Trigger Time: 458208349.184
UTC: 2015-07-10T08:05:49.184 [includes UTCF correction]
Where From?: Ground analysis (best_duration.txt)
NOTE: BAT trigger time for ground-detected burst during slew is the T100 start time.
Refined Position: [ source = BAT mosaic image ]
RA: 83.1942661328254 Dec: -46.963716210039 [deg; J2000]
{ 05h 32m 46.6s , -46d -57' -49.4" }
+/- 0.654561034219 [arcmin] (estimated 90% radius based on SNR)
SNR: 55.7318625269
Angular difference between the analysis and refined position is Usage: arcmin
Partial Coding Fraction: Unavailable because the burst occurred during slew.
Duration
T90: 13.839999973774 +/- 5.04107286296538
Measured from: 1.016
to: 14.856 [s; relative to TRIGTIME]
T50: 3.37599992752075 +/- 0.252253860134083
Measured from: 2.756
to: 6.132 [s; relative to TRIGTIME]
====== Table of the duration information =============================
Value tstart tstop
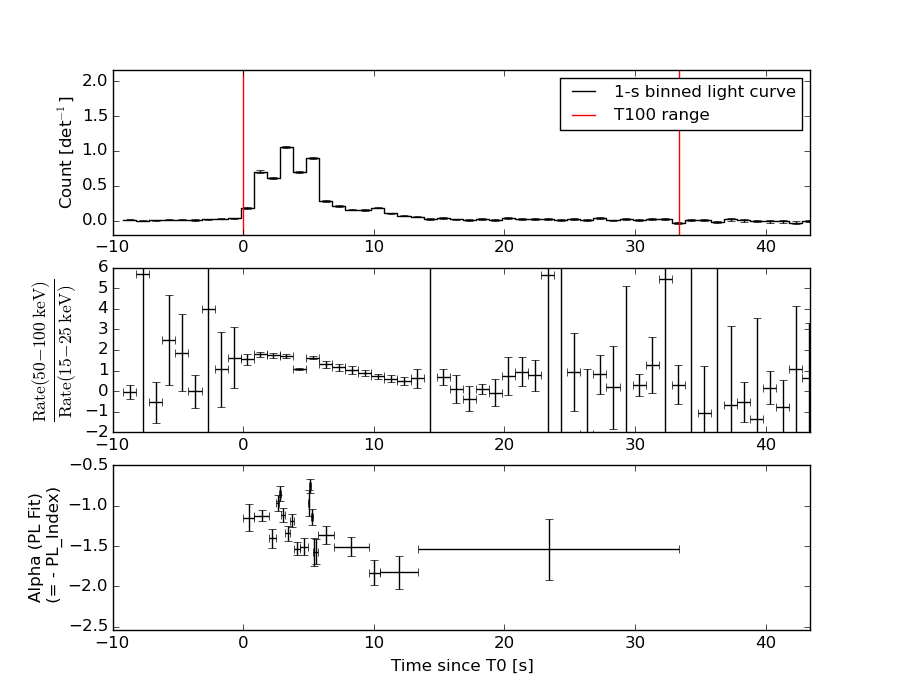
T100 33.400 0.000 33.400
T90 13.840 1.016 14.856
T50 3.376 2.756 6.132
Peak 1.000 2.784 3.784
====== Spectral Analysis Summary =====================================
Model : spectral model: simple power-law (PL) and cutoff power-law (CPL)
Ph_index : photon index: E^{Ph_index}
Ph_90err : 90% error of the photon index
Epeak : Epeak in keV
Epeak_90err: 90% error of Epeak
Norm : normalization at 50 keV in both the PL model and CPL model
Nomr_90err : 90% error of the normalization
chi2 : Chi-Squared
dof : degree of freedo
=== Time-averaged spectral analysis ===
(Best model with acceptable fit: CPL)
Model Ph_index Ph_90err_low Ph_90err_hi Epeak Epeak_90err_low Epeak_90err_hi Norm Nomr_90err_low Norm_90err_hi chi2 dof
PL -1.341 -0.045 0.045 - - - 1.17e-02 -2.75e-04 2.75e-04 55.230 57
CPL -1.089 -0.175 0.182 204.346 -62.143 305.594 1.52e-02 -2.43e-03 3.02e-03 49.120 56
=== 1-s peak spectral analysis ===
(Best model with acceptable fit: N/A)
Model Ph_index Ph_90err_low Ph_90err_hi Epeak Epeak_90err_low Epeak_90err_hi Norm Nomr_90err_low Norm_90err_hi chi2 dof
PL -1.121 -0.052 0.052 - - - 7.30e-02 -2.16e-03 2.16e-03 46.250 57
CPL -0.699 -0.214 0.225 176.843 -41.907 117.172 1.13e-01 -2.17e-02 2.82e-02 34.450 56
=== Fluence/Peak Flux Summary ===
Model Band1 Band2 Band3 Band4 Band5 Total
15-25 25-50 50-100 100-350 15-150 15-350 keV
Fluence PL 4.30e-07 8.71e-07 1.38e-06 4.82e-06 3.83e-06 7.50e-06 erg/cm2
90%_error_low -2.10e-08 -2.48e-08 -3.82e-08 -3.07e-07 -9.53e-08 -3.25e-07 erg/cm2
90%_error_hi 2.14e-08 2.47e-08 3.82e-08 3.21e-07 9.54e-08 3.38e-07 erg/cm2
Peak flux PL 6.02e-04 7.14e-03 1.10e-01 9.96e+00 4.98e-01 1.00e+01 ph/cm2/s
90%_error_low N/A N/A N/A N/A N/A N/A ph/cm2/s
90%_error_hi N/A N/A N/A N/A N/A N/A ph/cm2/s
Fluence CPL 4.03e-07 8.82e-07 1.41e-06 3.48e-06 3.77e-06 6.17e-06 erg/cm2
90%_error_low -2.73e-08 -2.63e-08 -4.37e-08 -6.76e-07 -1.05e-07 -6.78e-07 erg/cm2
90%_error_hi 2.78e-08 2.64e-08 4.41e-08 8.75e-07 1.04e-07 8.72e-07 erg/cm2
Peak flux CPL 1.87e+00 2.70e+00 2.55e+00 2.62e+00 8.32e+00 9.73e+00 ph/cm2/s
90%_error_low -1.59e-01 -1.03e-01 -1.01e-01 -4.54e-01 -2.70e-01 -5.38e-01 ph/cm2/s
90%_error_hi 1.62e-01 1.03e-01 1.02e-01 5.74e-01 2.71e-01 6.31e-01 ph/cm2/s
======================================================================
Image
Note1: The mosaic image is made with timebin = 0.2 s; energybin = 15-350 keV
Note2: The mosaic image uses Galactic coordinate.
#RAcent DECcent POSerr Theta  Phi  Peak_Cts  SNR Name
83.194 -46.964 0.001 31.821 114.292 0.114 55.732 UNKNOWN

Image time interval: 0.000 to 33.400 [sec]
Light Curves
Note: The mask-weighted lightcurves have units of either count/det or counts/sec/det, where a det is 0.4 x 0.4 = 0.16 sq cm.
Best duration plot
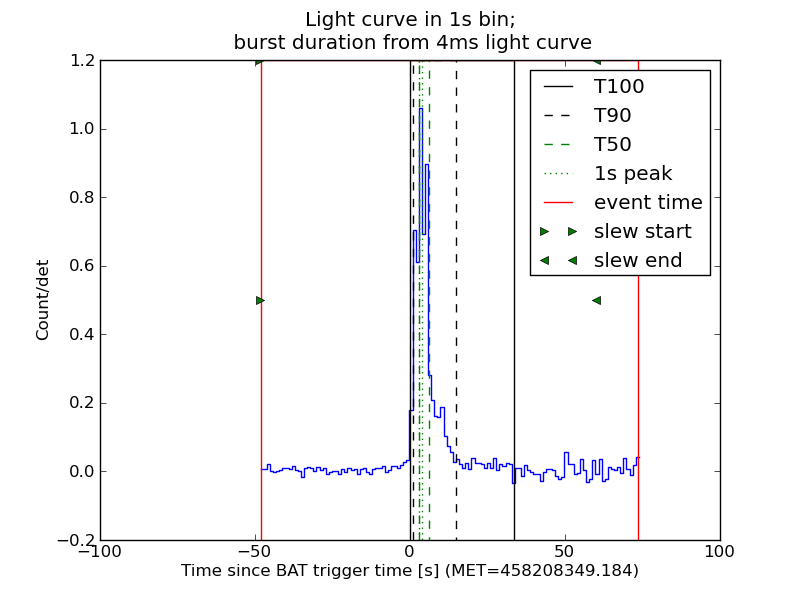
Full-time range; 1 s binning
Other quick-look light curves:
- 64 ms binning (zoomed)
- 16 ms binning (zoomed)
- 8 ms binning (zoomed)
- 2 ms binning (zoomed)
- SN=5 or 10 s binning (full-time range)
- Raw light curve
Spectra
- 64 ms binning (zoomed)
- 16 ms binning (zoomed)
- 8 ms binning (zoomed)
- 2 ms binning (zoomed)
- SN=5 or 10 s binning (full-time range)
- Raw light curve
Spectra
Notes:
- 1) The fitting includes the systematic errors.
- 2) When the burst includes telescope slew time periods, the fitting uses an average response file made from multiple 5-s response files through out the slew time plus single time preiod for the non-slew times, and weighted by the total counts in the corresponding time period using addrmf. An average response file is needed becuase a spectral fit using the pre-slew DRM will introduce some errors in both a spectral shape and a normalization if the PHA file contains a lot of the slew/post-slew time interval.
- 3) For fits to more complicated models (e.g. a power-law over a cutoff power-law), the BAT team has decided to require a chi-square improvement of more than 6 for each extra dof.
Time averaged spectrum fit using the average DRM
Power-law model
Time interval is from    0.000 sec. to   33.400 sec.

Spectral model in power-law:
------------------------------------------------------------
Parameters  : value       lower 90%   higher 90%
Photon index: -1.3406     ( -0.0445202   0.0446184 )
Norm@50keV  : 1.17058E-02    ( -0.000275463   0.000275424 )
------------------------------------------------------------
#Fit statistic : Chi-Squared =          55.23 using 59 PHA bins.
# Reduced chi-squared =         0.9689 for     57 degrees of freedom
# Null hypothesis probability =   5.417842e-01

Photon flux (15-150 keV)    in 33.4 sec: 1.40754 ( -0.03629  0.03637 ) ph/cm2/s
Energy fluence (15-150 keV)             : 3.82717e-06 ( -9.53029e-08  9.53593e-08 ) ergs/cm2
Cutoff power-law model
Time interval is from    0.000 sec. to   33.400 sec.
Spectral model in the cutoff power-law:
------------------------------------------------------------
Parameters  : value       lower 90%   higher 90%
Photon index: -1.08897     ( -0.175113   0.182344 )
Epeak [keV] : 204.346      ( -62.1432 305.593 )
Norm@50keV  : 1.51529E-02    ( -0.00243063   0.00301895 )
------------------------------------------------------------
#Fit statistic : Chi-Squared =          49.12 using 59 PHA bins.
# Reduced chi-squared =         0.8771 for     56 degrees of freedom
# Null hypothesis probability =   7.309116e-01

Photon flux (15-150 keV)    in 33.4 sec: 1.38227 ( -0.03989  0.04001 ) ph/cm2/s
Energy fluence (15-150 keV)             : 3.76562e-06 ( -1.04812e-07  1.04433e-07 ) ergs/cm2
1-s peak spectrum fit
Power-law model
Time interval is from    2.784 sec. to    3.784 sec.

Spectral model in power-law:
------------------------------------------------------------
Parameters  : value       lower 90%   higher 90%
Photon index: -1.12141     ( -0.0516546   0.0517999 )
Norm@50keV  : 7.29850E-02    ( -0.00216017   0.00215957 )
------------------------------------------------------------
#Fit statistic : Chi-Squared =          46.25 using 59 PHA bins.
# Reduced chi-squared =         0.8114 for     57 degrees of freedom
# Null hypothesis probability =   8.449151e-01

Photon flux (15-150 keV)    in 1 sec: 0.498174 (    ) ph/cm2/s
Energy fluence (15-150 keV)             : 7.58019e-07 ( -2.44516e-08  2.45092e-08 ) ergs/cm2
Cutoff power-law model
Time interval is from    2.784 sec. to    3.784 sec.
Spectral model in the cutoff power-law:
------------------------------------------------------------
Parameters  : value       lower 90%   higher 90%
Photon index: -0.699286     ( -0.214115   0.224616 )
Epeak [keV] : 176.843      ( -41.9068 117.172 )
Norm@50keV  : 0.112536    ( -0.0216746   0.0282039 )
------------------------------------------------------------
#Fit statistic : Chi-Squared =          34.45 using 59 PHA bins.
# Reduced chi-squared =         0.6152 for     56 degrees of freedom
# Null hypothesis probability =   9.896347e-01

Photon flux (15-150 keV)    in 1 sec: 8.32476 ( -0.27043  0.27071 ) ph/cm2/s
Energy fluence (15-150 keV)             : 1.83493e-07 ( -2.50839e-08  1.35904e-08 ) ergs/cm2
Time-resolved spectra
Distribution
T90 vs. Hardness ratio plot
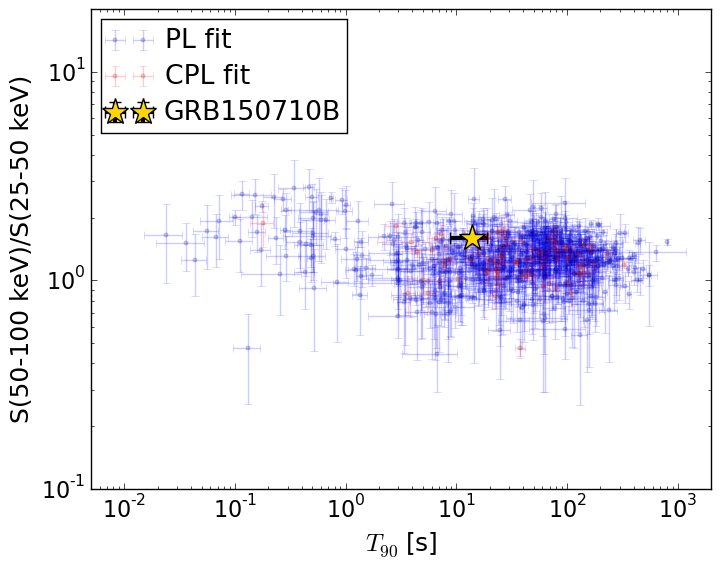
T90                                   = 13.84 sec.
Hardness ratio (energy fluence ratio) = 1.59426254034
S(15-50 keV) vs. S(50-150 keV) plot
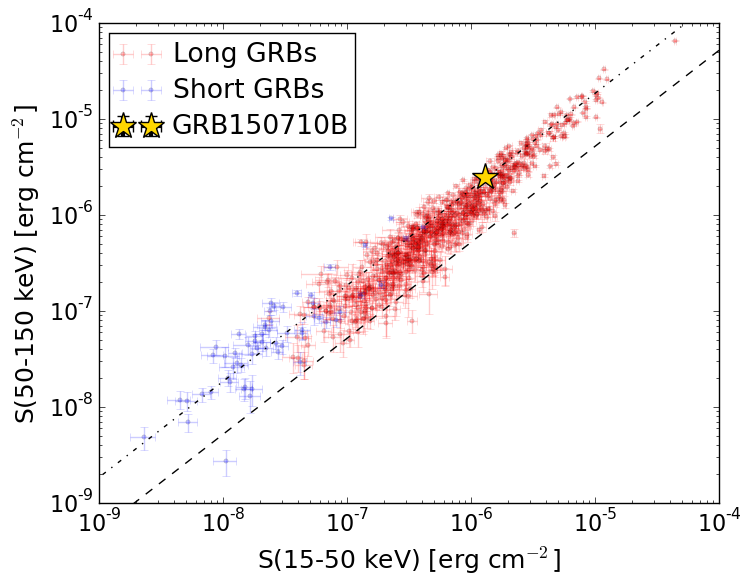
S(15-50 keV)  = 1.2851829e-06
S(50-150 keV) = 2.480385e-06
The dash-dotted line and the dashed line traces the fluences calculated from the Band function with Epeak = 15 and 150 keV, respectively. Both lines assume a canonical values of alpha = -1 and beta = -2.5.
Mask shadow pattern
Mask shadow pattern unavailable because this burst occurs during telescope slews.Spacecraft aspect plot