Analysis Summary
Notes:
- 1) No attempt has been made to eliminate the non-significant decimal places.
- 2) This batgrbproduct analysis is done using the HEASARC data.
- 3) This batgrbproduct analysis is using the flight position for the mask-weighting calculation.
======================================================================
BAT GRB EVENT DATA PROCESSING REPORT
Process Script Ver: batgrbproduct v2.46
Process Start Time: Fri Aug 7 22:51:25 EDT 2015
Host Name: bat1
Current Working Dir: /local/data/bat1/alien/Swift_3rdBATcatalog/event/batevent_reproc/trigger648601
======================================================================
Trigger: 00648601 Segment: 000
BAT Trigger Time: 458331798.528 [s; MET]
Trigger Stop: 458331799.552 [s; MET]
UTC: 2015-07-11T18:23:03.688560 [includes UTCF correction]
Where From?: TDRSS position message
BAT
RA: 221.630798971157 Dec: -35.4711122907382 [deg; J2000]
Catalogged Source?: NO
Point Source?: YES
GRB Indicated?: YES [ by BAT flight software ]
Image S/N Ratio: 7.97
Image Trigger?: NO
Rate S/N Ratio: 11.5758369027902 [ if not an image trigger ]
Image S/N Ratio: 7.97
Analysis Position: [ source = BAT ]
RA: 221.630798971157 Dec: -35.4711122907382 [deg; J2000]
Refined Position: [ source = BAT pre-slew burst ]
RA: 221.623855138741 Dec: -35.4635038038544 [deg; J2000]
{ 14h 46m 29.7s , -35d 27' 48.6" }
+/- 0.98787408924078 [arcmin] (estimated 90% radius based on SNR)
+/- 0.43551830832634 [arcmin] (formal 1-sigma fit error)
SNR: 30.9519154679182
Angular difference between the analysis and refined position is 0.568806 arcmin
Partial Coding Fraction: 0.328125 [ including projection effects ]
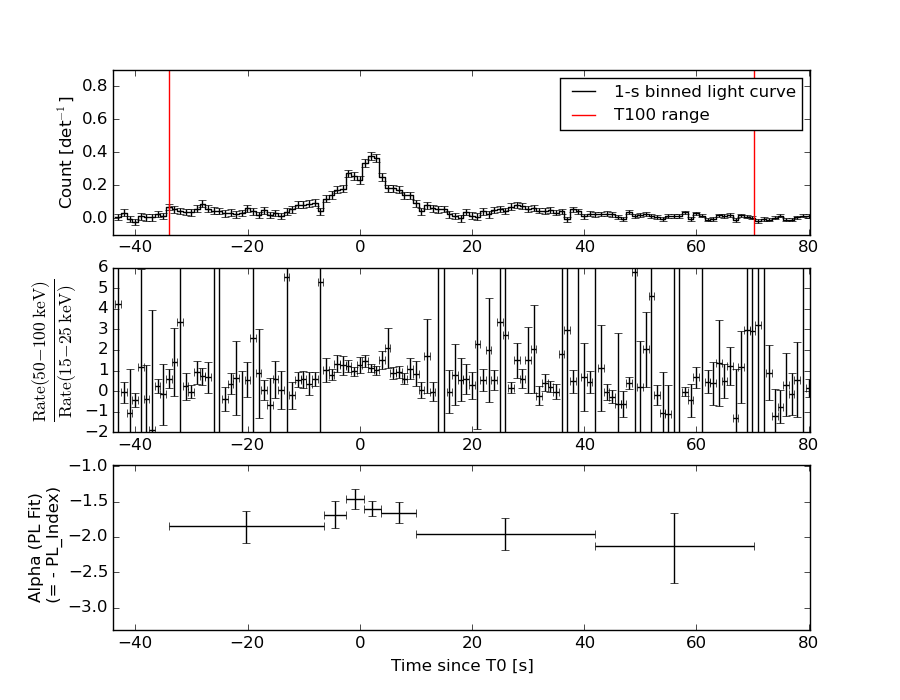
Duration
T90: 70.9559999108315 +/- 14.2134365852416
Measured from: -27.9599999785423
to: 42.9959999322891 [s; relative to TRIGTIME]
T50: 14.4839999079704 +/- 3.43186306616897
Measured from: -4.13999998569489
to: 10.3439999222755 [s; relative to TRIGTIME]
Fluence
Peak Flux (peak 1 second)
Measured from: 1.98000001907349
to: 2.98000001907349 [s; relative to TRIGTIME]
Total Fluence
Measured from: -34.0600000023842
to: 70.2360000014305 [s; relative to TRIGTIME]
Band 1 Band 2 Band 3 Band 4
15-25 25-50 50-100 100-350 keV
Total 1.854910 2.638138 1.738202 0.420428
0.109263 0.101325 0.085054 0.070752 [error]
Peak 0.100968 0.145833 0.118864 0.046866
0.013447 0.013305 0.012262 0.008959 [error]
[ fluence units of on-axis counts / fully illuminated detector ]
======================================================================
====== Table of the duration information =============================
Value tstart tstop
T100 104.296 -34.060 70.236
T90 70.956 -27.960 42.996
T50 14.484 -4.140 10.344
Peak 1.000 1.980 2.980
====== Spectral Analysis Summary =====================================
Model : spectral model: simple power-law (PL) and cutoff power-law (CPL)
Ph_index : photon index: E^{Ph_index}
Ph_90err : 90% error of the photon index
Epeak : Epeak in keV
Epeak_90err: 90% error of Epeak
Norm : normalization at 50 keV in both the PL model and CPL model
Nomr_90err : 90% error of the normalization
chi2 : Chi-Squared
dof : degree of freedo
=== Time-averaged spectral analysis ===
(Best model with acceptable fit: N/A)
Model Ph_index Ph_90err_low Ph_90err_hi Epeak Epeak_90err_low Epeak_90err_hi Norm Nomr_90err_low Norm_90err_hi chi2 dof
PL -1.775 -0.085 0.085 - - - 4.44e-03 -2.13e-04 2.12e-04 71.100 57
CPL -1.483 -0.322 0.355 89.793 -25.048 -89.793 6.20e-03 -1.84e-03 3.02e-03 68.820 56
=== 1-s peak spectral analysis ===
(Best model with acceptable fit: PL)
Model Ph_index Ph_90err_low Ph_90err_hi Epeak Epeak_90err_low Epeak_90err_hi Norm Nomr_90err_low Norm_90err_hi chi2 dof
PL -1.538 -0.172 0.170 - - - 2.98e-02 -2.86e-03 2.85e-03 45.630 57
CPL -1.541 -0.168 0.176 9999.350 -9999.350 -9999.350 2.99e-02 -2.99e-02 1.54e-02 45.650 56
=== Fluence/Peak Flux Summary ===
Model Band1 Band2 Band3 Band4 Band5 Total
15-25 25-50 50-100 100-350 15-150 15-350 keV
Fluence PL 7.66e-07 1.19e-06 1.39e-06 3.14e-06 4.27e-06 6.49e-06 erg/cm2
90%_error_low -6.26e-08 -5.91e-08 -8.68e-08 -4.03e-07 -2.08e-07 -4.72e-07 erg/cm2
90%_error_hi 6.43e-08 5.89e-08 8.66e-08 4.41e-07 2.09e-07 4.98e-07 erg/cm2
Peak flux PL 1.27e+00 1.25e+00 8.63e-01 9.37e-01 3.77e+00 4.33e+00 ph/cm2/s
90%_error_low -2.20e-01 -1.35e-01 -1.02e-01 -2.13e-01 -3.80e-01 -4.10e-01 ph/cm2/s
90%_error_hi 2.33e-01 1.33e-01 1.00e-01 2.47e-01 3.82e-01 4.10e-01 ph/cm2/s
Fluence CPL 7.25e-07 1.22e-06 1.42e-06 2.09e-06 4.19e-06 5.45e-06 erg/cm2
90%_error_low -7.64e-08 -6.85e-08 -9.31e-08 -7.37e-07 -2.21e-07 -7.71e-07 erg/cm2
90%_error_hi 7.81e-08 6.95e-08 9.43e-08 1.18e-06 2.29e-07 1.23e-06 erg/cm2
Peak flux CPL 1.27e+00 1.23e+00 8.64e-01 9.34e-01 3.80e+00 4.52e+00 ph/cm2/s
90%_error_low N/A N/A N/A N/A -4.19e-01 -6.90e-01 ph/cm2/s
90%_error_hi N/A N/A N/A N/A 3.43e-01 2.13e-01 ph/cm2/s
======================================================================
Image
Pre-slew 15.0-350.0 keV image (Event data)
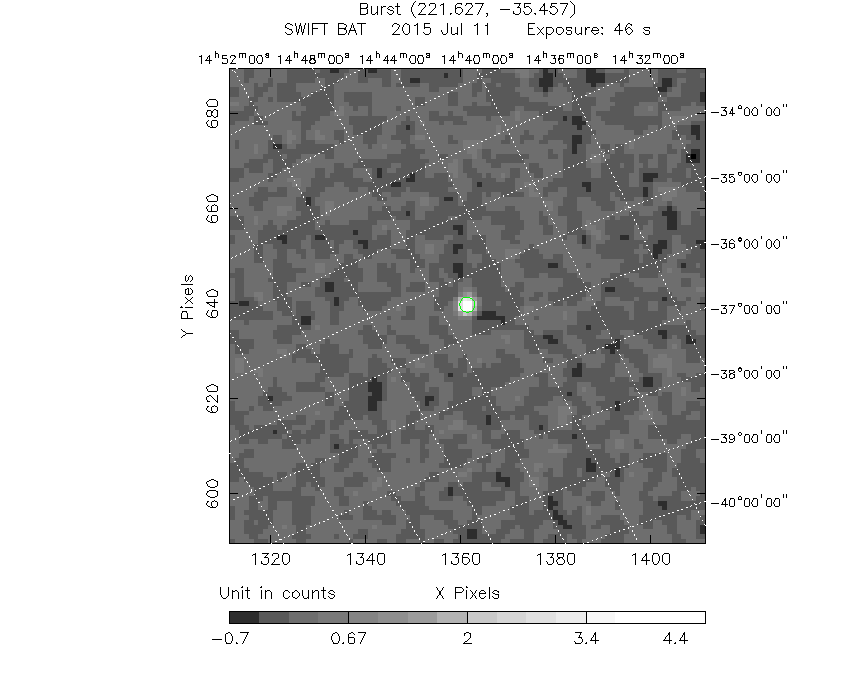
#   RAcent    DECcent   POSerr    Theta     Phi              Peak Cts       SNR   Name
  221.6239   -35.4635   0.0062    46.9040  -161.2942         5.3206865     30.952 TRIG_00648601

Foreground time interval of the image:
-34.060  12.373 (delta_t =  46.433 [sec])
Background time interval of the image:
-239.528 -34.060 (delta_t = 205.468 [sec])
Light Curves
Note: The mask-weighted lightcurves have units of either count/det or counts/sec/det, where a det is 0.4 x 0.4 = 0.16 sq cm.
Full-time range; 1 s binning
Other quick-look light curves:
- 64 ms binning (zoomed)
- 16 ms binning (zoomed)
- 8 ms binning (zoomed)
- 2 ms binning (zoomed)
- SN=5 or 10 s binning (full-time range)
- Raw light curve
Spectra
- 64 ms binning (zoomed)
- 16 ms binning (zoomed)
- 8 ms binning (zoomed)
- 2 ms binning (zoomed)
- SN=5 or 10 s binning (full-time range)
- Raw light curve
Spectra
Notes:
- 1) The fitting includes the systematic errors.
- 2) When the burst includes telescope slew time periods, the fitting uses an average response file made from multiple 5-s response files through out the slew time plus single time preiod for the non-slew times, and weighted by the total counts in the corresponding time period using addrmf. An average response file is needed becuase a spectral fit using the pre-slew DRM will introduce some errors in both a spectral shape and a normalization if the PHA file contains a lot of the slew/post-slew time interval.
- 3) For fits to more complicated models (e.g. a power-law over a cutoff power-law), the BAT team has decided to require a chi-square improvement of more than 6 for each extra dof.
Time averaged spectrum fit using the average DRM
Power-law model
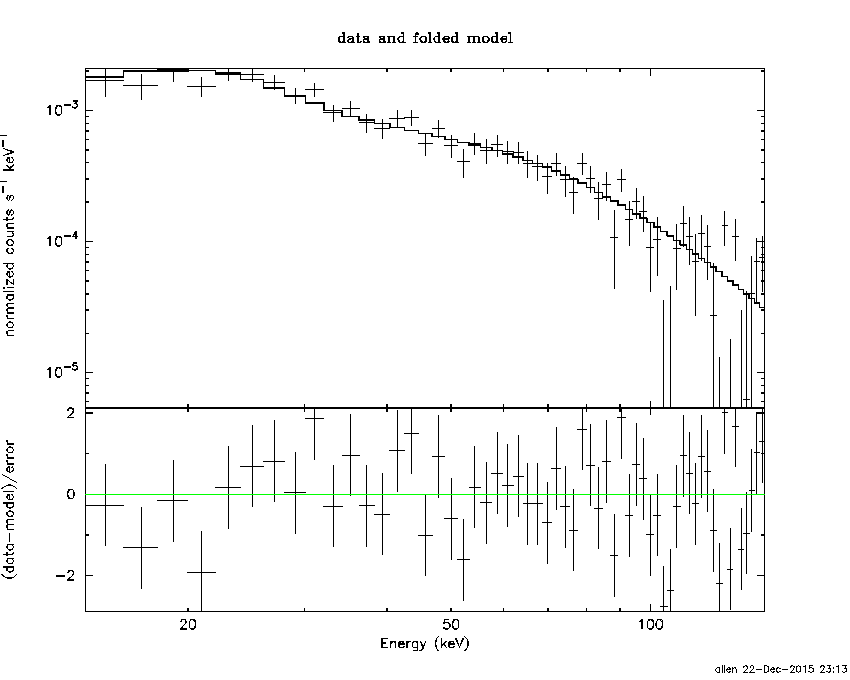
Time interval is from  -34.060 sec. to   70.236 sec.

Spectral model in power-law:
------------------------------------------------------------
Parameters  : value       lower 90%   higher 90%
Photon index: -1.77451     ( -0.0852805   0.0845965 )
Norm@50keV  : 4.44390E-03    ( -0.000212592   0.000212049 )
------------------------------------------------------------
#Fit statistic : Chi-Squared =          71.10 using 59 PHA bins.
# Reduced chi-squared =          1.247 for     57 degrees of freedom
# Null hypothesis probability =   9.913289e-02

Photon flux (15-150 keV)    in 104.3 sec: 0.606445 ( -0.030751  0.030867 ) ph/cm2/s
Energy fluence (15-150 keV)             : 4.27213e-06 ( -2.08403e-07  2.08968e-07 ) ergs/cm2
Cutoff power-law model
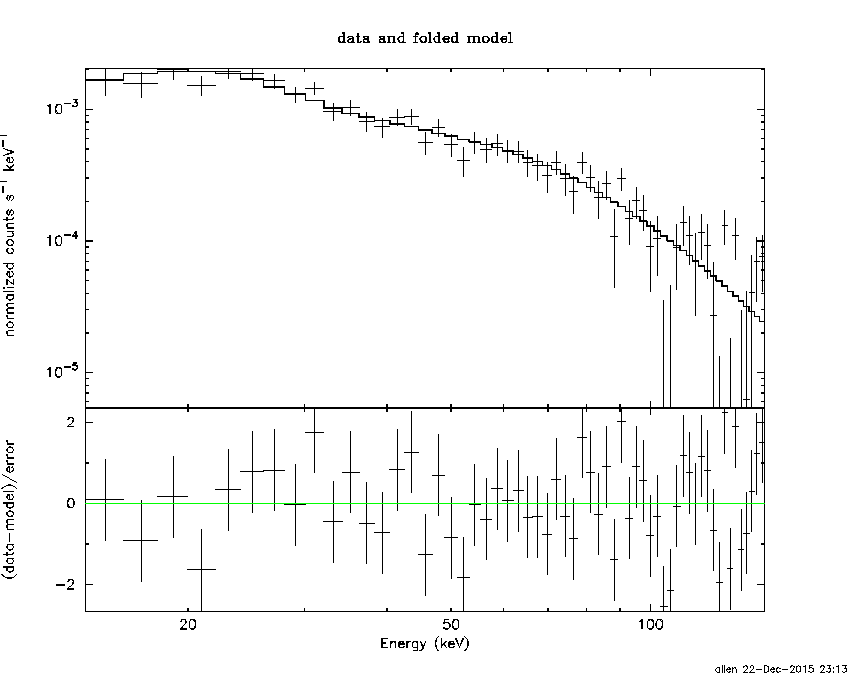
Time interval is from  -34.060 sec. to   70.236 sec.
Spectral model in the cutoff power-law:
------------------------------------------------------------
Parameters  : value       lower 90%   higher 90%
Photon index: -1.48251     ( -0.321561   0.3546 )
Epeak [keV] : 89.7934      ( -25.0477 -89.7936 )
Norm@50keV  : 6.20471E-03    ( -0.00184077   0.00301905 )
------------------------------------------------------------
#Fit statistic : Chi-Squared =          68.82 using 59 PHA bins.
# Reduced chi-squared =          1.229 for     56 degrees of freedom
# Null hypothesis probability =   1.166938e-01

Photon flux (15-150 keV)    in 104.3 sec: 0.595489 ( -0.03296  0.033085 ) ph/cm2/s
Energy fluence (15-150 keV)             : 4.18739e-06 ( -2.20923e-07  2.29473e-07 ) ergs/cm2
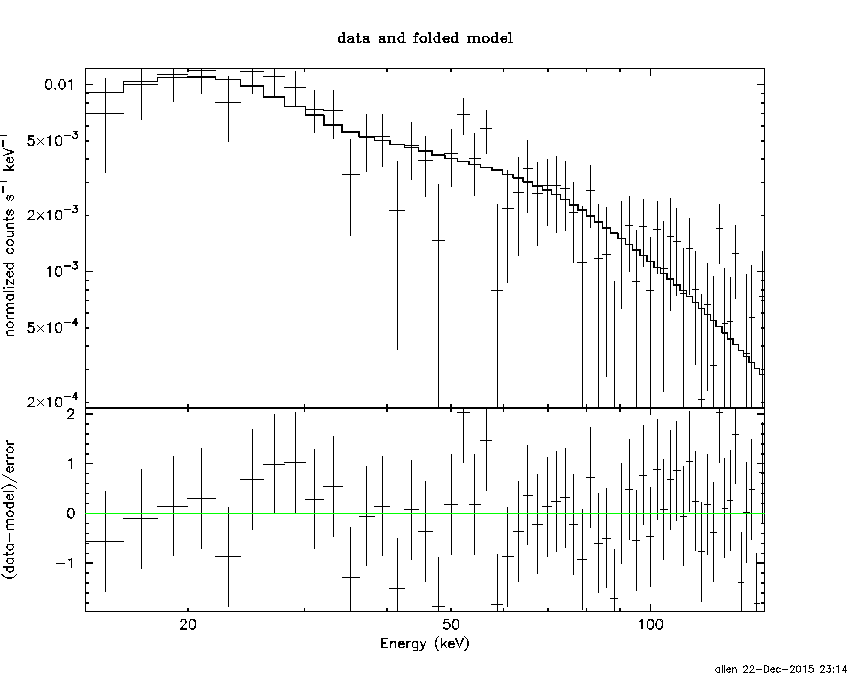
1-s peak spectrum fit
Power-law model

Time interval is from    1.980 sec. to    2.980 sec.

Spectral model in power-law:
------------------------------------------------------------
Parameters  : value       lower 90%   higher 90%
Photon index: -1.53799     ( -0.171868   0.170255 )
Norm@50keV  : 2.98442E-02    ( -0.0028582   0.0028521 )
------------------------------------------------------------
#Fit statistic : Chi-Squared =          45.63 using 59 PHA bins.
# Reduced chi-squared =         0.8006 for     57 degrees of freedom
# Null hypothesis probability =   8.602464e-01

Photon flux (15-150 keV)    in 1 sec: 3.76519 ( -0.38026  0.38155 ) ph/cm2/s
Energy fluence (15-150 keV)             : 2.81482e-07 ( -2.86978e-08  2.87953e-08 ) ergs/cm2
Cutoff power-law model
Time interval is from    1.980 sec. to    2.980 sec.
Spectral model in the cutoff power-law:
------------------------------------------------------------
Parameters  : value       lower 90%   higher 90%
Photon index: -1.54057     ( -0.168397   0.175709 )
Epeak [keV] : 9999.35      ( -9999.36 -9999.36 )
Norm@50keV  : 2.99126E-02    ( -0.0299156   0.015408 )
------------------------------------------------------------
#Fit statistic : Chi-Squared =          45.65 using 59 PHA bins.
# Reduced chi-squared =         0.8151 for     56 degrees of freedom
# Null hypothesis probability =   8.369547e-01

Photon flux (15-150 keV)    in 1 sec: 3.80321 ( -0.41864  0.34321 ) ph/cm2/s
Energy fluence (15-150 keV)             : 2.83936e-07 ( -3.11925e-08  2.62841e-08 ) ergs/cm2
Time-resolved spectra
Distribution
T90 vs. Hardness ratio plot
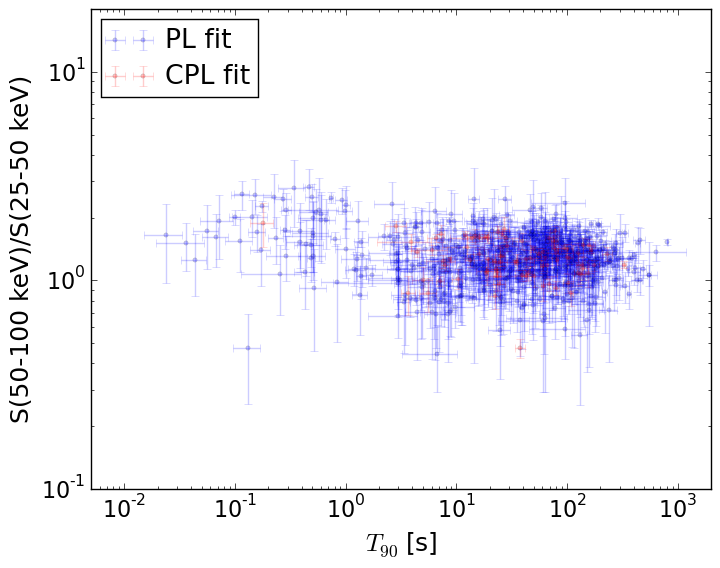
T90                                   = N/A sec.
Hardness ratio (energy fluence ratio) = N/A
S(15-50 keV) vs. S(50-150 keV) plot
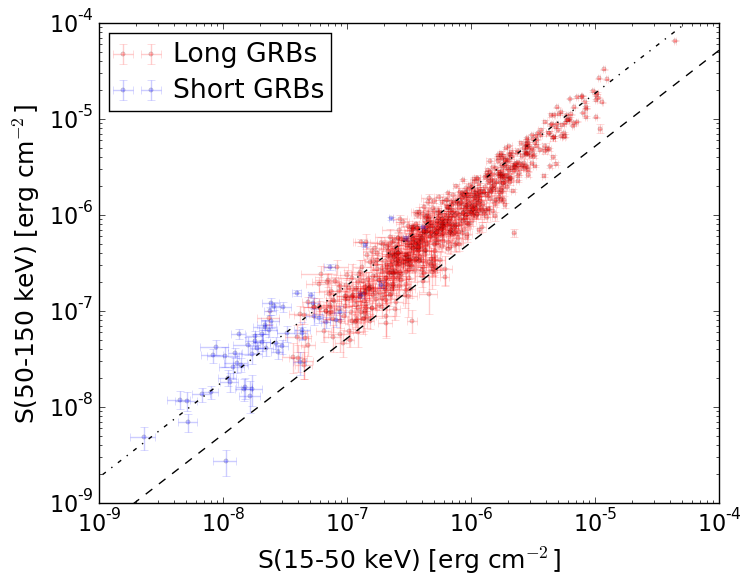
S(15-50 keV)  = N/A
S(50-150 keV) = N/A
The dash-dotted line and the dashed line traces the fluences calculated from the Band function with Epeak = 15 and 150 keV, respectively. Both lines assume a canonical values of alpha = -1 and beta = -2.5.
Mask shadow pattern
IMX = -1.012317140710808E+00, IMY = 3.427650886563163E-01
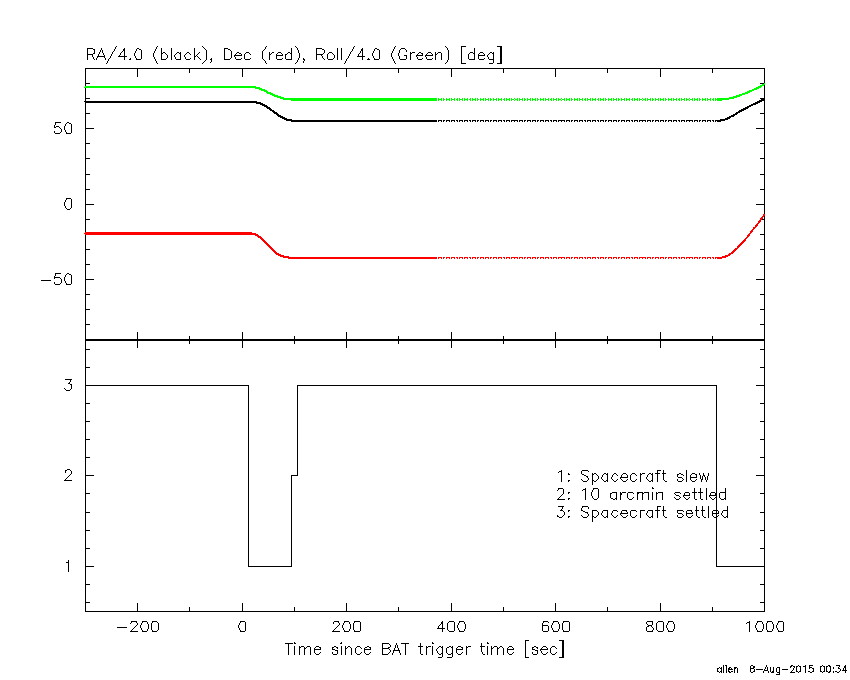
Spacecraft aspect plot
Bright source in the pre-burst/pre-slew/post-slew images
Pre-burst image of 15-350 keV band
Time interval of the image:
-239.528000 -34.060000

# RAcent  DECcent POSerr Theta    Phi  PeakCts   SNR AngSep     Name
#  [deg]    [deg]    ['] [deg]  [deg]                   [']
244.9902 -15.6599    0.4  25.9 -126.4   6.2080  28.6    1.3	Sco X-1
255.9866 -37.8441   56.1  23.1  173.2  -0.0410  -0.2    0.0	4U 1700-377
256.4354 -36.4231    2.5  21.8  175.0   0.8555   4.6    0.0	GX 349+2
262.9160 -24.7917    5.2   9.9 -164.9   0.4090   2.2    5.8	GX 1+4
264.7709 -44.4361    5.8  25.7  151.4   0.4383   2.0    1.5	4U 1735-44
268.4319  -1.3169    4.2  18.4  -51.6   0.4922   2.7    9.0	SW J1753.5-0127
270.1014 -25.1338    6.8   6.0  155.8   0.3241   1.7   10.5	GX 5-1
270.2710 -25.6802    4.3   6.5  153.1   0.5477   3.0    4.1	GRS 1758-258
274.0571 -14.0352    3.4   5.7  -19.5   0.6067   3.4    3.0	GX 17+2
275.9195 -30.3454    2.6  11.5  122.1   0.7830   4.4    1.3	H1820-303
284.8993 -25.0113    6.6  13.2   77.0  -0.3585  -1.7    9.2	HT1900.1-2455
288.7965  10.9452  120.9  34.6  -10.4  -0.0214  -0.1    0.1	GRS 1915+105
262.9380 -33.8203   12.6  16.5  166.8   0.1572   0.9    2.7	GX 354-0
238.1211 -62.9364    2.5  49.3  159.1   2.7350   4.7 ------	UNKNOWN
309.6726  21.8633    2.4  55.3    3.2   3.8905   4.7 ------	UNKNOWN
238.1680   4.5671    3.9  41.0  -98.1   2.9234   3.0 ------	UNKNOWN
222.4224 -12.0337    3.6  48.1 -129.3   2.5910   3.2 ------	UNKNOWN
Pre-slew background subtracted image of 15-350 keV band
Time interval of the image:
-34.060000 12.372620

# RAcent  DECcent POSerr Theta    Phi  PeakCts   SNR AngSep     Name
#  [deg]    [deg]    ['] [deg]  [deg]                   [']
244.9906 -15.4277    0.0  26.0 -125.9   0.0391   0.4   12.8	Sco X-1
255.9037 -37.7179    7.0  23.0  173.5  -0.1477  -1.6    8.5	4U 1700-377
256.5478 -36.2999    9.0  21.6  175.0  -0.1135  -1.3    9.2	GX 349+2
263.1646 -24.8117   23.5   9.8 -165.6  -0.0382  -0.5    9.4	GX 1+4
264.9677 -44.4898   12.2  25.8  151.1  -0.0899  -0.9    9.9	4U 1735-44
268.3503  -1.3357    8.3  18.4  -51.9   0.1171   1.4    7.1	SW J1753.5-0127
270.2689 -25.0085   11.0   5.8  154.7   0.0847   1.1    4.3	GX 5-1
270.2296 -25.5916   12.4   6.4  153.6   0.0815   1.0    9.9	GRS 1758-258
273.9218 -14.1636   17.2   5.6  -20.3  -0.0501  -0.7    9.1	GX 17+2
275.7576 -30.4414   20.5  11.6  123.0   0.0457   0.6    9.7	H1820-303
285.0479 -24.9083    6.0  13.3   76.3   0.1671   1.9    1.0	HT1900.1-2455
288.7018  10.9405   19.9  34.5  -10.5  -0.0561  -0.6    5.7	GRS 1915+105
263.2416 -33.8289    0.0  16.4  166.0  -0.1074  -1.4   12.6	GX 354-0
303.8030 -50.9623    2.6  40.3  108.6   1.4015   4.4 ------	UNKNOWN
224.2891 -47.7894    2.5  47.7 -178.3   0.7976   4.7 ------	UNKNOWN
221.6239 -35.4635    0.4  46.9 -161.3   5.3209  31.0 ------	UNKNOWN
Post-slew image of 15-350 keV band
Time interval of the image:
94.972590 907.972590

# RAcent  DECcent POSerr Theta    Phi  PeakCts   SNR AngSep     Name
#  [deg]    [deg]    ['] [deg]  [deg]                   [']
170.2007 -60.6516    7.5  41.0 -151.6   1.6969   1.5    3.8	Cen X-3
186.8587 -62.8617    3.7  34.8 -160.2   2.4273   3.1    7.8	GX 301-2
244.9706 -15.6329    0.4  28.8   45.1  26.2077  32.7    0.7	Sco X-1
256.0625 -37.6908    5.8  27.6   97.6  -1.8930  -2.0    9.9	4U 1700-377
256.4810 -36.5162    7.5  28.1   95.2   1.5594   1.5    6.0	GX 349+2
263.1442 -24.7948    4.6  37.2   77.7   4.6697   2.5    7.9	GX 1+4
264.6214 -44.3489    9.7  33.8  111.3  -1.4902  -1.2    8.0	4U 1735-44
262.9928 -33.8294   58.1  33.8   92.2   0.2747   0.2    0.4	GX 354-0
233.1349 -41.8381    2.8  11.0  121.6   2.2733   4.1 ------	UNKNOWN
233.0246 -13.8436    2.6  23.9   20.9   2.6616   4.4 ------	UNKNOWN
209.5819 -64.7240    1.0  30.2 -177.1   7.5358  11.6 ------	UNKNOWN
224.1541   6.8484    3.1  42.4   -3.6   3.7220   3.7 ------	UNKNOWN
222.8213  -2.8596    2.6  32.6   -5.1   3.2215   4.5 ------	UNKNOWN
158.3137 -44.9704    4.2  48.0 -129.1   9.0970   2.8 ------	UNKNOWN