Analysis Summary
Notes:
- 1) No attempt has been made to eliminate the non-significant decimal places.
- 2) This batgrbproduct analysis is done using the HEASARC data.
- 3) This batgrbproduct analysis is using the flight position for the mask-weighting calculation.
======================================================================
                  BAT GRB EVENT DATA PROCESSING REPORT
    Process Script Ver: batgrbproduct v2.46
    Process Start Time: Fri Aug  7 22:48:32 EDT 2015
             Host Name: bat1
   Current Working Dir: /local/data/bat1/alien/Swift_3rdBATcatalog/event/batevent_reproc/trigger649157
======================================================================

  Trigger: 00649157      Segment: 000

  BAT Trigger Time: 458723217.92   [s; MET]
      Trigger Stop: 458723218.944   [s; MET]
               UTC: 2015-07-16T07:06:43.060080    [includes UTCF correction]
       Where From?: TDRSS position message

  BAT
    RA: 278.46659588295   Dec: -13.0170497349609  [deg; J2000]

     Catalogged Source?: NO
     Point Source?:      YES
     GRB Indicated?:     YES    [ by BAT flight software ]
     Image S/N Ratio:    7.13
     Image Trigger?:     NO
     Rate S/N Ratio:     13.490737563232  [ if not an image trigger ]
     Image S/N Ratio:    7.13

  Analysis Position:   [ source = BAT ]
    RA: 278.46659588295   Dec: -13.0170497349609  [deg; J2000]

  Refined Position:   [ source = BAT pre-slew burst ]
    RA: 278.486348402472   Dec: -12.9754591064619  [deg; J2000]
        { 18h 33m 56.7s , -12d 58' 31.7" }
         +/- 1.00312987941412 [arcmin] (estimated 90% radius based on SNR)
         +/- 0.334493647122253 [arcmin] (formal 1-sigma fit error)
    SNR: 30.2816524461249

  Angular difference between the analysis and refined position is 2.749683 arcmin

  Partial Coding Fraction: 0.9140625    [ including projection effects ]

  Duration
     T90: 42.567999958992 +/- 5.58947724938619
        Measured from: -2.33200001716614
                   to: 40.2359999418259     [s; relative to TRIGTIME]
     T50: 17.8039999604225 +/- 2.14725871765236
        Measured from: 3.83599996566772
                   to: 21.6399999260902     [s; relative to TRIGTIME]


  Fluence
     Peak Flux  (peak 1 second)
        Measured from: 9.69199997186661
                   to: 10.6919999718666     [s; relative to TRIGTIME]
     Total Fluence
        Measured from: -4.19200003147125
                   to: 47.1439999938011     [s; relative to TRIGTIME]

             Band 1     Band 2     Band 3     Band 4
              15-25      25-50     50-100    100-350     keV
 Total     0.684868   0.968080   0.673103   0.126000
           0.045822   0.042901   0.036249   0.030608 [error]
 Peak      0.040034   0.040077   0.020141   0.007255
           0.006649   0.006154   0.005279   0.004180 [error]

     [ fluence units of on-axis counts / fully illuminated detector ]

======================================================================


====== Table of the duration information =============================

        Value   tstart    tstop
T100   51.336   -4.192   47.144
T90    42.568   -2.332   40.236
T50    17.804    3.836   21.640
Peak    1.000    9.692   10.692


====== Spectral Analysis Summary =====================================

Model      : spectral model: simple power-law (PL) and cutoff power-law (CPL)
Ph_index   : photon index: E^{Ph_index}
Ph_90err   : 90% error of the photon index
Epeak      : Epeak in keV
Epeak_90err: 90% error of Epeak
Norm       : normalization at 50 keV in both the PL model and CPL model
Nomr_90err : 90% error of the normalization
chi2       : Chi-Squared
dof        : degree of freedo

=== Time-averaged spectral analysis ===
(Best model with acceptable fit: PL)

Model Ph_index Ph_90err_low Ph_90err_hi  Epeak  Epeak_90err_low  Epeak_90err_hi  Norm       Nomr_90err_low    Norm_90err_hi    chi2    dof
PL      -1.534    -0.095      0.095       -           -               -         3.05e-03     -1.61e-04          1.61e-04      64.780   57
CPL     -1.006    -0.390      0.429       94.478     -22.225       114.333      5.58e-03     -1.97e-03          3.43e-03      59.260   56


=== 1-s peak spectral analysis ===
(Best model with acceptable fit: PL)

Model Ph_index Ph_90err_low Ph_90err_hi  Epeak  Epeak_90err_low  Epeak_90err_hi  Norm       Nomr_90err_low    Norm_90err_hi    chi2    dof
PL      -1.796     -0.328     0.307       -           -               -         5.99e-03     -1.23e-03          1.19e-03      47.780   57
CPL     -1.334     -0.810     1.620       63.556     -49.419       -63.556      1.08e-02     -1.08e-02          7.93e-02      47.350   56


=== Fluence/Peak Flux Summary ===

              Model    Band1     Band2     Band3     Band4     Band5     Total
                       15-25     25-50    50-100    100-350    15-150    15-350    keV
Fluence         PL   2.06e-07  3.71e-07  5.13e-07  1.47e-06  1.48e-06  2.56e-06   erg/cm2
      90%_error_low -1.89e-08 -2.06e-08 -3.54e-08 -2.11e-07 -8.47e-08 -2.38e-07   erg/cm2
      90%_error_hi   1.95e-08  2.05e-08  3.53e-08  2.34e-07  8.52e-08  2.57e-07   erg/cm2
Peak flux       PL   3.28e-01  2.77e-01  1.60e-01  1.37e-01  8.24e-01  9.01e-01   ph/cm2/s
      90%_error_low -8.38e-02 -4.81e-02 -4.20e-02 -5.95e-02 -1.43e-01 -1.58e-01   ph/cm2/s
      90%_error_hi   8.87e-02  4.80e-02  4.23e-02  8.22e-02  1.43e-01  1.59e-01   ph/cm2/s

Fluence        CPL   1.87e-07  3.88e-07  5.26e-07  7.01e-07  1.41e-06  1.80e-06   erg/cm2
      90%_error_low -2.33e-08 -2.43e-08 -3.84e-08 -2.71e-07 -9.72e-08 -2.87e-07   erg/cm2
      90%_error_hi   2.37e-08  2.47e-08  3.88e-08  4.88e-07  9.74e-08  4.91e-07   erg/cm2
Peak flux      CPL   3.11e-01  2.92e-01  1.61e-01  7.44e-02  8.09e-01  8.38e-01   ph/cm2/s
      90%_error_low -9.69e-02 -6.19e-02 -4.75e-02 -7.44e-02 -1.49e-01 -1.70e-01   ph/cm2/s
      90%_error_hi   9.84e-02  6.55e-02  4.61e-02  8.27e-02  1.48e-01  1.83e-01   ph/cm2/s

======================================================================
Image
Pre-slew 15.0-350.0 keV image (Event data)
#   RAcent    DECcent   POSerr    Theta     Phi              Peak Cts       SNR   Name
  278.4863   -12.9755   0.0063    13.0783    56.2112         1.4986007     30.282 TRIG_00649157

Foreground time interval of the image:
 -4.192  13.381 (delta_t =  17.573 [sec])
Background time interval of the image:
-239.920  -4.192 (delta_t = 235.728 [sec])
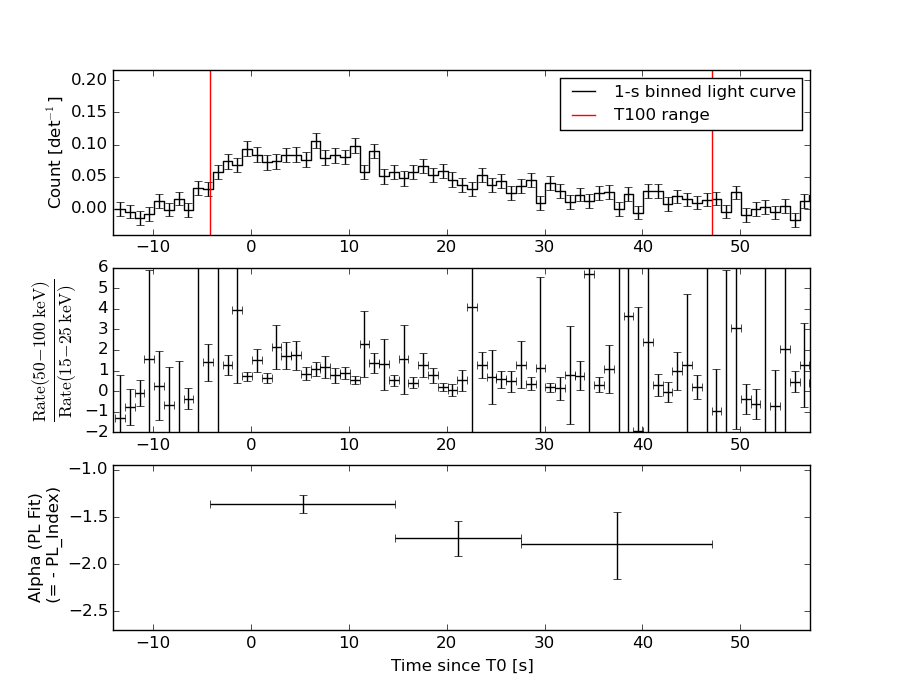
Light Curves
Note: The mask-weighted lightcurves have units of either count/det or counts/sec/det, where a det is 0.4 x 0.4 = 0.16 sq cm.
Full-time range; 1 s binning
Other quick-look light curves:
- 64 ms binning (zoomed)
- 16 ms binning (zoomed)
- 8 ms binning (zoomed)
- 2 ms binning (zoomed)
- SN=5 or 10 s binning (full-time range)
- Raw light curve
Spectra
- 64 ms binning (zoomed)
- 16 ms binning (zoomed)
- 8 ms binning (zoomed)
- 2 ms binning (zoomed)
- SN=5 or 10 s binning (full-time range)
- Raw light curve
Spectra
Notes:
- 1) The fitting includes the systematic errors.
- 2) When the burst includes telescope slew time periods, the fitting uses an average response file made from multiple 5-s response files through out the slew time plus single time preiod for the non-slew times, and weighted by the total counts in the corresponding time period using addrmf. An average response file is needed becuase a spectral fit using the pre-slew DRM will introduce some errors in both a spectral shape and a normalization if the PHA file contains a lot of the slew/post-slew time interval.
- 3) For fits to more complicated models (e.g. a power-law over a cutoff power-law), the BAT team has decided to require a chi-square improvement of more than 6 for each extra dof.
Time averaged spectrum fit using the average DRM
Power-law model
Time interval is from   -4.192 sec. to   47.144 sec.

Spectral model in power-law:
------------------------------------------------------------
Parameters  : value       lower 90%   higher 90%
Photon index: -1.53412     ( -0.0950769   0.0946912 )
Norm@50keV  : 3.04669E-03    ( -0.000161248   0.000160896 )
------------------------------------------------------------
#Fit statistic : Chi-Squared =          64.78 using 59 PHA bins.
# Reduced chi-squared =          1.136 for     57 degrees of freedom
# Null hypothesis probability =   2.236970e-01

Photon flux (15-150 keV)    in 51.34 sec: 0.383954 ( -0.020693  0.020739 ) ph/cm2/s
Energy fluence (15-150 keV)             : 1.47613e-06 ( -8.46566e-08  8.52013e-08 ) ergs/cm2
Cutoff power-law model
Time interval is from   -4.192 sec. to   47.144 sec.
Spectral model in the cutoff power-law:
------------------------------------------------------------
Parameters  : value       lower 90%   higher 90%
Photon index: -1.00573     ( -0.389639   0.42915 )
Epeak [keV] : 94.4785      ( -22.2255 114.333 )
Norm@50keV  : 5.57724E-03    ( -0.00196649   0.00342964 )
------------------------------------------------------------
#Fit statistic : Chi-Squared =          59.26 using 59 PHA bins.
# Reduced chi-squared =          1.058 for     56 degrees of freedom
# Null hypothesis probability =   3.576634e-01

Photon flux (15-150 keV)    in 51.34 sec: 0.371913 ( -0.022424  0.022437 ) ph/cm2/s
Energy fluence (15-150 keV)             : 1.41074e-06 ( -9.71579e-08  9.73838e-08 ) ergs/cm2
1-s peak spectrum fit
Power-law model
Time interval is from    9.692 sec. to   10.692 sec.

Spectral model in power-law:
------------------------------------------------------------
Parameters  : value       lower 90%   higher 90%
Photon index: -1.79646     ( -0.328315   0.307401 )
Norm@50keV  : 5.98850E-03    ( -0.00122654   0.00118734 )
------------------------------------------------------------
#Fit statistic : Chi-Squared =          47.78 using 59 PHA bins.
# Reduced chi-squared =         0.8382 for     57 degrees of freedom
# Null hypothesis probability =   8.028877e-01

Photon flux (15-150 keV)    in 1 sec: 0.824114 ( -0.143098  0.143187 ) ph/cm2/s
Energy fluence (15-150 keV)             : 5.51455e-08 ( -1.12389e-08  1.15613e-08 ) ergs/cm2
Cutoff power-law model
Time interval is from    9.692 sec. to   10.692 sec.
Spectral model in the cutoff power-law:
------------------------------------------------------------
Parameters  : value       lower 90%   higher 90%
Photon index: -1.33426     ( -0.809982   1.62054 )
Epeak [keV] : 63.5560      ( -49.422 -63.5592 )
Norm@50keV  : 1.08445E-02    ( -0.0108437   0.0792631 )
------------------------------------------------------------
#Fit statistic : Chi-Squared =          47.35 using 59 PHA bins.
# Reduced chi-squared =         0.8456 for     56 degrees of freedom
# Null hypothesis probability =   7.880564e-01

Photon flux (15-150 keV)    in 1 sec: 0.809417 ( -0.148919  0.148071 ) ph/cm2/s
Energy fluence (15-150 keV)             : 5.2672e-08 ( -1.27612e-08  1.28806e-08 ) ergs/cm2
Time-resolved spectra
Distribution
T90 vs. Hardness ratio plot
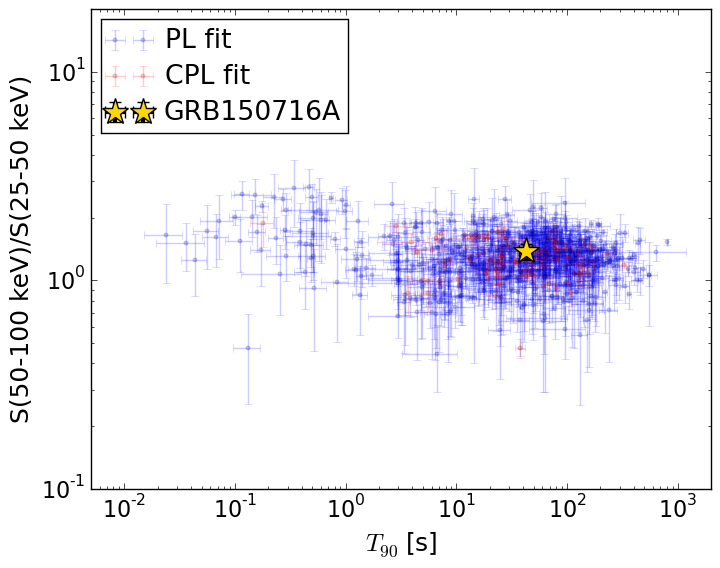
T90                                   = 42.568 sec.
Hardness ratio (energy fluence ratio) = 1.38121110188
S(15-50 keV) vs. S(50-150 keV) plot
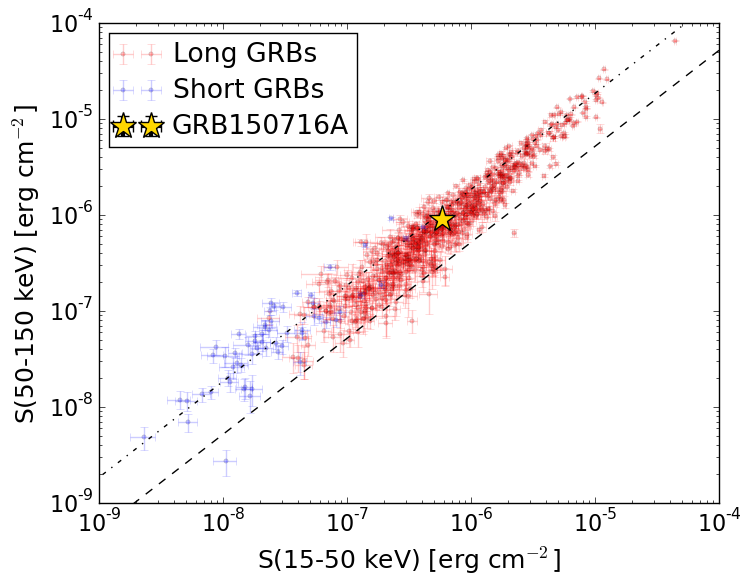
S(15-50 keV)  = 5.77357e-07
S(50-150 keV) = 8.98794e-07
The dash-dotted line and the dashed line traces the fluences calculated from the Band function with Epeak = 15 and 150 keV, respectively. Both lines assume a canonical values of alpha = -1 and beta = -2.5.
Mask shadow pattern
IMX = 1.291940800163469E-01, IMY = -1.930691838926180E-01
Spacecraft aspect plot
Bright source in the pre-burst/pre-slew/post-slew images
Pre-burst image of 15-350 keV band
Time interval of the image:
-239.920000 -4.192000

# RAcent  DECcent POSerr Theta    Phi  PeakCts   SNR AngSep     Name
#  [deg]    [deg]    ['] [deg]  [deg]                   [']
244.9841 -15.6354    0.3  21.6  -82.5   8.6520  34.6    0.4	Sco X-1
254.3821  35.3859    6.7  57.0  -13.8   1.6128   1.7    4.5	Her X-1
255.9810 -37.8422    0.4  20.0 -154.8   6.8037  28.6    0.3	4U 1700-377
256.3578 -36.4268    3.6  18.7 -153.2   0.7486   3.2    3.8	GX 349+2
263.1814 -24.6041    0.0   5.7 -141.3   0.5060   2.3   12.7	GX 1+4
264.5624 -44.2929   31.2  24.1 -176.8   0.0843   0.4   12.2	4U 1735-44
268.4664  -1.4921   14.5  18.9    2.6   0.1715   0.8    6.4	SW J1753.5-0127
270.2910 -25.0643    3.6   5.5  148.0   0.7215   3.2    1.0	GX 5-1
270.2023 -25.7026    3.4   6.1  151.9   0.7749   3.5    5.9	GRS 1758-258
273.9442 -13.9630    5.7   9.1   45.1   0.4090   2.0    5.7	GX 17+2
275.9209 -30.3698    2.7  12.8  142.2   0.9756   4.3    0.3	H1820-303
284.9958 -25.0694   17.5  17.1  108.1   0.1648   0.7    9.2	HT1900.1-2455
288.9506  10.7921   33.9  37.8   35.1   0.1437   0.3   12.9	GRS 1915+105
262.9617 -33.8144    3.2  14.0 -166.7   0.7804   3.6    1.8	GX 354-0
283.8324 -22.8876    2.5  15.7  101.1   1.0830   4.6 ------	UNKNOWN
263.4842  30.8994    2.9  51.3   -5.4   2.0947   3.9 ------	UNKNOWN
Pre-slew background subtracted image of 15-350 keV band
Time interval of the image:
-4.192000 13.380590

# RAcent  DECcent POSerr Theta    Phi  PeakCts   SNR AngSep     Name
#  [deg]    [deg]    ['] [deg]  [deg]                   [']
245.1310 -15.5190    7.0  21.5  -82.1   0.0943   1.6   11.4	Sco X-1
254.5674  35.3492    5.3  56.9  -13.6  -0.4344  -2.2    5.4	Her X-1
256.1477 -38.0125    0.0  20.1 -155.4   0.1501   3.1   12.7	4U 1700-377
256.4875 -36.2789    5.2  18.5 -153.2   0.1025   2.2    9.0	GX 349+2
262.8470 -24.6944    3.6   5.9 -139.7   0.1539   3.2    9.3	GX 1+4
264.7683 -44.3007    4.8  24.1 -177.1   0.1220   2.4    9.0	4U 1735-44
268.5094  -1.4866   10.0  18.9    2.7  -0.0567  -1.2    8.7	SW J1753.5-0127
270.2835 -25.0926   13.5   5.6  148.3   0.0429   0.9    0.8	GX 5-1
270.2719 -25.6618   38.2   6.1  151.2  -0.0168  -0.3    5.2	GRS 1758-258
273.9481 -13.8876    8.1   9.1   44.8  -0.0696  -1.4    9.5	GX 17+2
276.1012 -30.5075    0.0  13.0  142.1  -0.0809  -1.7   12.4	H1820-303
284.8645 -24.8532    7.5  16.9  107.4  -0.0831  -1.5   10.2	HT1900.1-2455
288.9430  10.8531   10.6  37.8   35.1   0.0973   1.1   10.2	GRS 1915+105
262.8187 -33.7495    6.0  14.0 -166.2  -0.0893  -1.9    9.9	GX 354-0
311.9585 -37.5077    2.0  42.3  122.5   1.2204   5.9 ------	UNKNOWN
283.7079  -5.0724    2.3  22.1   47.3   0.2867   5.0 ------	UNKNOWN
278.4864 -12.9754    0.4  13.1   56.2   1.4987  30.3 ------	UNKNOWN
275.5814   6.0622    2.3  27.6   16.9   0.2945   5.1 ------	UNKNOWN
245.1807   4.2751    2.1  32.7  -45.1   0.3301   5.4 ------	UNKNOWN
220.2578 -30.0702    2.7  43.3 -114.1   0.8243   4.3 ------	UNKNOWN
214.2304 -44.4375    2.5  49.7 -133.0   0.9591   4.6 ------	UNKNOWN
Post-slew image of 15-350 keV band
Time interval of the image:
65.580590 422.380000
840.080000 962.117900

# RAcent  DECcent POSerr Theta    Phi  PeakCts   SNR AngSep     Name
#  [deg]    [deg]    ['] [deg]  [deg]                   [']
245.0015 -15.6480    2.3  32.5 -128.4  17.9414   5.0    1.4	Sco X-1
255.9676 -37.8578    2.6  31.9 -174.8  12.5289   4.4    1.2	4U 1700-377
256.5050 -36.5613   12.2  30.7 -173.6   2.6693   0.9    8.9	GX 349+2
263.0820 -24.6096    6.9  18.6 -160.4   4.3114   1.7    9.1	GX 1+4
264.9384 -44.3651    6.4  33.4  168.1  -5.8385  -1.8    9.8	4U 1735-44
268.2595  -1.4975   18.6  15.3  -71.8   1.5401   0.6    7.0	SW J1753.5-0127
270.3286 -25.1432    6.0  14.4 -178.5   4.8696   1.9    4.5	GX 5-1
270.3495 -25.8987    4.2  15.0  179.9  -6.9360  -2.8    9.7	GRS 1758-258
274.2020 -13.9754   10.6   4.3 -133.2   2.7082   1.1   12.0	GX 17+2
276.1606 -30.3112    0.0  17.4  157.1  -2.8326  -1.2   12.7	H1820-303
284.9924 -25.0654    9.6  13.5  124.3   3.1874   1.2    9.0	HT1900.1-2455
288.6944  11.0384    7.5  26.1   -6.3  -3.7183  -1.5    8.3	GRS 1915+105
299.6253  35.1772    7.6  52.2   -7.7   8.2867   1.5    2.3	Cyg X-1
262.8272 -33.7891    4.7  25.2 -177.8   5.8906   2.4    8.5	GX 354-0
291.0356 -39.8806    2.9  29.1  130.3  13.5278   4.0 ------	UNKNOWN
316.6962  28.8202    3.0  55.8   11.3  45.6120   3.8 ------	UNKNOWN
272.4901 -46.2264    2.7  33.6  157.9  14.7517   4.2 ------	UNKNOWN
294.8157  -3.7740    2.9  18.6   32.0   8.5404   3.9 ------	UNKNOWN
244.3114 -46.5046    3.1  44.1 -175.9  16.6439   3.8 ------	UNKNOWN