Analysis Summary
Notes:
- 1) No attempt has been made to eliminate the non-significant decimal places.
- 2) This batgrbproduct analysis is done using the HEASARC data.
- 3) This batgrbproduct analysis is using the flight position for the mask-weighting calculation.
======================================================================
                  BAT GRB EVENT DATA PROCESSING REPORT
    Process Script Ver: batgrbproduct v2.46
    Process Start Time: Fri Aug  7 22:36:19 EDT 2015
             Host Name: bat1
   Current Working Dir: /local/data/bat1/alien/Swift_3rdBATcatalog/event/batevent_reproc/trigger650141
======================================================================

  Trigger: 00650141      Segment: 000

  BAT Trigger Time: 459409610.88   [s; MET]
      Trigger Stop: 459409612.928   [s; MET]
               UTC: 2015-07-24T05:46:35.984200    [includes UTCF correction]
       Where From?: TDRSS position message

  BAT
    RA: 97.5395976716236   Dec: -19.1535017233648  [deg; J2000]

     Catalogged Source?: NO
     Point Source?:      YES
     GRB Indicated?:     YES    [ by BAT flight software ]
     Image S/N Ratio:    7.19
     Image Trigger?:     NO
     Rate S/N Ratio:     9.64365076099295  [ if not an image trigger ]
     Image S/N Ratio:    7.19

  Analysis Position:   [ source = BAT ]
    RA: 97.5395976716236   Dec: -19.1535017233648  [deg; J2000]

  Refined Position:   [ source = BAT pre-slew burst ]
    RA: 97.5500159653381   Dec: -19.149950895894  [deg; J2000]
        { 06h 30m 12.0s , -19d 08' 59.8" }
         +/- 1.77072557306103 [arcmin] (estimated 90% radius based on SNR)
         +/- 0.873218114968808 [arcmin] (formal 1-sigma fit error)
    SNR: 13.4467267822412

  Angular difference between the analysis and refined position is 0.627759 arcmin

  Partial Coding Fraction: 0.484375    [ including projection effects ]

  Duration
     T90: 280.007999956608 +/- 43.9618534887909
        Measured from: 1.23600000143051
                   to: 281.243999958038     [s; relative to TRIGTIME]
     T50: 199.8599999547 +/- 5.43473861011519
        Measured from: 24.8840000033379
                   to: 224.743999958038     [s; relative to TRIGTIME]


  Fluence
     Peak Flux  (peak 1 second)
        Measured from: 24.0839999914169
                   to: 25.0839999914169     [s; relative to TRIGTIME]
     Total Fluence
        Measured from: -1.07199996709824
                   to: 325.420000016689     [s; relative to TRIGTIME]

             Band 1     Band 2     Band 3     Band 4
              15-25      25-50     50-100    100-350     keV
 Total     1.435485   1.646309   0.691322   0.271984
           0.101247   0.103609   0.087157   0.072734 [error]
 Peak      0.028951   0.046641   0.029332   0.009758
           0.008185   0.008689   0.007237   0.005904 [error]

     [ fluence units of on-axis counts / fully illuminated detector ]

======================================================================


====== Table of the duration information =============================

        Value   tstart    tstop
T100  326.492   -1.072  325.420
T90   280.008    1.236  281.244
T50   199.860   24.884  224.744
Peak    1.000   24.084   25.084


====== Spectral Analysis Summary =====================================

Model      : spectral model: simple power-law (PL) and cutoff power-law (CPL)
Ph_index   : photon index: E^{Ph_index}
Ph_90err   : 90% error of the photon index
Epeak      : Epeak in keV
Epeak_90err: 90% error of Epeak
Norm       : normalization at 50 keV in both the PL model and CPL model
Nomr_90err : 90% error of the normalization
chi2       : Chi-Squared
dof        : degree of freedo

=== Time-averaged spectral analysis ===
(Best model with acceptable fit: PL)

Model Ph_index Ph_90err_low Ph_90err_hi  Epeak  Epeak_90err_low  Epeak_90err_hi  Norm       Nomr_90err_low    Norm_90err_hi    chi2    dof
PL      -1.991    -0.148      0.143       -           -               -         7.07e-04     -6.72e-05          6.61e-05      69.280   57
CPL     -1.432    -0.646      0.785       42.125     -34.105       -42.125      1.49e-03     -8.46e-04          2.77e-03      67.180   56


=== 1-s peak spectral analysis ===
(Best model with acceptable fit: PL)

Model Ph_index Ph_90err_low Ph_90err_hi  Epeak  Epeak_90err_low  Epeak_90err_hi  Norm       Nomr_90err_low    Norm_90err_hi    chi2    dof
PL      -1.640     -0.374     0.362       -           -               -         7.28e-03     -1.70e-03          1.67e-03      53.600   57
CPL     -1.020     -0.951     1.906       75.786      N/A           N/A         1.55e-02        N/A               N/A         53.060   56


=== Fluence/Peak Flux Summary ===

              Model    Band1     Band2     Band3     Band4     Band5     Total
                       15-25     25-50    50-100    100-350    15-150    15-350    keV
Fluence         PL   4.68e-07  6.39e-07  6.43e-07  1.17e-06  2.13e-06  2.92e-06   erg/cm2
      90%_error_low -5.20e-08 -4.90e-08 -8.29e-08 -2.76e-07 -1.91e-07 -3.72e-07   erg/cm2
      90%_error_hi   5.32e-08  4.90e-08  8.40e-08  3.29e-07  1.93e-07  4.11e-07   erg/cm2
Peak flux       PL   3.43e-01  3.18e-01  2.04e-01  2.01e-01  9.48e-01  1.07e+00   ph/cm2/s
      90%_error_low -1.16e-01 -7.37e-02 -5.88e-02 -9.47e-02 -2.14e-01 -2.36e-01   ph/cm2/s
      90%_error_hi   1.26e-01  7.28e-02  5.79e-02  1.32e-01  2.14e-01  2.37e-01   ph/cm2/s

Fluence        CPL   4.46e-07  6.81e-07  6.23e-07  4.46e-07  2.00e-06  2.20e-06   erg/cm2
      90%_error_low -5.94e-08 -6.92e-08 -1.02e-07 -2.90e-07 -2.32e-07 -3.82e-07   erg/cm2
      90%_error_hi   5.94e-08  7.17e-08  9.38e-08  8.13e-07  2.41e-07  9.34e-07   erg/cm2
Peak flux      CPL   3.14e-01  3.41e-01  2.14e-01  1.03e-01  9.33e-01  9.72e-01   ph/cm2/s
      90%_error_low -1.34e-01 -4.67e-02 -6.51e-02 -1.03e-01 -2.17e-01 -2.42e-01   ph/cm2/s
      90%_error_hi   1.41e-01  9.76e-02  6.82e-02  1.36e-01  2.17e-01  2.58e-01   ph/cm2/s

======================================================================
Image
Pre-slew 15.0-350.0 keV image (Event data)

#   RAcent    DECcent   POSerr    Theta     Phi              Peak Cts       SNR   Name
   97.5500   -19.1500   0.0143    37.4735  -139.7054         1.2131293     13.447 TRIG_00650141

Foreground time interval of the image:
 -1.072  29.421 (delta_t =  30.493 [sec])
Background time interval of the image:
-156.479  -1.072 (delta_t = 155.407 [sec])
Light Curves
Note: The mask-weighted lightcurves have units of either count/det or counts/sec/det, where a det is 0.4 x 0.4 = 0.16 sq cm.
Full-time range; 1 s binning
Other quick-look light curves:
- 64 ms binning (zoomed)
- 16 ms binning (zoomed)
- 8 ms binning (zoomed)
- 2 ms binning (zoomed)
- SN=5 or 10 s binning (full-time range)
- Raw light curve
Spectra
- 64 ms binning (zoomed)
- 16 ms binning (zoomed)
- 8 ms binning (zoomed)
- 2 ms binning (zoomed)
- SN=5 or 10 s binning (full-time range)
- Raw light curve
Spectra
Notes:
- 1) The fitting includes the systematic errors.
- 2) When the burst includes telescope slew time periods, the fitting uses an average response file made from multiple 5-s response files through out the slew time plus single time preiod for the non-slew times, and weighted by the total counts in the corresponding time period using addrmf. An average response file is needed becuase a spectral fit using the pre-slew DRM will introduce some errors in both a spectral shape and a normalization if the PHA file contains a lot of the slew/post-slew time interval.
- 3) For fits to more complicated models (e.g. a power-law over a cutoff power-law), the BAT team has decided to require a chi-square improvement of more than 6 for each extra dof.
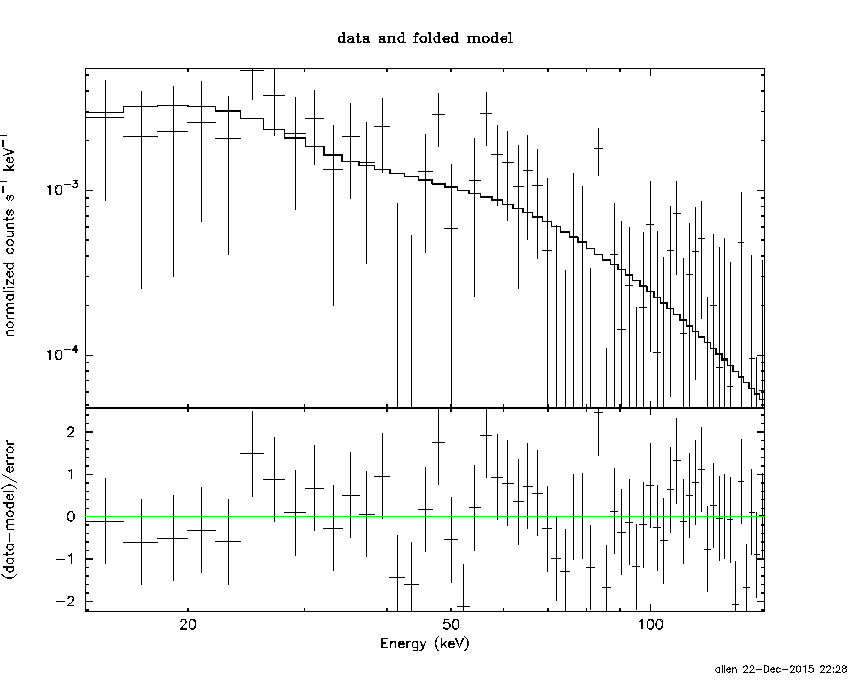
Time averaged spectrum fit using the average DRM
Power-law model

Time interval is from   -1.072 sec. to  325.420 sec.

Spectral model in power-law:
------------------------------------------------------------
Parameters  : value       lower 90%   higher 90%
Photon index: -1.99132     ( -0.14771   0.142559 )
Norm@50keV  : 7.06841E-04    ( -6.71842e-05   6.60973e-05 )
------------------------------------------------------------
#Fit statistic : Chi-Squared =          69.28 using 59 PHA bins.
# Reduced chi-squared =          1.215 for     57 degrees of freedom
# Null hypothesis probability =   1.275057e-01

Photon flux (15-150 keV)    in 326.5 sec: 0.105613 ( -0.0081713  0.008176 ) ph/cm2/s
Energy fluence (15-150 keV)             : 2.12766e-06 ( -1.90514e-07  1.93326e-07 ) ergs/cm2
Cutoff power-law model

Time interval is from   -1.072 sec. to  325.420 sec.
Spectral model in the cutoff power-law:
------------------------------------------------------------
Parameters  : value       lower 90%   higher 90%
Photon index: -1.43213     ( -0.646413   0.784288 )
Epeak [keV] : 42.1252      ( -34.1037 -42.1235 )
Norm@50keV  : 1.48817E-03    ( -0.000846644   0.00276554 )
------------------------------------------------------------
#Fit statistic : Chi-Squared =          67.18 using 59 PHA bins.
# Reduced chi-squared =          1.200 for     56 degrees of freedom
# Null hypothesis probability =   1.455662e-01

Photon flux (15-150 keV)    in 326.5 sec: 0.103119 ( -0.008709  0.008667 ) ph/cm2/s
Energy fluence (15-150 keV)             : 2.00149e-06 ( -2.32343e-07  2.4081e-07 ) ergs/cm2
1-s peak spectrum fit
Power-law model
Time interval is from   24.084 sec. to   25.084 sec.

Spectral model in power-law:
------------------------------------------------------------
Parameters  : value       lower 90%   higher 90%
Photon index: -1.6402     ( -0.37413   0.361876 )
Norm@50keV  : 7.28116E-03    ( -0.00169936   0.00167115 )
------------------------------------------------------------
#Fit statistic : Chi-Squared =          53.60 using 59 PHA bins.
# Reduced chi-squared =         0.9403 for     57 degrees of freedom
# Null hypothesis probability =   6.034373e-01

Photon flux (15-150 keV)    in 1 sec: 0.947728 ( -0.213835  0.214342 ) ph/cm2/s
Energy fluence (15-150 keV)             : 6.77969e-08 ( -1.64399e-08  1.66454e-08 ) ergs/cm2
Cutoff power-law model

Time interval is from   24.084 sec. to   25.084 sec.
Spectral model in the cutoff power-law:
------------------------------------------------------------
Parameters  : value       lower 90%   higher 90%
Photon index: -1.01965     ( -0.951427   1.90593 )
Epeak [keV] : 75.7860      (   )
Norm@50keV  : 1.55332E-02    (     )
------------------------------------------------------------
#Fit statistic : Chi-Squared =          53.06 using 59 PHA bins.
# Reduced chi-squared =         0.9474 for     56 degrees of freedom
# Null hypothesis probability =   5.870442e-01

Photon flux (15-150 keV)    in 1 sec: 0.933452 ( -0.216933  0.217038 ) ph/cm2/s
Energy fluence (15-150 keV)             : 6.53266e-08 ( -1.73544e-08  1.76164e-08 ) ergs/cm2
Time-resolved spectra

Distribution
T90 vs. Hardness ratio plot
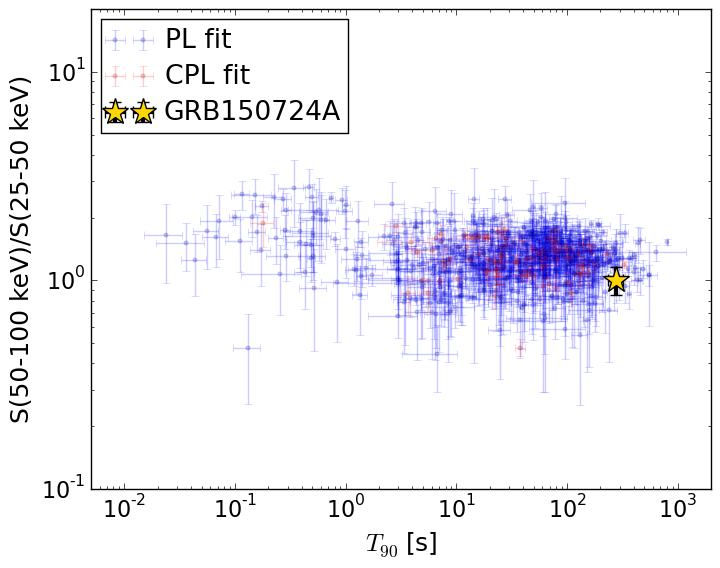
T90                                   = 280.008 sec.
Hardness ratio (energy fluence ratio) = 1.0060741182
S(15-50 keV) vs. S(50-150 keV) plot

S(15-50 keV)  = 1.1072268e-06
S(50-150 keV) = 1.0204797e-06
The dash-dotted line and the dashed line traces the fluences calculated from the Band function with Epeak = 15 and 150 keV, respectively. Both lines assume a canonical values of alpha = -1 and beta = -2.5.
Mask shadow pattern

IMX = -5.847028009758013E-01, IMY = 4.957694187770598E-01
Spacecraft aspect plot

Bright source in the pre-burst/pre-slew/post-slew images
Pre-burst image of 15-350 keV band
Time interval of the image:
-156.479410 -1.072000

# RAcent  DECcent POSerr Theta    Phi  PeakCts   SNR AngSep     Name
#  [deg]    [deg]    ['] [deg]  [deg]                   [']
135.4984 -40.5544    0.9   5.9  -40.4   1.6006  12.7    1.4	Vela X-1
170.3035 -60.5685    3.5  28.1   55.2   0.6217   3.3    3.3	Cen X-3
186.8845 -62.7841   21.1  36.2   57.0  -0.1675  -0.6    6.3	GX 301-2
 75.1641 -28.9110    2.3  45.9 -171.6   1.2076   5.0 ------	UNKNOWN
Pre-slew background subtracted image of 15-350 keV band
Time interval of the image:
-1.072000 29.420610

# RAcent  DECcent POSerr Theta    Phi  PeakCts   SNR AngSep     Name
#  [deg]    [deg]    ['] [deg]  [deg]                   [']
135.3724 -40.7293    0.0   5.7  -40.1   0.1608   2.9   12.7	Vela X-1
170.6793 -60.6529    4.7  28.3   55.2   0.1866   2.4   10.8	Cen X-3
186.9888 -62.7297    4.8  36.2   56.9   0.2957   2.4    9.4	GX 301-2
 66.6817 -40.7863    3.0  45.5  169.1   0.4874   3.8 ------	UNKNOWN
162.5606 -39.4190    2.2  24.4    5.4   0.3345   5.4 ------	UNKNOWN
 97.5496 -19.1503    0.9  37.5 -139.7   1.2126  13.4 ------	UNKNOWN
137.3155  -3.2399    1.8  42.3  -72.2   1.5340   6.3 ------	UNKNOWN
Post-slew image of 15-350 keV band
Time interval of the image:
91.620610 782.210300
840.120000 902.221600

# RAcent  DECcent POSerr Theta    Phi  PeakCts   SNR AngSep     Name
#  [deg]    [deg]    ['] [deg]  [deg]                   [']
 83.6372  22.0173    0.3  43.4 -143.0  30.5063  34.8    0.3	Crab
135.5264 -40.5603    0.8  38.8    7.7   8.6502  14.0    0.4	Vela X-1
 46.3413 -13.7108    2.8  49.3  144.1   9.5939   4.1 ------	UNKNOWN
127.5343 -42.9988    3.2  34.7   16.0   2.1770   3.6 ------	UNKNOWN
102.5352 -32.0939    2.7  13.7   37.8   1.7210   4.3 ------	UNKNOWN
 86.2235 -10.4236    3.2  14.0 -177.0   1.4456   3.6 ------	UNKNOWN
 54.6037  19.5828    2.9  57.2 -173.8   9.3291   4.0 ------	UNKNOWN
 56.5157  21.8993    3.2  57.4 -170.4   7.3067   3.6 ------	UNKNOWN