Analysis Summary
Notes:
- 1) No attempt has been made to eliminate the non-significant decimal places.
- 2) This batgrbproduct analysis is done using the HEASARC data.
- 3) This batgrbproduct analysis is using the flight position for the mask-weighting calculation.
======================================================================
BAT GRB EVENT DATA PROCESSING REPORT
Process Script Ver: batgrbproduct v2.46
Process Start Time: Sun Aug 30 18:17:40 EDT 2015
Host Name: bat1
Current Working Dir: /local/data/bat1/alien/Swift_3rdBATcatalog/event/batevent_reproc/trigger650530
======================================================================
Trigger: 00650530 Segment: 000
BAT Trigger Time: 459716537.344 [s; MET]
Trigger Stop: 459716538.368 [s; MET]
UTC: 2015-07-27T19:02:02.432140 [includes UTCF correction]
Where From?: TDRSS position message
BAT
RA: 203.990397249456 Dec: -18.354840842608 [deg; J2000]
Catalogged Source?: NO
Point Source?: YES
GRB Indicated?: YES [ by BAT flight software ]
Image S/N Ratio: 7.59
Image Trigger?: NO
Rate S/N Ratio: 14.8996644257513 [ if not an image trigger ]
Image S/N Ratio: 7.59
Analysis Position: [ source = BAT ]
RA: 203.990397249456 Dec: -18.354840842608 [deg; J2000]
Refined Position: [ source = BAT pre-slew burst ]
RA: 203.966310961544 Dec: -18.3208239248367 [deg; J2000]
{ 13h 35m 51.9s , -18d 19' 15.0" }
+/- 0.979770221175017 [arcmin] (estimated 90% radius based on SNR)
+/- 0.308361758198623 [arcmin] (formal 1-sigma fit error)
SNR: 31.318290164578
Angular difference between the analysis and refined position is 2.459176 arcmin
Partial Coding Fraction: 0.6875 [ including projection effects ]
Duration
T90: 87.9559999704361 +/- 10.9851456403465
Measured from: -4.51999998092651
to: 83.4359999895096 [s; relative to TRIGTIME]
T50: 30.3159999251366 +/- 3.71548979418876
Measured from: 5.44800001382828
to: 35.7639999389648 [s; relative to TRIGTIME]
Fluence
Peak Flux (peak 1 second)
Measured from: 9.21200001239777
to: 10.2120000123978 [s; relative to TRIGTIME]
Total Fluence
Measured from: -8.69599997997284
to: 95.944000005722 [s; relative to TRIGTIME]
Band 1 Band 2 Band 3 Band 4
15-25 25-50 50-100 100-350 keV
Total 1.015512 1.787152 1.820639 0.450057
0.064295 0.066500 0.062745 0.062563 [error]
Peak 0.026356 0.044616 0.054481 0.020034
0.007161 0.007554 0.007220 0.006885 [error]
[ fluence units of on-axis counts / fully illuminated detector ]
======================================================================
====== Table of the duration information =============================
Value tstart tstop
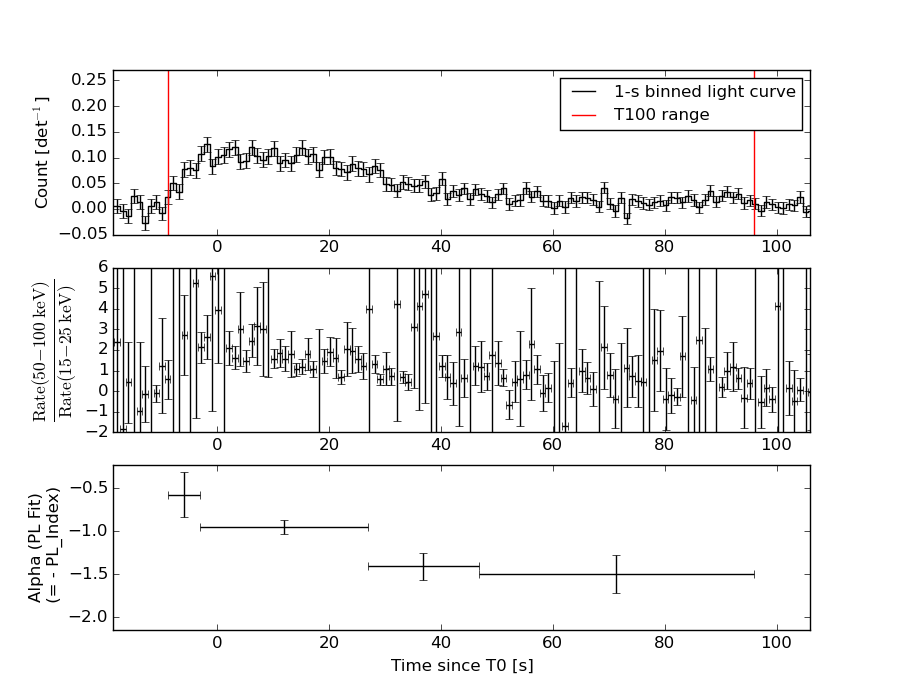
T100 104.640 -8.696 95.944
T90 87.956 -4.520 83.436
T50 30.316 5.448 35.764
Peak 1.000 9.212 10.212
====== Spectral Analysis Summary =====================================
Model : spectral model: simple power-law (PL) and cutoff power-law (CPL)
Ph_index : photon index: E^{Ph_index}
Ph_90err : 90% error of the photon index
Epeak : Epeak in keV
Epeak_90err: 90% error of Epeak
Norm : normalization at 50 keV in both the PL model and CPL model
Nomr_90err : 90% error of the normalization
chi2 : Chi-Squared
dof : degree of freedo
=== Time-averaged spectral analysis ===
(Best model with acceptable fit: N/A)
Model Ph_index Ph_90err_low Ph_90err_hi Epeak Epeak_90err_low Epeak_90err_hi Norm Nomr_90err_low Norm_90err_hi chi2 dof
PL -1.132 -0.075 0.075 - - - 3.34e-03 -1.34e-04 1.34e-04 71.040 57
CPL -0.777 -0.296 0.318 194.566 -65.653 572.498 4.80e-03 -1.23e-03 1.78e-03 66.790 56
=== 1-s peak spectral analysis ===
(Best model with acceptable fit: PL)
Model Ph_index Ph_90err_low Ph_90err_hi Epeak Epeak_90err_low Epeak_90err_hi Norm Nomr_90err_low Norm_90err_hi chi2 dof
PL -0.983 -0.309 0.326 - - - 9.00e-03 -1.53e-03 1.52e-03 54.720 57
CPL -0.989 -0.299 0.405 9999.330 -9999.330 -9999.330 9.06e-03 -1.51e-03 1.63e-02 54.720 56
=== Fluence/Peak Flux Summary ===
Model Band1 Band2 Band3 Band4 Band5 Total
15-25 25-50 50-100 100-350 15-150 15-350 keV
Fluence PL 3.16e-07 7.28e-07 1.33e-06 5.78e-06 3.61e-06 8.15e-06 erg/cm2
90%_error_low -2.60e-08 -3.52e-08 -6.25e-08 -6.15e-07 -1.60e-07 -6.49e-07 erg/cm2
90%_error_hi 2.68e-08 3.50e-08 6.23e-08 6.67e-07 1.60e-07 6.95e-07 erg/cm2
Peak flux PL 2.26e-01 3.10e-01 3.14e-01 5.77e-01 1.04e+00 1.43e+00 ph/cm2/s
90%_error_low -7.81e-02 -6.92e-02 -5.71e-02 -2.06e-01 -1.78e-01 -2.56e-01 ph/cm2/s
90%_error_hi 8.93e-02 6.70e-02 5.60e-02 2.76e-01 1.79e-01 2.74e-01 ph/cm2/s
Fluence CPL 2.89e-07 7.43e-07 1.37e-06 3.62e-06 3.53e-06 6.02e-06 erg/cm2
90%_error_low -3.35e-08 -3.80e-08 -7.18e-08 -1.10e-06 -1.76e-07 -1.10e-06 erg/cm2
90%_error_hi 3.43e-08 3.83e-08 7.27e-08 1.70e-06 1.76e-07 1.69e-06 erg/cm2
Peak flux CPL 2.31e-01 3.11e-01 3.13e-01 5.98e-01 1.04e+00 1.43e+00 ph/cm2/s
90%_error_low -1.02e-01 -7.00e-02 -5.60e-02 N/A -1.90e-01 -4.21e-01 ph/cm2/s
90%_error_hi 8.43e-02 6.74e-02 6.75e-02 N/A 1.80e-01 2.50e-01 ph/cm2/s
======================================================================
Image
Pre-slew 15.0-350.0 keV image (Event data)
#   RAcent    DECcent   POSerr    Theta     Phi              Peak Cts       SNR   Name
  203.9663   -18.3208   0.0061    25.2125  -122.2900         2.8083513     31.318 TRIG_00650530

Foreground time interval of the image:
 -8.696  19.157 (delta_t =  27.853 [sec])
Background time interval of the image:
-105.843  -8.696 (delta_t =  97.147 [sec])
Light Curves
Note: The mask-weighted lightcurves have units of either count/det or counts/sec/det, where a det is 0.4 x 0.4 = 0.16 sq cm.
Full-time range; 1 s binning
Other quick-look light curves:
- 64 ms binning (zoomed)
- 16 ms binning (zoomed)
- 8 ms binning (zoomed)
- 2 ms binning (zoomed)
- SN=5 or 10 s binning (full-time range)
- Raw light curve
Spectra
- 64 ms binning (zoomed)
- 16 ms binning (zoomed)
- 8 ms binning (zoomed)
- 2 ms binning (zoomed)
- SN=5 or 10 s binning (full-time range)
- Raw light curve
Spectra
Notes:
- 1) The fitting includes the systematic errors.
- 2) When the burst includes telescope slew time periods, the fitting uses an average response file made from multiple 5-s response files through out the slew time plus single time preiod for the non-slew times, and weighted by the total counts in the corresponding time period using addrmf. An average response file is needed becuase a spectral fit using the pre-slew DRM will introduce some errors in both a spectral shape and a normalization if the PHA file contains a lot of the slew/post-slew time interval.
- 3) For fits to more complicated models (e.g. a power-law over a cutoff power-law), the BAT team has decided to require a chi-square improvement of more than 6 for each extra dof.
Time averaged spectrum fit using the average DRM
Power-law model
Time interval is from   -8.696 sec. to   95.944 sec.

Spectral model in power-law:
------------------------------------------------------------
Parameters  : value       lower 90%   higher 90%
Photon index: -1.132     ( -0.0746462   0.0751098 )
Norm@50keV  : 3.33701E-03    ( -0.000133808   0.000133767 )
------------------------------------------------------------
#Fit statistic : Chi-Squared =          71.04 using 59 PHA bins.
# Reduced chi-squared =          1.246 for     57 degrees of freedom
# Null hypothesis probability =   9.993074e-02

Photon flux (15-150 keV)    in 104.6 sec: 0.388362 ( -0.016179  0.016206 ) ph/cm2/s
Energy fluence (15-150 keV)             : 3.61337e-06 ( -1.59768e-07  1.6046e-07 ) ergs/cm2
Cutoff power-law model
Time interval is from   -8.696 sec. to   95.944 sec.
Spectral model in the cutoff power-law:
------------------------------------------------------------
Parameters  : value       lower 90%   higher 90%
Photon index: -0.777189     ( -0.295612   0.317992 )
Epeak [keV] : 194.566      ( -65.6532 572.498 )
Norm@50keV  : 4.80441E-03    ( -0.00122957   0.00177958 )
------------------------------------------------------------
#Fit statistic : Chi-Squared =          66.79 using 59 PHA bins.
# Reduced chi-squared =          1.193 for     56 degrees of freedom
# Null hypothesis probability =   1.532620e-01

Photon flux (15-150 keV)    in 104.6 sec: 0.380030 ( -0.017536  0.017542 ) ph/cm2/s
Energy fluence (15-150 keV)             : 3.52802e-06 ( -1.76426e-07  1.75814e-07 ) ergs/cm2
1-s peak spectrum fit
Power-law model
Time interval is from    9.212 sec. to   10.212 sec.

Spectral model in power-law:
------------------------------------------------------------
Parameters  : value       lower 90%   higher 90%
Photon index: -0.982843     ( -0.308872   0.326153 )
Norm@50keV  : 9.00130E-03    ( -0.00153147   0.00151558 )
------------------------------------------------------------
#Fit statistic : Chi-Squared =          54.72 using 59 PHA bins.
# Reduced chi-squared =         0.9599 for     57 degrees of freedom
# Null hypothesis probability =   5.612463e-01

Photon flux (15-150 keV)    in 1 sec: 1.03544 ( -0.178234  0.17938 ) ph/cm2/s
Energy fluence (15-150 keV)             : 9.79445e-08 ( -1.76843e-08  1.78426e-08 ) ergs/cm2
Cutoff power-law model

Time interval is from    9.212 sec. to   10.212 sec.
Spectral model in the cutoff power-law:
------------------------------------------------------------
Parameters  : value       lower 90%   higher 90%
Photon index: -0.988659     ( -0.303541   0.400576 )
Epeak [keV] : 9999.33      ( -9999.36 -9999.36 )
Norm@50keV  : 9.05823E-03    ( -0.00150607   0.0162976 )
------------------------------------------------------------
#Fit statistic : Chi-Squared =          54.72 using 59 PHA bins.
# Reduced chi-squared =         0.9772 for     56 degrees of freedom
# Null hypothesis probability =   5.232697e-01

Photon flux (15-150 keV)    in 1 sec: 1.03863 ( -0.189786  0.18045 ) ph/cm2/s
Energy fluence (15-150 keV)             : 9.79084e-08 ( 0  0 ) ergs/cm2
Time-resolved spectra
Distribution
T90 vs. Hardness ratio plot
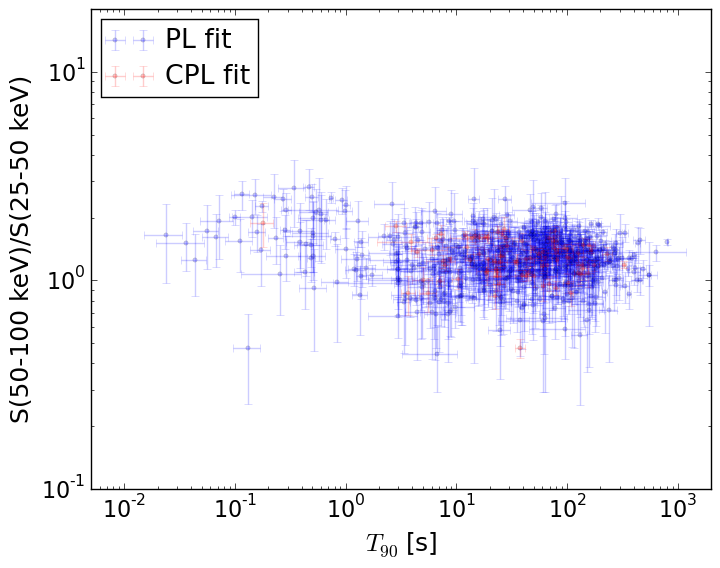
T90                                   = N/A sec.
Hardness ratio (energy fluence ratio) = N/A
S(15-50 keV) vs. S(50-150 keV) plot
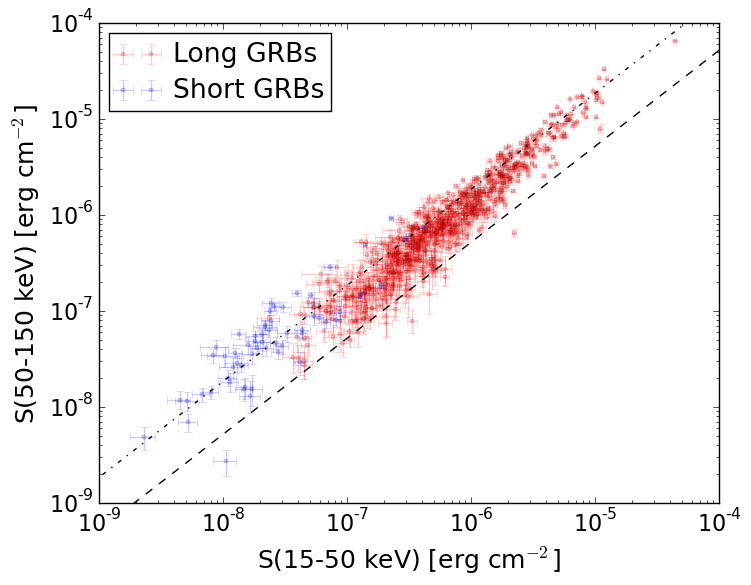
S(15-50 keV)  = N/A
S(50-150 keV) = N/A
The dash-dotted line and the dashed line traces the fluences calculated from the Band function with Epeak = 15 and 150 keV, respectively. Both lines assume a canonical values of alpha = -1 and beta = -2.5.
Mask shadow pattern
IMX = -2.515194605134363E-01, IMY = 3.980184254623811E-01
Spacecraft aspect plot
Bright source in the pre-burst/pre-slew/post-slew images
Pre-burst image of 15-350 keV band
Time interval of the image:
-105.843410 -8.696000

# RAcent  DECcent POSerr Theta    Phi  PeakCts   SNR AngSep     Name
#  [deg]    [deg]    ['] [deg]  [deg]                   [']
244.9935 -15.6395    0.5  17.7  105.1   3.6764  22.7    0.8	Sco X-1
254.5758  35.2704    6.0  50.9   19.7   0.8704   1.9    7.2	Her X-1
255.8979 -37.8333    3.0  38.1  135.2   1.1831   3.8    4.3	4U 1700-377
256.3739 -36.2976    6.2  37.4  132.9  -0.5780  -1.8    8.1	GX 349+2
262.9588 -24.6948    4.1  36.6  111.4   1.0351   2.8    4.1	GX 1+4
264.9226 -44.3937   20.7  47.5  136.3   0.3788   0.6    8.4	4U 1735-44
263.1241 -33.8455    9.3  40.5  124.7  -0.5899  -1.2    6.8	GX 354-0
263.1886 -19.4029    2.7  35.4  102.6   1.4861   4.3 ------	UNKNOWN
209.8136  31.5844    2.6  44.3  -30.8   1.0935   4.4 ------	UNKNOWN
191.8662  15.6170    3.2  43.6  -64.0   2.7289   3.6 ------	UNKNOWN
182.9748 -22.8376    2.9  45.4 -121.5   2.5888   3.9 ------	UNKNOWN
Pre-slew background subtracted image of 15-350 keV band
Time interval of the image:
-8.696000 19.156590

# RAcent  DECcent POSerr Theta    Phi  PeakCts   SNR AngSep     Name
#  [deg]    [deg]    ['] [deg]  [deg]                   [']
244.8383 -15.4871    0.0  17.5  104.8   0.1773   2.0   12.3	Sco X-1
254.3318  35.3003    4.2  50.8   19.4   0.7263   2.7    6.7	Her X-1
256.1500 -37.8624    5.3  38.2  135.0   0.4000   2.2    7.8	4U 1700-377
256.4287 -36.3018    3.4  37.4  132.8   0.5761   3.4    7.3	GX 349+2
262.9433 -24.7344    4.3  36.6  111.4  -0.5181  -2.7    3.6	GX 1+4
264.7190 -44.3665    9.6  47.4  136.4   0.4313   1.2    5.1	4U 1735-44
262.9906 -33.8320 1529.3  40.4  124.7  -0.0019  -0.0    0.2	GX 354-0
223.1598 -56.2602    2.3  47.3  175.5   0.8293   5.0 ------	UNKNOWN
203.9663 -18.3208    0.4  25.2 -122.3   2.8083  31.3 ------	UNKNOWN
Post-slew image of 15-350 keV band
Time interval of the image:
66.156600 607.256610

# RAcent  DECcent POSerr Theta    Phi  PeakCts   SNR AngSep     Name
#  [deg]    [deg]    ['] [deg]  [deg]                   [']
170.2872 -60.6043    3.2  48.6  179.3   3.7287   3.6    1.4	Cen X-3
186.8539 -62.7859    4.7  46.0  168.8   2.4104   2.4    5.5	GX 301-2
244.9982 -15.6645    1.3  39.2   70.4  16.1462   8.7    1.8	Sco X-1
233.9119 -63.1194    2.5  49.2  140.6   9.6611   4.6 ------	UNKNOWN
233.8643 -46.6319    2.5  37.4  123.7   5.3119   4.6 ------	UNKNOWN
211.2172 -27.0200    2.7  10.9  121.9   1.5829   4.3 ------	UNKNOWN
144.4702 -54.2375    4.1  57.6 -165.4   5.9252   2.8 ------	UNKNOWN
180.1259 -12.0423    2.9  23.9 -100.2   1.6581   4.0 ------	UNKNOWN
205.7712  37.1494    2.7  55.5  -20.4   5.5917   4.2 ------	UNKNOWN
155.9676 -19.3546    2.6  45.3 -121.4   9.0123   4.5 ------	UNKNOWN
152.5202 -24.6359    4.5  48.1 -129.1   5.4566   2.5 ------	UNKNOWN