Analysis Summary
Notes:
- 1) No attempt has been made to eliminate the non-significant decimal places.
- 2) This batgrbproduct analysis is done using the HEASARC data.
- 3) This batgrbproduct analysis is using the flight position for the mask-weighting calculation.
======================================================================
BAT GRB EVENT DATA PROCESSING REPORT
Process Script Ver: batgrbproduct v2.46
Process Start Time: Sun Aug 30 18:14:51 EDT 2015
Host Name: bat1
Current Working Dir: /local/data/bat1/alien/Swift_3rdBATcatalog/event/batevent_reproc/trigger650617
======================================================================
Trigger: 00650617 Segment: 000
BAT Trigger Time: 459780685.952 [s; MET]
Trigger Stop: 459780686.976 [s; MET]
UTC: 2015-07-28T12:51:11.036780 [includes UTCF correction]
Where From?: TDRSS position message
BAT
RA: 292.287805747232 Dec: 33.9039039617548 [deg; J2000]
Catalogged Source?: NO
Point Source?: YES
GRB Indicated?: YES [ by BAT flight software ]
Image S/N Ratio: 6.74
Image Trigger?: NO
Rate S/N Ratio: 7.93725393319377 [ if not an image trigger ]
Image S/N Ratio: 6.74
Analysis Position: [ source = BAT ]
RA: 292.287805747232 Dec: 33.9039039617548 [deg; J2000]
Refined Position: [ source = BAT pre-slew burst ]
RA: 292.271249895788 Dec: 33.9058805610823 [deg; J2000]
{ 19h 29m 05.1s , +33d 54' 21.2" }
+/- 2.59616397126304 [arcmin] (estimated 90% radius based on SNR)
+/- 1.14634336460646 [arcmin] (formal 1-sigma fit error)
SNR: 7.78422451294506
Angular difference between the analysis and refined position is 0.832933 arcmin
Partial Coding Fraction: 1.015625 [ including projection effects ]
Duration
T90: 0.832000017166138 +/- 0.230755269859374
Measured from: 0.303999960422516
to: 1.13599997758865 [s; relative to TRIGTIME]
T50: 0.448000013828278 +/- 0.181019365655138
Measured from: 0.431999981403351
to: 0.879999995231628 [s; relative to TRIGTIME]
Fluence
Peak Flux (peak 1 second)
Measured from: 0.219999969005585
to: 1.21999996900558 [s; relative to TRIGTIME]
Total Fluence
Measured from: 0.239999949932098
to: 1.19999998807907 [s; relative to TRIGTIME]
Band 1 Band 2 Band 3 Band 4
15-25 25-50 50-100 100-350 keV
Total 0.025261 0.022351 0.015465 0.007699
0.005317 0.005404 0.004486 0.003591 [error]
Peak 0.026412 0.020252 0.017060 0.007577
0.005417 0.005507 0.004585 0.003664 [error]
[ fluence units of on-axis counts / fully illuminated detector ]
======================================================================
====== Table of the duration information =============================
Value tstart tstop
T100 0.960 0.240 1.200
T90 0.832 0.304 1.136
T50 0.448 0.432 0.880
Peak 1.000 0.220 1.220
====== Spectral Analysis Summary =====================================
Model : spectral model: simple power-law (PL) and cutoff power-law (CPL)
Ph_index : photon index: E^{Ph_index}
Ph_90err : 90% error of the photon index
Epeak : Epeak in keV
Epeak_90err: 90% error of Epeak
Norm : normalization at 50 keV in both the PL model and CPL model
Nomr_90err : 90% error of the normalization
chi2 : Chi-Squared
dof : degree of freedo
=== Time-averaged spectral analysis ===
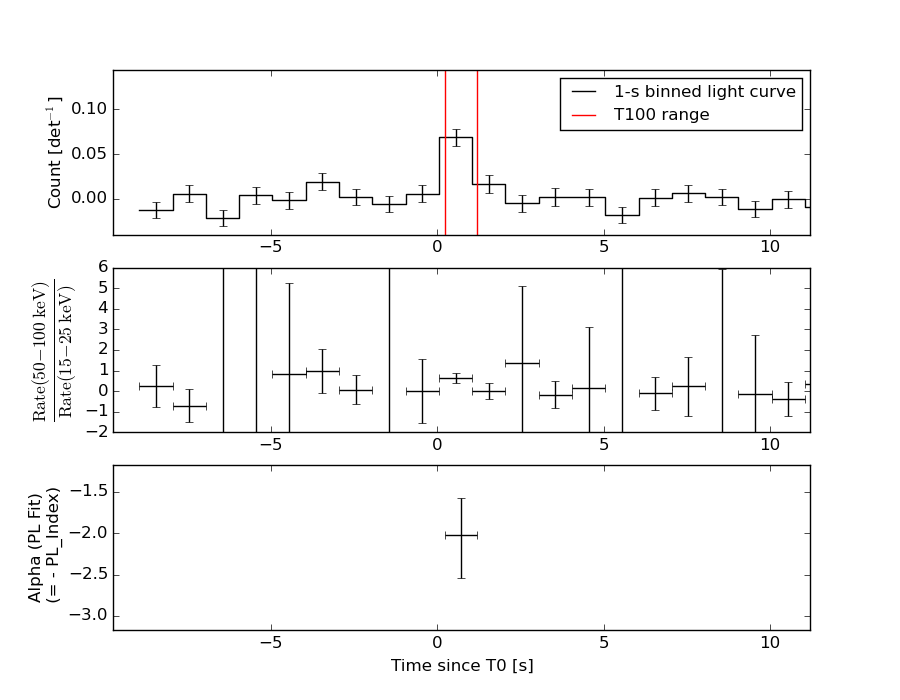
(Best model with acceptable fit: PL)
Model Ph_index Ph_90err_low Ph_90err_hi Epeak Epeak_90err_low Epeak_90err_hi Norm Nomr_90err_low Norm_90err_hi chi2 dof
PL -2.018 -0.517 0.445 - - - 3.68e-03 -1.22e-03 1.13e-03 54.460 57
CPL -2.079 -0.516 1.109 37.420 N/A N/A 3.26e-03 N/A N/A 54.310 56
=== 1-s peak spectral analysis ===
(Best model with acceptable fit: PL)
Model Ph_index Ph_90err_low Ph_90err_hi Epeak Epeak_90err_low Epeak_90err_hi Norm Nomr_90err_low Norm_90err_hi chi2 dof
PL -1.962 -0.520 0.449 - - - 3.68e-03 -1.19e-03 1.09e-03 58.130 57
CPL -1.969 -0.515 0.459 9999.360 N/A N/A 3.67e-03 N/A N/A 58.140 56
=== Fluence/Peak Flux Summary ===
Model Band1 Band2 Band3 Band4 Band5 Total
15-25 25-50 50-100 100-350 15-150 15-350 keV
Fluence PL 7.36e-09 9.87e-09 9.75e-09 1.73e-08 3.26e-08 4.43e-08 erg/cm2
90%_error_low -2.27e-09 -2.35e-09 -4.16e-09 -1.11e-08 -9.43e-09 -1.69e-08 erg/cm2
90%_error_hi 2.33e-09 2.29e-09 4.40e-09 1.98e-08 9.91e-09 2.37e-08 erg/cm2
Peak flux PL 2.37e-01 1.81e-01 9.32e-02 6.88e-02 5.43e-01 5.80e-01 ph/cm2/s
90%_error_low -7.67e-02 -4.16e-02 -3.83e-02 -4.25e-02 -1.23e-01 -1.35e-01 ph/cm2/s
90%_error_hi 7.98e-02 4.14e-02 3.91e-02 7.04e-02 1.23e-01 1.36e-01 ph/cm2/s
Fluence CPL 7.20e-09 9.68e-09 9.99e-09 2.24e-08 3.30e-08 4.85e-08 erg/cm2
90%_error_low -2.61e-09 -2.84e-09 N/A -1.38e-08 N/A -4.74e-08 erg/cm2
90%_error_hi 2.10e-09 2.53e-09 N/A 4.94e-09 N/A 1.16e-08 erg/cm2
Peak flux CPL 2.31e-01 1.76e-01 9.30e-02 8.26e-02 5.32e-01 5.80e-01 ph/cm2/s
90%_error_low -8.61e-02 -6.53e-02 N/A -8.26e-02 -1.95e-01 -2.10e-01 ph/cm2/s
90%_error_hi 8.59e-02 4.39e-02 N/A 1.61e-02 1.34e-01 1.41e-01 ph/cm2/s
======================================================================
Image
Pre-slew 15.0-350.0 keV image (Event data)
#   RAcent    DECcent   POSerr    Theta     Phi              Peak Cts       SNR   Name
  292.2712    33.9059   0.0248    11.3888  -173.9397         0.0753820      7.784 TRIG_00650617

Foreground time interval of the image:
  0.240   1.200 (delta_t =   0.960 [sec])
Background time interval of the image:
-239.952   0.240 (delta_t = 240.192 [sec])
Light Curves
Note: The mask-weighted lightcurves have units of either count/det or counts/sec/det, where a det is 0.4 x 0.4 = 0.16 sq cm.
Full-time range; 1 s binning
Other quick-look light curves:
- 64 ms binning (zoomed)
- 16 ms binning (zoomed)
- 8 ms binning (zoomed)
- 2 ms binning (zoomed)
- SN=5 or 10 s binning (full-time range)
- Raw light curve
Spectra
- 64 ms binning (zoomed)
- 16 ms binning (zoomed)
- 8 ms binning (zoomed)
- 2 ms binning (zoomed)
- SN=5 or 10 s binning (full-time range)
- Raw light curve
Spectra
Notes:
- 1) The fitting includes the systematic errors.
- 2) When the burst includes telescope slew time periods, the fitting uses an average response file made from multiple 5-s response files through out the slew time plus single time preiod for the non-slew times, and weighted by the total counts in the corresponding time period using addrmf. An average response file is needed becuase a spectral fit using the pre-slew DRM will introduce some errors in both a spectral shape and a normalization if the PHA file contains a lot of the slew/post-slew time interval.
- 3) For fits to more complicated models (e.g. a power-law over a cutoff power-law), the BAT team has decided to require a chi-square improvement of more than 6 for each extra dof.
Time averaged spectrum fit using the average DRM
Power-law model
Time interval is from    0.240 sec. to    1.200 sec.

Spectral model in power-law:
------------------------------------------------------------
Parameters  : value       lower 90%   higher 90%
Photon index: -2.01826     ( -0.517055   0.445039 )
Norm@50keV  : 3.68008E-03    ( -0.00121558   0.00112565 )
------------------------------------------------------------
#Fit statistic : Chi-Squared =          54.46 using 59 PHA bins.
# Reduced chi-squared =         0.9554 for     57 degrees of freedom
# Null hypothesis probability =   5.709601e-01

Photon flux (15-150 keV)    in 0.96 sec: 0.556756 ( -0.125609  0.12559 ) ph/cm2/s
Energy fluence (15-150 keV)             : 3.26191e-08 ( -9.42531e-09  9.91248e-09 ) ergs/cm2
Cutoff power-law model
Time interval is from    0.240 sec. to    1.200 sec.
Spectral model in the cutoff power-law:
------------------------------------------------------------
Parameters  : value       lower 90%   higher 90%
Photon index: -2.41447     ( -0.179873   1.44549 )
Epeak [keV] : 152.051      (   )
Norm@50keV  : 2.29724E-03    (     )
------------------------------------------------------------
#Fit statistic : Chi-Squared =          54.07 using 59 PHA bins.
# Reduced chi-squared =         0.9655 for     56 degrees of freedom
# Null hypothesis probability =   5.484302e-01

Photon flux (15-150 keV)    in 0.96 sec: 0.561186 ( -0.196507  0.12296 ) ph/cm2/s
Energy fluence (15-150 keV)             : 3.30165e-08 ( 0  0 ) ergs/cm2
1-s peak spectrum fit
Power-law model
Time interval is from    0.220 sec. to    1.220 sec.

Spectral model in power-law:
------------------------------------------------------------
Parameters  : value       lower 90%   higher 90%
Photon index: -1.96165     ( -0.52015   0.449209 )
Norm@50keV  : 3.68241E-03    ( -0.00119289   0.0010936 )
------------------------------------------------------------
#Fit statistic : Chi-Squared =          58.13 using 59 PHA bins.
# Reduced chi-squared =          1.020 for     57 degrees of freedom
# Null hypothesis probability =   4.333085e-01

Photon flux (15-150 keV)    in 1 sec: 0.542883 ( -0.12292  0.122921 ) ph/cm2/s
Energy fluence (15-150 keV)             : 3.39063e-08 ( -9.81501e-09  1.02589e-08 ) ergs/cm2
Cutoff power-law model
Time interval is from    0.220 sec. to    1.220 sec.
Spectral model in the cutoff power-law:
------------------------------------------------------------
Parameters  : value       lower 90%   higher 90%
Photon index: -2.17691     ( -0.515107   0.459002 )
Epeak [keV] : 72.3533      (   )
Norm@50keV  : 2.77464E-03    (     )
------------------------------------------------------------
#Fit statistic : Chi-Squared =          57.79 using 59 PHA bins.
# Reduced chi-squared =          1.032 for     56 degrees of freedom
# Null hypothesis probability =   4.090746e-01

Photon flux (15-150 keV)    in 1 sec: 0.532259 ( -0.194692  0.133691 ) ph/cm2/s
Energy fluence (15-150 keV)             : 0 ( 0  0 ) ergs/cm2
Time-resolved spectra
Distribution
T90 vs. Hardness ratio plot
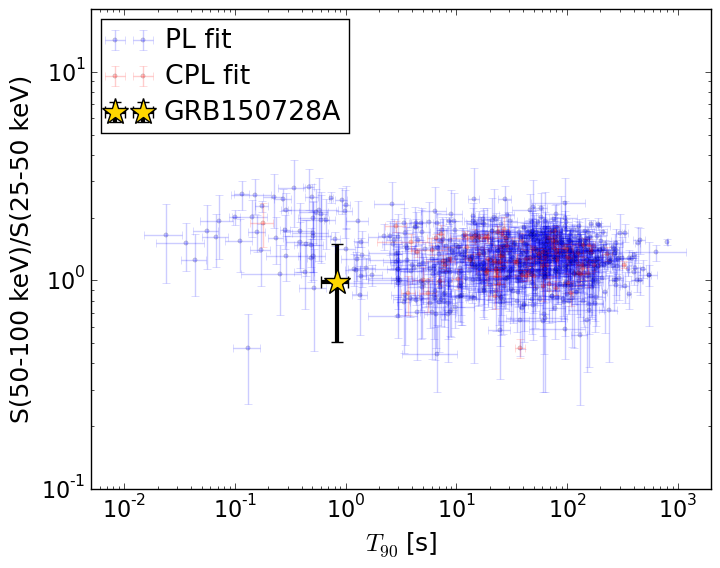
T90                                   = 0.832 sec.
Hardness ratio (energy fluence ratio) = 0.9874388488
S(15-50 keV) vs. S(50-150 keV) plot
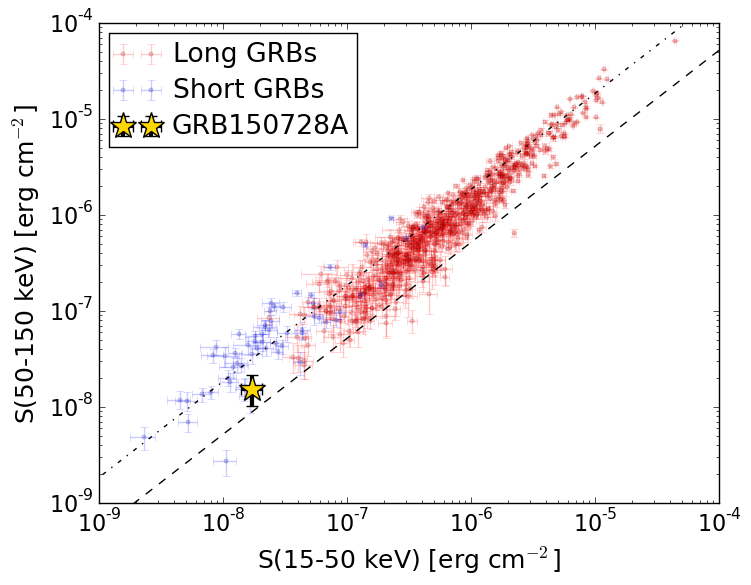
S(15-50 keV)  = 1.7227051e-08
S(50-150 keV) = 1.539168e-08
The dash-dotted line and the dashed line traces the fluences calculated from the Band function with Epeak = 15 and 150 keV, respectively. Both lines assume a canonical values of alpha = -1 and beta = -2.5.
Mask shadow pattern
IMX = -2.003064599409896E-01, IMY = 2.126625601115743E-02
Spacecraft aspect plot
Bright source in the pre-burst/pre-slew/post-slew images
Pre-burst image of 15-350 keV band
Time interval of the image:
-239.952000 0.240000

# RAcent  DECcent POSerr Theta    Phi  PeakCts   SNR AngSep     Name
#  [deg]    [deg]    ['] [deg]  [deg]                   [']
254.3794  35.3516    7.3  42.0 -160.8   0.4858   1.6    3.9	Her X-1
268.5665  -1.5668    0.0  49.9  144.5   0.7346   0.7   13.7	SW J1753.5-0127
288.9254  11.0331   10.6  27.6  130.3   0.2533   1.1    9.1	GRS 1915+105
299.5951  35.1990    0.4   5.4 -161.9   5.0082  26.0    0.3	Cyg X-1
308.1174  40.9593    0.8   7.3  -75.4   2.3934  14.0    0.5	Cyg X-3
326.1711  38.3207   22.4  16.9  -19.3   0.0976   0.5    0.1	Cyg X-2
350.9669  20.4716    2.7  41.8    8.7   1.2571   4.2 ------	UNKNOWN
286.7703  25.5346    2.9  18.6  160.5   0.7340   4.0 ------	UNKNOWN
 13.0748  50.9553    2.7  50.5  -39.3   3.4248   4.2 ------	UNKNOWN
Pre-slew background subtracted image of 15-350 keV band
Time interval of the image:
0.240000 1.200000

# RAcent  DECcent POSerr Theta    Phi  PeakCts   SNR AngSep     Name
#  [deg]    [deg]    ['] [deg]  [deg]                   [']
254.3808  35.2409    4.1  42.1 -161.0  -0.0438  -2.8    7.2	Her X-1
268.4225  -1.4427   35.9  49.9  144.8  -0.0181  -0.3    3.3	SW J1753.5-0127
288.7835  10.8360    4.7  27.9  130.3  -0.0326  -2.4    6.6	GRS 1915+105
299.5878  35.3413  667.5   5.5 -160.5   0.0002   0.0    8.4	Cyg X-1
307.9153  40.8459    6.9   7.2  -76.4   0.0154   1.7   10.9	Cyg X-3
326.3286  38.1511    0.0  17.0  -18.6   0.0093   1.0   12.6	Cyg X-2
292.2713  33.9059    1.5  11.4 -173.9   0.0754   7.8 ------	UNKNOWN
  2.9587  29.4664    2.6  48.1   -9.3   0.0811   4.4 ------	UNKNOWN
Post-slew image of 15-350 keV band
Time interval of the image:
53.948590 962.101700

# RAcent  DECcent POSerr Theta    Phi  PeakCts   SNR AngSep     Name
#  [deg]    [deg]    ['] [deg]  [deg]                   [']
254.4879  35.5537    0.0  30.9 -148.2   0.1678   0.3   12.8	Her X-1
268.2710  -1.3509    4.5  41.9  145.4   3.7626   2.5    8.4	SW J1753.5-0127
288.9653  10.9108    5.2  23.2  116.2   1.4399   2.2   10.1	GRS 1915+105
299.5989  35.1961    0.3   6.1    3.7  19.1278  38.7    0.5	Cyg X-1
308.1252  40.9347    0.7  14.4  -16.0   9.7508  17.2    1.3	Cyg X-3
326.1144  38.4246    4.8  27.5   -1.4   1.3434   2.4    6.7	Cyg X-2
323.5758  13.2799    2.7  35.1   46.3   3.8765   4.2 ------	UNKNOWN
252.2547  -1.4847    2.8  51.6  163.0   9.0978   4.2 ------	UNKNOWN
289.3801  23.2356    3.3  11.0  122.1   1.7998   3.5 ------	UNKNOWN
260.3519  25.5745    2.7  28.8 -170.3   2.3398   4.2 ------	UNKNOWN
338.1437  50.0677    3.1  37.0  -22.2   2.6185   3.7 ------	UNKNOWN
313.6700  54.6779    2.8  25.6  -42.9   2.3484   4.1 ------	UNKNOWN
231.5749  15.0234    4.7  57.6 -165.4   6.8582   2.4 ------	UNKNOWN
256.9583  48.4477    2.8  29.9 -122.4   2.9166   4.1 ------	UNKNOWN