Analysis Summary
Notes:
- 1) No attempt has been made to eliminate the non-significant decimal places.
- 2) This batgrbproduct analysis is done using the HEASARC data.
- 3) This batgrbproduct analysis is using the flight position for the mask-weighting calculation.
======================================================================
BAT GRB EVENT DATA PROCESSING REPORT
Process Script Ver: batgrbproduct v2.46
Process Start Time: Sun Aug 30 18:11:46 EDT 2015
Host Name: bat1
Current Working Dir: /local/data/bat1/alien/Swift_3rdBATcatalog/event/batevent_reproc/trigger650977
======================================================================
Trigger: 00650977 Segment: 000
BAT Trigger Time: 460161723.584 [s; MET]
Trigger Stop: 460161723.84 [s; MET]
UTC: 2015-08-01T22:41:48.648820 [includes UTCF correction]
Where From?: TDRSS position message
BAT
RA: 82.9589982137698 Dec: -5.38743125075409 [deg; J2000]
Catalogged Source?: NO
Point Source?: YES
GRB Indicated?: YES [ by BAT flight software ]
Image S/N Ratio: 7.7
Image Trigger?: NO
Rate S/N Ratio: 13 [ if not an image trigger ]
Image S/N Ratio: 7.7
Analysis Position: [ source = BAT ]
RA: 82.9589982137698 Dec: -5.38743125075409 [deg; J2000]
Refined Position: [ source = BAT pre-slew burst ]
RA: 82.9607296632042 Dec: -5.37529810147569 [deg; J2000]
{ 05h 31m 50.6s , -05d 22' 31.1" }
+/- 1.3429923556643 [arcmin] (estimated 90% radius based on SNR)
+/- 0.414382360656706 [arcmin] (formal 1-sigma fit error)
SNR: 19.9597997130576
Angular difference between the analysis and refined position is 0.735300 arcmin
Partial Coding Fraction: 0.625 [ including projection effects ]
Duration
T90: 408.707999944687 +/- 29.6191441817222
Measured from: 0.244000017642975
to: 408.95199996233 [s; relative to TRIGTIME]
T50: 364.887999951839 +/- 6.82123977976951
Measured from: 6.18800002336502
to: 371.075999975204 [s; relative to TRIGTIME]
Fluence
Peak Flux (peak 1 second)
Measured from: 9.32400000095367
to: 10.3240000009537 [s; relative to TRIGTIME]
Total Fluence
Measured from: -30.1599999666214
to: 433.944000005722 [s; relative to TRIGTIME]
Band 1 Band 2 Band 3 Band 4
15-25 25-50 50-100 100-350 keV
Total 1.800035 1.907614 1.258471 0.267568
0.120211 0.123025 0.105050 0.088122 [error]
Peak 0.093393 0.109836 0.072101 0.012204
0.008300 0.008932 0.007570 0.005542 [error]
[ fluence units of on-axis counts / fully illuminated detector ]
======================================================================
====== Table of the duration information =============================
Value tstart tstop
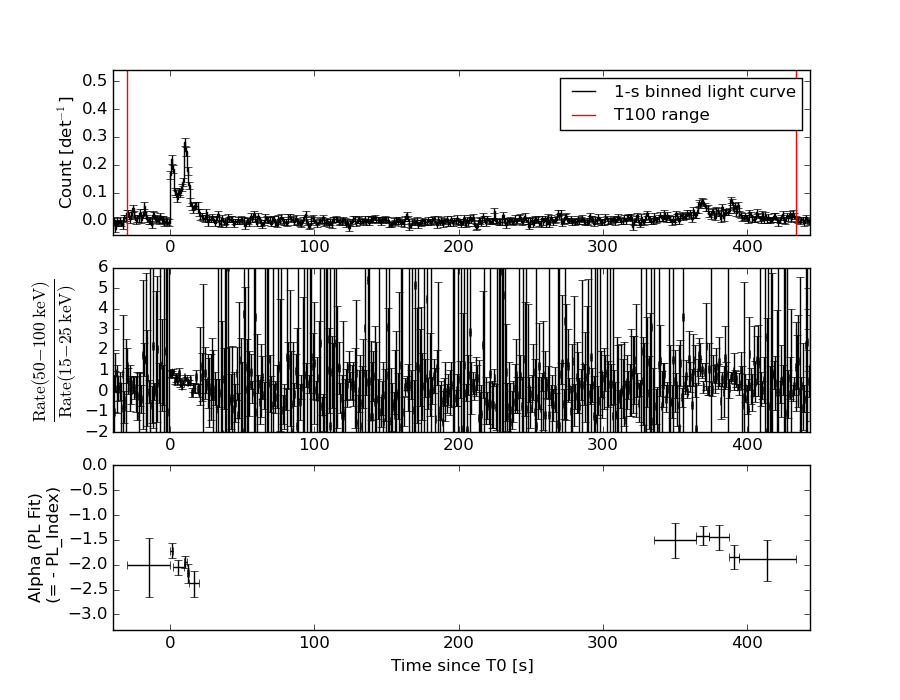
T100 464.104 -30.160 433.944
T90 408.708 0.244 408.952
T50 364.888 6.188 371.076
Peak 1.000 9.324 10.324
====== Spectral Analysis Summary =====================================
Model : spectral model: simple power-law (PL) and cutoff power-law (CPL)
Ph_index : photon index: E^{Ph_index}
Ph_90err : 90% error of the photon index
Epeak : Epeak in keV
Epeak_90err: 90% error of Epeak
Norm : normalization at 50 keV in both the PL model and CPL model
Nomr_90err : 90% error of the normalization
chi2 : Chi-Squared
dof : degree of freedo
=== Time-averaged spectral analysis ===
(Best model with acceptable fit: PL)
Model Ph_index Ph_90err_low Ph_90err_hi Epeak Epeak_90err_low Epeak_90err_hi Norm Nomr_90err_low Norm_90err_hi chi2 dof
PL -1.796 -0.139 0.136 - - - 6.90e-04 -5.53e-05 5.45e-05 50.270 57
CPL -1.798 -0.137 0.311 9999.340 -9999.330 -9999.340 6.90e-04 -3.56e-04 4.01e-04 50.280 56
=== 1-s peak spectral analysis ===
(Best model with acceptable fit: PL)
Model Ph_index Ph_90err_low Ph_90err_hi Epeak Epeak_90err_low Epeak_90err_hi Norm Nomr_90err_low Norm_90err_hi chi2 dof
PL -1.819 -0.157 0.152 - - - 1.84e-02 -1.84e-03 1.81e-03 63.320 57
CPL -1.331 -0.574 0.727 61.886 -17.213 -61.886 3.41e-02 -1.66e-02 5.14e-02 61.490 56
=== Fluence/Peak Flux Summary ===
Model Band1 Band2 Band3 Band4 Band5 Total
15-25 25-50 50-100 100-350 15-150 15-350 keV
Fluence PL 5.40e-07 8.29e-07 9.54e-07 2.11e-06 2.95e-06 4.43e-06 erg/cm2
90%_error_low -6.19e-08 -5.91e-08 -1.05e-07 -4.51e-07 -2.40e-07 -5.51e-07 erg/cm2
90%_error_hi 6.39e-08 5.91e-08 1.06e-07 5.28e-07 2.43e-07 6.11e-07 erg/cm2
Peak flux PL 1.03e+00 8.56e-01 4.85e-01 4.08e-01 2.55e+00 2.78e+00 ph/cm2/s
90%_error_low -1.37e-01 -7.63e-02 -6.27e-02 -9.42e-02 -2.28e-01 -2.46e-01 ph/cm2/s
90%_error_hi 1.41e-01 7.62e-02 6.26e-02 1.10e-01 2.28e-01 2.46e-01 ph/cm2/s
Fluence CPL 5.43e-07 8.24e-07 9.54e-07 2.10e-06 2.98e-06 4.42e-06 erg/cm2
90%_error_low N/A N/A N/A N/A -2.79e-07 -1.03e-06 erg/cm2
90%_error_hi N/A N/A N/A N/A 2.08e-07 5.87e-07 erg/cm2
Peak flux CPL 9.68e-01 9.06e-01 4.95e-01 2.23e-01 2.51e+00 2.59e+00 ph/cm2/s
90%_error_low -1.58e-01 -9.80e-02 -6.81e-02 -1.22e-01 -2.35e-01 -2.72e-01 ph/cm2/s
90%_error_hi 1.59e-01 1.02e-01 6.85e-02 2.23e-01 2.34e-01 3.25e-01 ph/cm2/s
======================================================================
Image
Pre-slew 15.0-350.0 keV image (Event data)
#   RAcent    DECcent   POSerr    Theta     Phi              Peak Cts       SNR   Name
   82.9607    -5.3753   0.0097    33.3861  -140.5415         1.8316622     19.960 TRIG_00650977

Foreground time interval of the image:
-30.160   9.717 (delta_t =  39.877 [sec])
Background time interval of the image:
-239.584 -30.160 (delta_t = 209.424 [sec])
Light Curves
Note: The mask-weighted lightcurves have units of either count/det or counts/sec/det, where a det is 0.4 x 0.4 = 0.16 sq cm.
Full-time range; 1 s binning
Other quick-look light curves:
- 64 ms binning (zoomed)
- 16 ms binning (zoomed)
- 8 ms binning (zoomed)
- 2 ms binning (zoomed)
- SN=5 or 10 s binning (full-time range)
- Raw light curve
Spectra
- 64 ms binning (zoomed)
- 16 ms binning (zoomed)
- 8 ms binning (zoomed)
- 2 ms binning (zoomed)
- SN=5 or 10 s binning (full-time range)
- Raw light curve
Spectra
Notes:
- 1) The fitting includes the systematic errors.
- 2) When the burst includes telescope slew time periods, the fitting uses an average response file made from multiple 5-s response files through out the slew time plus single time preiod for the non-slew times, and weighted by the total counts in the corresponding time period using addrmf. An average response file is needed becuase a spectral fit using the pre-slew DRM will introduce some errors in both a spectral shape and a normalization if the PHA file contains a lot of the slew/post-slew time interval.
- 3) For fits to more complicated models (e.g. a power-law over a cutoff power-law), the BAT team has decided to require a chi-square improvement of more than 6 for each extra dof.
Time averaged spectrum fit using the average DRM
Power-law model
Time interval is from  -30.160 sec. to  433.944 sec.

Spectral model in power-law:
------------------------------------------------------------
Parameters  : value       lower 90%   higher 90%
Photon index: -1.79645     ( -0.138793   0.135584 )
Norm@50keV  : 6.89691E-04    ( -5.53153e-05   5.45356e-05 )
------------------------------------------------------------
#Fit statistic : Chi-Squared =          50.27 using 59 PHA bins.
# Reduced chi-squared =         0.8820 for     57 degrees of freedom
# Null hypothesis probability =   7.235761e-01

Photon flux (15-150 keV)    in 464.1 sec: 9.49123E-02 ( -0.0068828  0.0068957 ) ph/cm2/s
Energy fluence (15-150 keV)             : 2.94762e-06 ( -2.4035e-07  2.42827e-07 ) ergs/cm2
Cutoff power-law model

Time interval is from  -30.160 sec. to  433.944 sec.
Spectral model in the cutoff power-law:
------------------------------------------------------------
Parameters  : value       lower 90%   higher 90%
Photon index: -1.7981     ( -0.137184   0.310727 )
Epeak [keV] : 9999.34      ( -9999.35 -9999.36 )
Norm@50keV  : 6.90013E-04    ( -0.000356303   0.000400575 )
------------------------------------------------------------
#Fit statistic : Chi-Squared =          50.28 using 59 PHA bins.
# Reduced chi-squared =         0.8978 for     56 degrees of freedom
# Null hypothesis probability =   6.902938e-01

Photon flux (15-150 keV)    in 464.1 sec: 9.52219E-02 ( -0.0079567  0.0072201 ) ph/cm2/s
Energy fluence (15-150 keV)             : 2.97839e-06 ( -2.79274e-07  2.0802e-07 ) ergs/cm2
1-s peak spectrum fit
Power-law model
Time interval is from    9.324 sec. to   10.324 sec.

Spectral model in power-law:
------------------------------------------------------------
Parameters  : value       lower 90%   higher 90%
Photon index: -1.81896     ( -0.157302   0.152411 )
Norm@50keV  : 1.83577E-02    ( -0.00184075   0.00181407 )
------------------------------------------------------------
#Fit statistic : Chi-Squared =          63.32 using 59 PHA bins.
# Reduced chi-squared =          1.111 for     57 degrees of freedom
# Null hypothesis probability =   2.633432e-01

Photon flux (15-150 keV)    in 1 sec: 2.54862 ( -0.22784  0.22799 ) ph/cm2/s
Energy fluence (15-150 keV)             : 1.68931e-07 ( -1.70232e-08  1.72134e-08 ) ergs/cm2
Cutoff power-law model
Time interval is from    9.324 sec. to   10.324 sec.
Spectral model in the cutoff power-law:
------------------------------------------------------------
Parameters  : value       lower 90%   higher 90%
Photon index: -1.33128     ( -0.57381   0.726848 )
Epeak [keV] : 61.8858      ( -17.2133 -61.8858 )
Norm@50keV  : 3.40798E-02    ( -0.0165997   0.0513672 )
------------------------------------------------------------
#Fit statistic : Chi-Squared =          61.49 using 59 PHA bins.
# Reduced chi-squared =          1.098 for     56 degrees of freedom
# Null hypothesis probability =   2.860653e-01

Photon flux (15-150 keV)    in 1 sec: 2.50680 ( -0.23502  0.23406 ) ph/cm2/s
Energy fluence (15-150 keV)             : 0 ( 0  0 ) ergs/cm2
Time-resolved spectra
Distribution
T90 vs. Hardness ratio plot
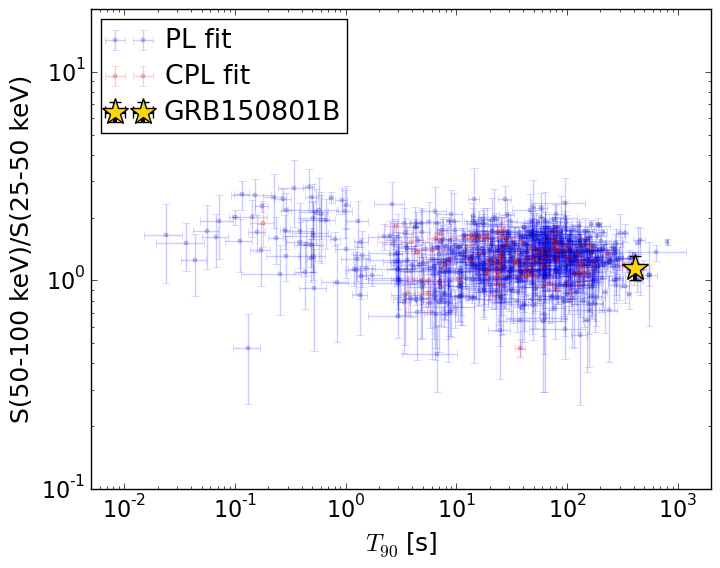
T90                                   = 408.708 sec.
Hardness ratio (energy fluence ratio) = 1.15156897251
S(15-50 keV) vs. S(50-150 keV) plot
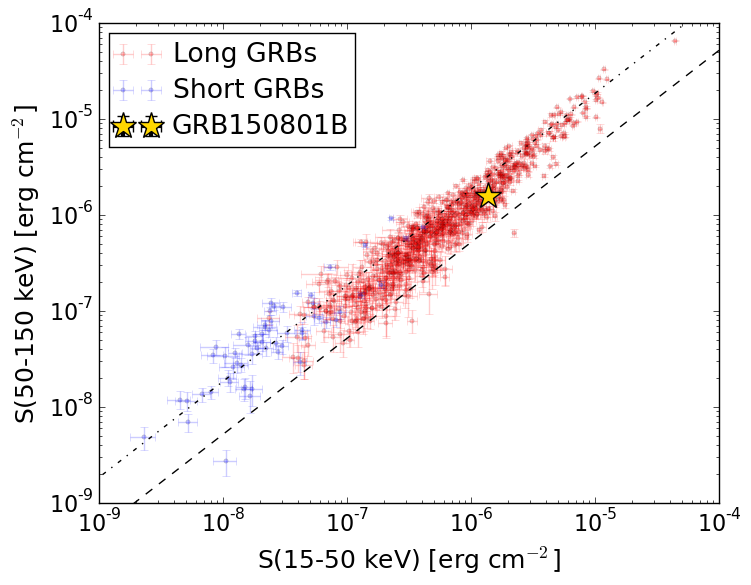
S(15-50 keV)  = 1.369063e-06
S(50-150 keV) = 1.5784783e-06
The dash-dotted line and the dashed line traces the fluences calculated from the Band function with Epeak = 15 and 150 keV, respectively. Both lines assume a canonical values of alpha = -1 and beta = -2.5.
Mask shadow pattern
IMX = -5.088279037210258E-01, IMY = 4.188262261616247E-01
Spacecraft aspect plot
Bright source in the pre-burst/pre-slew/post-slew images
Pre-burst image of 15-350 keV band
Time interval of the image:
-239.584000 -30.160000

# RAcent  DECcent POSerr Theta    Phi  PeakCts   SNR AngSep     Name
#  [deg]    [deg]    ['] [deg]  [deg]                   [']
135.5630 -40.5356    2.0  44.4  -39.1   1.8918   5.6    1.9	Vela X-1
103.7777  -3.5790    2.7  42.4 -109.6   3.2363   4.3 ------	UNKNOWN
104.1965  -3.8650    3.3  42.4 -108.8   2.6177   3.6 ------	UNKNOWN
Pre-slew background subtracted image of 15-350 keV band
Time interval of the image:
-30.160000 9.716590

# RAcent  DECcent POSerr Theta    Phi  PeakCts   SNR AngSep     Name
#  [deg]    [deg]    ['] [deg]  [deg]                   [']
135.5185 -40.4758    6.7  44.4  -39.2  -0.2534  -1.7    4.8	Vela X-1
 30.2486 -14.1890    2.6  47.8  136.0   1.3534   4.4 ------	UNKNOWN
 37.8865  -2.7494    2.6  50.4  153.8   1.3832   4.5 ------	UNKNOWN
 38.8438   1.9109    2.9  53.5  158.5   1.6034   4.0 ------	UNKNOWN
 59.9911  -7.1825    2.3  34.8  178.0   0.4353   5.0 ------	UNKNOWN
 82.9607  -5.3753    0.6  33.4 -140.5   1.8318  20.0 ------	UNKNOWN
Post-slew image of 15-350 keV band
Time interval of the image:
62.716580 962.459200

# RAcent  DECcent POSerr Theta    Phi  PeakCts   SNR AngSep     Name
#  [deg]    [deg]    ['] [deg]  [deg]                   [']
 83.6294  22.0118    0.2  27.4 -151.4  36.0501  57.1    0.3	Crab
135.5623 -40.5534    5.5  58.6  -17.8   7.2764   2.1    1.5	Vela X-1
 62.5719 -48.5928    3.8  46.5   45.7   7.4909   3.0 ------	UNKNOWN
 57.6185 -30.7269    3.4  34.7   67.4   4.7678   3.4 ------	UNKNOWN
 69.4350   7.9832    3.0  19.0  161.9   2.3438   3.9 ------	UNKNOWN
 82.9365  -5.4220    2.0   0.0   65.1   3.4084   5.8 ------	UNKNOWN