Analysis Summary
Notes:
- 1) No attempt has been made to eliminate the non-significant decimal places.
- 2) This batgrbproduct analysis is done using the HEASARC data.
- 3) This batgrbproduct analysis is using the flight position for the mask-weighting calculation.
======================================================================
BAT GRB EVENT DATA PROCESSING REPORT
Process Script Ver: batgrbproduct v2.46
Process Start Time: Sun Aug 30 18:08:19 EDT 2015
Host Name: bat1
Current Working Dir: /local/data/bat1/alien/Swift_3rdBATcatalog/event/batevent_reproc/trigger651882
======================================================================
Trigger: 00651882 Segment: 000
BAT Trigger Time: 460958784 [s; MET]
Trigger Stop: 460958848 [s; MET]
UTC: 2015-08-11T04:06:09.022920 [includes UTCF correction]
Where From?: TDRSS position message
BAT
RA: 291.370844486993 Dec: -15.4381283909325 [deg; J2000]
Catalogged Source?: NO
Point Source?: YES
GRB Indicated?: YES [ by BAT flight software ]
Image S/N Ratio: 10.67
Image Trigger?: YES
Rate S/N Ratio: 0 [ if not an image trigger ]
Image S/N Ratio: 10.67
Analysis Position: [ source = BAT ]
RA: 291.370844486993 Dec: -15.4381283909325 [deg; J2000]
Refined Position: [ source = BAT pre-slew burst ]
RA: 291.345175381785 Dec: -15.4375489483609 [deg; J2000]
{ 19h 25m 22.8s , -15d 26' 15.2" }
+/- 1.94642539453502 [arcmin] (estimated 90% radius based on SNR)
+/- 0.955325865879976 [arcmin] (formal 1-sigma fit error)
SNR: 11.746854162161
Angular difference between the analysis and refined position is 1.484985 arcmin
Partial Coding Fraction: 0.6796875 [ including projection effects ]
Duration
T90: 31.5199999213219 +/- 7.31887482514508
Measured from: 4.63200002908707
to: 36.1519999504089 [s; relative to TRIGTIME]
T50: 16.3719999790192 +/- 4.58665973285042
Measured from: 6.81599998474121
to: 23.1879999637604 [s; relative to TRIGTIME]
Fluence
Peak Flux (peak 1 second)
Measured from: 5.00800001621246
to: 6.00800001621246 [s; relative to TRIGTIME]
Total Fluence
Measured from: 1.50800001621246
to: 39.1840000152588 [s; relative to TRIGTIME]
Band 1 Band 2 Band 3 Band 4
15-25 25-50 50-100 100-350 keV
Total 0.399911 0.350962 0.177710 0.047599
0.043803 0.042855 0.035459 0.029779 [error]
Peak 0.035260 0.023839 0.004236 0.007794
0.007388 0.007240 0.005969 0.004816 [error]
[ fluence units of on-axis counts / fully illuminated detector ]
======================================================================
====== Table of the duration information =============================
Value tstart tstop
T100 37.676 1.508 39.184
T90 31.520 4.632 36.152
T50 16.372 6.816 23.188
Peak 1.000 5.008 6.008
====== Spectral Analysis Summary =====================================
Model : spectral model: simple power-law (PL) and cutoff power-law (CPL)
Ph_index : photon index: E^{Ph_index}
Ph_90err : 90% error of the photon index
Epeak : Epeak in keV
Epeak_90err: 90% error of Epeak
Norm : normalization at 50 keV in both the PL model and CPL model
Nomr_90err : 90% error of the normalization
chi2 : Chi-Squared
dof : degree of freedo
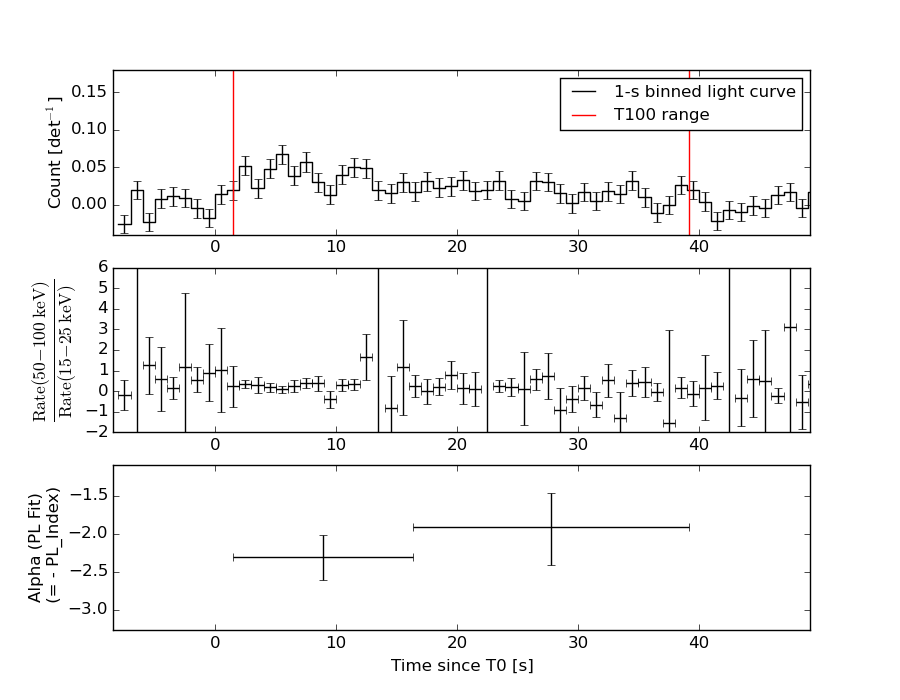
=== Time-averaged spectral analysis ===
(Best model with acceptable fit: PL)
Model Ph_index Ph_90err_low Ph_90err_hi Epeak Epeak_90err_low Epeak_90err_hi Norm Nomr_90err_low Norm_90err_hi chi2 dof
PL -2.133 -0.276 0.254 - - - 1.37e-03 -2.52e-04 2.44e-04 64.320 57
CPL -1.943 -0.059 1.004 12.492 -11.507 -12.492 1.77e-03 -7.44e-04 2.84e-04 64.280 56
=== 1-s peak spectral analysis ===
(Best model with acceptable fit: N/A)
Model Ph_index Ph_90err_low Ph_90err_hi Epeak Epeak_90err_low Epeak_90err_hi Norm Nomr_90err_low Norm_90err_hi chi2 dof
PL -2.264 -0.657 0.542 - - - 3.53e-03 -1.55e-03 1.51e-03 69.780 57
CPL -1.080 -1.036 4.250 26.277 N/A N/A 2.12e-02 N/A N/A 69.430 56
=== Fluence/Peak Flux Summary ===
Model Band1 Band2 Band3 Band4 Band5 Total
15-25 25-50 50-100 100-350 15-150 15-350 keV
Fluence PL 1.20e-07 1.50e-07 1.37e-07 2.18e-07 4.82e-07 6.26e-07 erg/cm2
90%_error_low -2.15e-08 -2.04e-08 -3.36e-08 -8.95e-08 -7.68e-08 -1.34e-07 erg/cm2
90%_error_hi 2.20e-08 2.02e-08 3.49e-08 1.24e-07 7.90e-08 1.60e-07 erg/cm2
Peak flux PL 3.04e-01 1.96e-01 8.15e-02 4.62e-02 6.05e-01 6.28e-01 ph/cm2/s
90%_error_low -1.10e-01 -6.12e-02 -4.28e-02 -4.62e-02 -1.75e-01 -1.84e-01 ph/cm2/s
90%_error_hi 1.14e-01 5.94e-02 4.87e-02 6.61e-02 1.75e-01 1.86e-01 ph/cm2/s
Fluence CPL 1.20e-07 1.52e-07 1.36e-07 1.62e-07 4.75e-07 5.47e-07 erg/cm2
90%_error_low -1.35e-08 -5.19e-08 -3.72e-08 -1.05e-07 -8.71e-08 N/A erg/cm2
90%_error_hi 1.84e-08 1.95e-08 3.46e-08 2.24e-07 8.63e-08 N/A erg/cm2
Peak flux CPL 3.04e-01 2.02e-01 7.59e-02 2.11e-02 6.00e-01 6.09e-01 ph/cm2/s
90%_error_low -5.57e-02 -5.98e-02 -3.92e-02 N/A N/A N/A ph/cm2/s
90%_error_hi 1.08e-01 5.99e-02 5.31e-02 N/A N/A N/A ph/cm2/s
======================================================================
Image
Pre-slew 15.0-350.0 keV image (Event data)
#   RAcent    DECcent   POSerr    Theta     Phi              Peak Cts       SNR   Name
  291.3452   -15.4375   0.0163    26.5224   148.2921         1.0188307     11.747 TRIG_00651882

Foreground time interval of the image:
  1.508  39.184 (delta_t =  37.676 [sec])
Background time interval of the image:
-657.799 -641.960 (delta_t =  15.839 [sec])
-239.000   1.508 (delta_t = 240.508 [sec])
Light Curves
Note: The mask-weighted lightcurves have units of either count/det or counts/sec/det, where a det is 0.4 x 0.4 = 0.16 sq cm.
Full-time range; 1 s binning
Other quick-look light curves:
- 64 ms binning (zoomed)
- 16 ms binning (zoomed)
- 8 ms binning (zoomed)
- 2 ms binning (zoomed)
- SN=5 or 10 s binning (full-time range)
- Raw light curve
Spectra
- 64 ms binning (zoomed)
- 16 ms binning (zoomed)
- 8 ms binning (zoomed)
- 2 ms binning (zoomed)
- SN=5 or 10 s binning (full-time range)
- Raw light curve
Spectra
Notes:
- 1) The fitting includes the systematic errors.
- 2) When the burst includes telescope slew time periods, the fitting uses an average response file made from multiple 5-s response files through out the slew time plus single time preiod for the non-slew times, and weighted by the total counts in the corresponding time period using addrmf. An average response file is needed becuase a spectral fit using the pre-slew DRM will introduce some errors in both a spectral shape and a normalization if the PHA file contains a lot of the slew/post-slew time interval.
- 3) For fits to more complicated models (e.g. a power-law over a cutoff power-law), the BAT team has decided to require a chi-square improvement of more than 6 for each extra dof.
Time averaged spectrum fit using the average DRM
Power-law model
Time interval is from    1.508 sec. to   39.184 sec.

Spectral model in power-law:
------------------------------------------------------------
Parameters  : value       lower 90%   higher 90%
Photon index: -2.13329     ( -0.276406   0.254418 )
Norm@50keV  : 1.37258E-03    ( -0.000251992   0.000243695 )
------------------------------------------------------------
#Fit statistic : Chi-Squared =          64.32 using 59 PHA bins.
# Reduced chi-squared =          1.128 for     57 degrees of freedom
# Null hypothesis probability =   2.357457e-01

Photon flux (15-150 keV)    in 37.68 sec: 0.219579 ( -0.028788  0.028793 ) ph/cm2/s
Energy fluence (15-150 keV)             : 4.82281e-07 ( -7.67813e-08  7.89746e-08 ) ergs/cm2
Cutoff power-law model

Time interval is from    1.508 sec. to   39.184 sec.
Spectral model in the cutoff power-law:
------------------------------------------------------------
Parameters  : value       lower 90%   higher 90%
Photon index: -1.98917     ( -0.0135251   1.04969 )
Epeak [keV] : 3.08674      ( -2.10237 -3.08674 )
Norm@50keV  : 1.66785E-03    ( -0.000643069   0.00038526 )
------------------------------------------------------------
#Fit statistic : Chi-Squared =          64.26 using 59 PHA bins.
# Reduced chi-squared =          1.148 for     56 degrees of freedom
# Null hypothesis probability =   2.096082e-01

Photon flux (15-150 keV)    in 37.68 sec: 0.219480 ( -0.028718  0.028989 ) ph/cm2/s
Energy fluence (15-150 keV)             : 4.749e-07 ( -8.7106e-08  8.6343e-08 ) ergs/cm2
1-s peak spectrum fit
Power-law model
Time interval is from    5.008 sec. to    6.008 sec.

Spectral model in power-law:
------------------------------------------------------------
Parameters  : value       lower 90%   higher 90%
Photon index: -2.26352     ( -0.656778   0.541795 )
Norm@50keV  : 3.52993E-03    ( -0.00154539   0.00150508 )
------------------------------------------------------------
#Fit statistic : Chi-Squared =          69.78 using 59 PHA bins.
# Reduced chi-squared =          1.224 for     57 degrees of freedom
# Null hypothesis probability =   1.191376e-01

Photon flux (15-150 keV)    in 1 sec: 0.604680 ( -0.17525  0.175296 ) ph/cm2/s
Energy fluence (15-150 keV)             : 3.35243e-08 ( -1.18193e-08  1.28343e-08 ) ergs/cm2
Cutoff power-law model
Time interval is from    5.008 sec. to    6.008 sec.
Spectral model in the cutoff power-law:
------------------------------------------------------------
Parameters  : value       lower 90%   higher 90%
Photon index: -1.07978     ( -1.0393   4.2468 )
Epeak [keV] : 26.2770      (   )
Norm@50keV  : 2.11528E-02    (     )
------------------------------------------------------------
#Fit statistic : Chi-Squared =          69.43 using 59 PHA bins.
# Reduced chi-squared =          1.240 for     56 degrees of freedom
# Null hypothesis probability =   1.072432e-01

Photon flux (15-150 keV)    in 1 sec: 0.600323 (    ) ph/cm2/s
Energy fluence (15-150 keV)             : 0 ( 0  0 ) ergs/cm2
Time-resolved spectra
Distribution
T90 vs. Hardness ratio plot
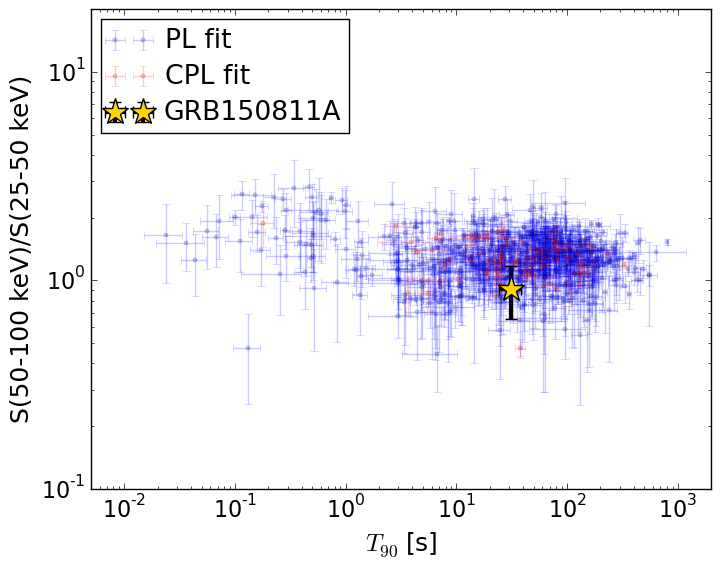
T90                                   = 31.52 sec.
Hardness ratio (energy fluence ratio) = 0.91177964254
S(15-50 keV) vs. S(50-150 keV) plot
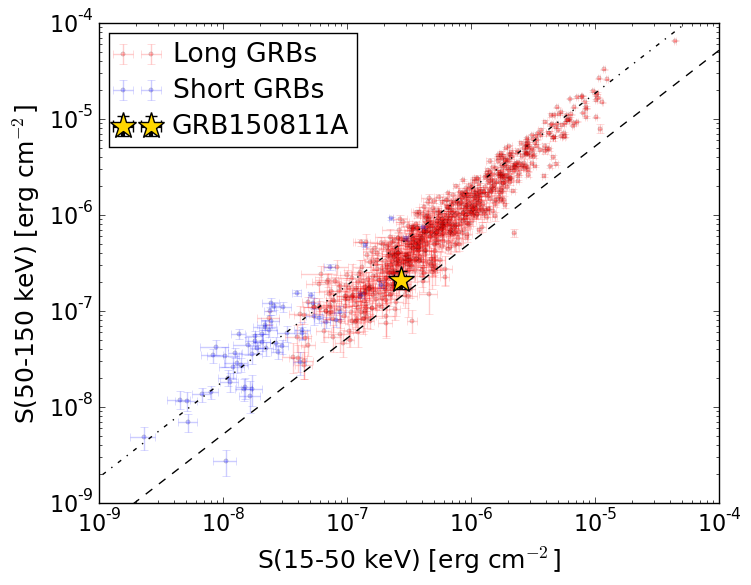
S(15-50 keV)  = 2.705635e-07
S(50-150 keV) = 2.1171969e-07
The dash-dotted line and the dashed line traces the fluences calculated from the Band function with Epeak = 15 and 150 keV, respectively. Both lines assume a canonical values of alpha = -1 and beta = -2.5.
Mask shadow pattern
IMX = -4.245781518859776E-01, IMY = -2.623057113130498E-01
Spacecraft aspect plot
Bright source in the pre-burst/pre-slew/post-slew images
Pre-burst image of 15-350 keV band
Time interval of the image:
-657.799400 -641.960400
-239.000000 1.508000

# RAcent  DECcent POSerr Theta    Phi  PeakCts   SNR AngSep     Name
#  [deg]    [deg]    ['] [deg]  [deg]                   [']
244.9992 -15.6510    0.8  50.8 -146.9   9.5036  13.9    1.3	Sco X-1
254.5157  35.4567    5.7  39.5  -72.2   1.3814   2.0    7.4	Her X-1
255.9517 -37.7334   45.4  57.6 -175.6  -0.3224  -0.3    6.8	4U 1700-377
256.3361 -36.4331    7.0  56.4 -174.9   1.6671   1.6    4.8	GX 349+2
262.9965 -24.7174   17.1  43.6 -171.2  -0.2704  -0.7    1.8	GX 1+4
268.5477  -1.3859    6.2  23.6 -146.5   0.4557   1.8   11.5	SW J1753.5-0127
270.1884 -24.9991   17.9  40.3 -179.6   0.2168   0.6    7.1	GX 5-1
270.2972 -25.7354    7.7  40.9  179.7   0.5322   1.5    0.5	GRS 1758-258
274.0012 -14.0690    2.8  29.0 -175.5   1.0405   4.1    2.0	GX 17+2
275.8025 -30.3269    8.8  43.1  170.3   0.5524   1.3    6.8	H1820-303
285.1496 -24.8359   19.3  36.0  159.5   0.2309   0.6    8.0	HT1900.1-2455
288.7380  11.1417   15.1   0.2  -35.5  -0.1596  -0.8   12.3	GRS 1915+105
299.6061  35.1940    0.5  26.2   -5.7   4.9906  21.9    0.9	Cyg X-1
308.1187  40.9487    1.3  34.5    0.1   2.6351   9.1    0.4	Cyg X-3
326.2391  38.4064   56.1  43.2   18.0  -0.0884  -0.2    6.0	Cyg X-2
263.0898 -33.7659    3.4  51.0 -178.5   2.0911   3.4    6.5	GX 354-0
321.2322  60.7343    3.8  55.2   -7.5   2.3562   3.0 ------	UNKNOWN
262.6145  -9.1646    2.3  32.9 -152.9   1.2740   4.9 ------	UNKNOWN
279.0023  44.1678    2.4  34.3  -38.6   1.3946   4.7 ------	UNKNOWN
243.5150 -28.2896    4.2  58.8 -159.1   4.2232   2.8 ------	UNKNOWN
254.0192  24.1111    2.8  35.5  -89.7   2.3269   4.2 ------	UNKNOWN
	UNKNOWN
	UNKNOWN
Pre-slew background subtracted image of 15-350 keV band
Time interval of the image:
1.508000 39.184000

# RAcent  DECcent POSerr Theta    Phi  PeakCts   SNR AngSep     Name
#  [deg]    [deg]    ['] [deg]  [deg]                   [']
244.8666 -15.6987    4.5  51.0 -146.9  -0.5187  -2.6    7.4	Sco X-1
254.5094  35.3664    4.6  39.5  -72.3  -0.4625  -2.5    2.9	Her X-1
255.9669 -37.7533    5.0  57.6 -175.6   0.9451   2.3    5.5	4U 1700-377
256.3771 -36.4592    7.9  56.4 -175.0  -0.4729  -1.5    3.6	GX 349+2
262.9217 -24.6582    3.6  43.6 -171.1   0.3566   3.2    7.1	GX 1+4
268.3891  -1.4645   18.8  23.8 -146.4  -0.0435  -0.6    1.5	SW J1753.5-0127
270.1323 -25.1134   88.7  40.4 -179.6   0.0135   0.1    8.5	GX 5-1
270.3764 -25.8373    6.7  40.9  179.6   0.1846   1.7    6.9	GRS 1758-258
273.8257 -14.0956    2.8  29.1 -175.2  -0.3120  -4.1   11.1	GX 17+2
275.9144 -30.4012    5.9  43.2  170.1  -0.2540  -1.9    2.1	H1820-303
285.1486 -24.9936    6.3  36.1  159.4  -0.2045  -1.8    7.5	HT1900.1-2455
288.8297  10.7634    6.0   0.2  136.9  -0.1205  -1.9   11.1	GRS 1915+105
299.5573  35.2354  465.7  26.2   -5.9   0.0018   0.0    2.6	Cyg X-1
308.2117  40.8769    6.9  34.5    0.3  -0.1358  -1.7    6.5	Cyg X-3
326.2145  38.4018    5.4  43.2   18.0  -0.2781  -2.1    5.2	Cyg X-2
263.0281 -33.9642   11.4  51.2 -178.6   0.1855   1.0    8.0	GX 354-0
303.4457 -32.0951    2.6  45.3  136.3   1.2407   4.5 ------	UNKNOWN
291.3452 -15.4376    1.0  26.5  148.3   1.0188  11.7 ------	UNKNOWN
271.1877  51.9901    2.4  43.4  -41.8   0.6550   4.9 ------	UNKNOWN
Post-slew image of 15-350 keV band
Time interval of the image:
127.900600 963.029200

# RAcent  DECcent POSerr Theta    Phi  PeakCts   SNR AngSep     Name
#  [deg]    [deg]    ['] [deg]  [deg]                   [']
255.8812 -37.7257   17.9  38.4 -136.0  -0.7941  -0.6    8.7	4U 1700-377
256.4468 -36.2771    7.8  37.4 -134.2   1.7370   1.5    8.8	GX 349+2
263.1924 -24.6528    0.0  28.0 -117.4  -2.6238  -2.6   11.4	GX 1+4
264.8536 -44.4751   56.9  36.7 -151.4  -0.1885  -0.2    5.0	4U 1735-44
268.3433  -1.4557   26.4  26.7  -64.2   0.3999   0.4    1.5	SW J1753.5-0127
270.1927 -25.0520    3.9  22.0 -122.9   2.1989   3.0    5.2	GX 5-1
270.3452 -25.7400    2.7  22.2 -124.8   3.1398   4.2    2.3	GRS 1758-258
273.9912 -13.9876    2.2  16.9  -91.0   3.6413   5.2    3.1	GX 17+2
275.9446 -30.3562    1.9  20.6 -142.9   4.3527   6.2    1.2	H1820-303
285.1664 -24.9456    4.3  11.2 -153.3   1.8312   2.7    7.3	HT1900.1-2455
288.8840  10.9689    8.7  26.5   -9.1   0.9762   1.3    5.2	GRS 1915+105
299.5912  35.2151    1.4  51.2    5.0  14.5869   8.2    0.8	Cyg X-1
263.0091 -33.8820    4.3  31.5 -134.7   2.3961   2.7    3.0	GX 354-0
329.5509 -42.2013    3.1  42.3  133.5   9.7188   3.8 ------	UNKNOWN
301.0617 -21.4815    2.9  11.0  121.2   2.9696   4.0 ------	UNKNOWN
289.6131 -69.4596    5.0  54.1  177.1   7.4143   2.3 ------	UNKNOWN
287.2265  39.6041    3.4  55.2   -7.5   7.7025   3.4 ------	UNKNOWN
263.1813   6.9679    2.4  35.8  -56.9   5.1447   4.7 ------	UNKNOWN