Analysis Summary
Notes:
- 1) No attempt has been made to eliminate the non-significant decimal places.
- 2) This batgrbproduct analysis is done using the HEASARC data.
- 3) This batgrbproduct analysis is using the flight position for the mask-weighting calculation.
======================================================================
                  BAT GRB EVENT DATA PROCESSING REPORT
    Process Script Ver: batgrbproduct v2.46
    Process Start Time: Thu Oct  1 10:09:11 EDT 2015
             Host Name: bat1
   Current Working Dir: /local/data/bat1/alien/Swift_3rdBATcatalog/event/batevent_reproc/trigger652334
======================================================================

  Trigger: 00652334      Segment: 000

  BAT Trigger Time: 461469928.384   [s; MET]
      Trigger Stop: 461469928.64   [s; MET]
               UTC: 2015-08-17T02:05:13.380060    [includes UTCF correction]
       Where From?: TDRSS position message

  BAT
    RA: 249.643455724632   Dec: -12.065631269064  [deg; J2000]

     Catalogged Source?: NO
     Point Source?:      YES
     GRB Indicated?:     YES    [ by BAT flight software ]
     Image S/N Ratio:    10.83
     Image Trigger?:     NO
     Rate S/N Ratio:     26.2678510731274  [ if not an image trigger ]
     Image S/N Ratio:    10.83

  Analysis Position:   [ source = BAT ]
    RA: 249.643455724632   Dec: -12.065631269064  [deg; J2000]

  Refined Position:   [ source = BAT pre-slew burst ]
    RA: 249.634059417604   Dec: -12.0519580068529  [deg; J2000]
        { 16h 38m 32.2s , -12d 03' 07.0" }
         +/- 0.738112703441205 [arcmin] (estimated 90% radius based on SNR)
         +/- 0.219918557222229 [arcmin] (formal 1-sigma fit error)
    SNR: 46.9369160821068

  Angular difference between the analysis and refined position is 0.988445 arcmin

  Partial Coding Fraction: 0.71875    [ including projection effects ]

  Duration
     T90: 37.9959999322891 +/- 2.13080735521689
        Measured from: -5.81999999284744
                   to: 32.1759999394417     [s; relative to TRIGTIME]
     T50: 15.9439999461174 +/- 2.59793456869933
        Measured from: 3.3759999871254
                   to: 19.3199999332428     [s; relative to TRIGTIME]


  Fluence
     Peak Flux  (peak 1 second)
        Measured from: 11.216000020504
                   to: 12.216000020504     [s; relative to TRIGTIME]
     Total Fluence
        Measured from: -16.7639999985695
                   to: 58.7319999933243     [s; relative to TRIGTIME]

             Band 1     Band 2     Band 3     Band 4
              15-25      25-50     50-100    100-350     keV
 Total     3.315471   4.021489   2.480141   0.480642
           0.065662   0.062314   0.051838   0.039379 [error]
 Peak      0.220231   0.402648   0.457270   0.152518
           0.011021   0.013023   0.013683   0.009564 [error]

     [ fluence units of on-axis counts / fully illuminated detector ]

======================================================================


====== Table of the duration information =============================

        Value   tstart    tstop
T100   75.496  -16.764   58.732
T90    37.996   -5.820   32.176
T50    15.944    3.376   19.320
Peak    1.000   11.216   12.216


====== Spectral Analysis Summary =====================================

Model      : spectral model: simple power-law (PL) and cutoff power-law (CPL)
Ph_index   : photon index: E^{Ph_index}
Ph_90err   : 90% error of the photon index
Epeak      : Epeak in keV
Epeak_90err: 90% error of Epeak
Norm       : normalization at 50 keV in both the PL model and CPL model
Nomr_90err : 90% error of the normalization
chi2       : Chi-Squared
dof        : degree of freedo

=== Time-averaged spectral analysis ===
(Best model with acceptable fit: PL)

Model Ph_index Ph_90err_low Ph_90err_hi  Epeak  Epeak_90err_low  Epeak_90err_hi  Norm       Nomr_90err_low    Norm_90err_hi    chi2    dof
PL      -1.775    -0.044      0.044       -           -               -         8.54e-03     -1.92e-04          1.92e-04      47.670   57
CPL     -1.605    -0.172      0.180      123.185     -37.785      7921.985      1.03e-02     -1.61e-03          2.15e-03      44.900   56


=== 1-s peak spectral analysis ===
(Best model with acceptable fit: N/A)

Model Ph_index Ph_90err_low Ph_90err_hi  Epeak  Epeak_90err_low  Epeak_90err_hi  Norm       Nomr_90err_low    Norm_90err_hi    chi2    dof
PL      -0.940     -0.061     0.062       -           -               -         8.36e-02     -2.88e-03          2.87e-03      43.290   57
CPL     -0.849     -0.117     0.241      758.910    -758.910      -758.910      9.15e-02     -1.31e-02          2.35e-02      42.840   56


=== Fluence/Peak Flux Summary ===

              Model    Band1     Band2     Band3     Band4     Band5     Total
                       15-25     25-50    50-100    100-350    15-150    15-350    keV
Fluence         PL   1.07e-06  1.66e-06  1.94e-06  4.37e-06  5.94e-06  9.03e-06   erg/cm2
      90%_error_low -4.75e-08 -4.22e-08 -5.63e-08 -2.84e-07 -1.36e-07 -3.15e-07   erg/cm2
      90%_error_hi   4.84e-08  4.22e-08  5.62e-08  2.97e-07  1.36e-07  3.24e-07   erg/cm2
Peak flux       PL   9.61e-04  9.85e-03  1.08e-01  1.18e+01  4.80e-01  1.20e+01   ph/cm2/s
      90%_error_low     N/A       N/A       N/A       N/A       N/A       N/A     ph/cm2/s
      90%_error_hi      N/A       N/A       N/A       N/A       N/A       N/A     ph/cm2/s

Fluence        CPL   1.02e-06  1.67e-06  1.96e-06  3.47e-06  5.86e-06  8.12e-06   erg/cm2
      90%_error_low -6.18e-08 -4.54e-08 -6.02e-08 -7.11e-07 -1.58e-07 -7.33e-07   erg/cm2
      90%_error_hi   6.30e-08  4.56e-08  6.07e-08  9.21e-07  1.58e-07  9.39e-07   erg/cm2
Peak flux      CPL   1.96e+00  2.85e+00  2.99e+00  5.18e+00  9.57e+00  1.30e+01   ph/cm2/s
      90%_error_low -1.94e-01 -1.28e-01 -1.16e-01 -1.07e+00 -3.46e-01 -1.13e+00   ph/cm2/s
      90%_error_hi   1.76e-01  1.29e-01  1.38e-01  7.17e-01  3.40e-01  7.48e-01   ph/cm2/s

======================================================================
Image
Pre-slew 15.0-350.0 keV image (Event data)
#   RAcent    DECcent   POSerr    Theta     Phi              Peak Cts       SNR   Name
  249.6341   -12.0520   0.0041    21.6837  -102.9729         3.8790332     46.937 TRIG_00652334

Foreground time interval of the image:
-16.764  10.117 (delta_t =  26.881 [sec])
Background time interval of the image:
-154.283 -16.764 (delta_t = 137.519 [sec])
Light Curves
Note: The mask-weighted lightcurves have units of either count/det or counts/sec/det, where a det is 0.4 x 0.4 = 0.16 sq cm.
Full-time range; 1 s binning
Other quick-look light curves:
- 64 ms binning (zoomed)
- 16 ms binning (zoomed)
- 8 ms binning (zoomed)
- 2 ms binning (zoomed)
- SN=5 or 10 s binning (full-time range)
- Raw light curve
Spectra
- 64 ms binning (zoomed)
- 16 ms binning (zoomed)
- 8 ms binning (zoomed)
- 2 ms binning (zoomed)
- SN=5 or 10 s binning (full-time range)
- Raw light curve
Spectra
Notes:
- 1) The fitting includes the systematic errors.
- 2) When the burst includes telescope slew time periods, the fitting uses an average response file made from multiple 5-s response files through out the slew time plus single time preiod for the non-slew times, and weighted by the total counts in the corresponding time period using addrmf. An average response file is needed becuase a spectral fit using the pre-slew DRM will introduce some errors in both a spectral shape and a normalization if the PHA file contains a lot of the slew/post-slew time interval.
- 3) For fits to more complicated models (e.g. a power-law over a cutoff power-law), the BAT team has decided to require a chi-square improvement of more than 6 for each extra dof.
Time averaged spectrum fit using the average DRM
Power-law model
Time interval is from  -16.764 sec. to   58.732 sec.

Spectral model in power-law:
------------------------------------------------------------
Parameters  : value       lower 90%   higher 90%
Photon index: -1.77457     ( -0.0443759   0.0442923 )
Norm@50keV  : 8.54140E-03    ( -0.000192276   0.000192213 )
------------------------------------------------------------
#Fit statistic : Chi-Squared =          47.67 using 59 PHA bins.
# Reduced chi-squared =         0.8363 for     57 degrees of freedom
# Null hypothesis probability =   8.059732e-01

Photon flux (15-150 keV)    in 75.5 sec: 1.16564 ( -0.03065  0.0308 ) ph/cm2/s
Energy fluence (15-150 keV)             : 5.94384e-06 ( -1.35698e-07  1.35932e-07 ) ergs/cm2
Cutoff power-law model
Time interval is from  -16.764 sec. to   58.732 sec.
Spectral model in the cutoff power-law:
------------------------------------------------------------
Parameters  : value       lower 90%   higher 90%
Photon index: -1.60532     ( -0.172488   0.180304 )
Epeak [keV] : 123.185      ( -37.7862 7921.98 )
Norm@50keV  : 1.02600E-02    ( -0.0016133   0.00215252 )
------------------------------------------------------------
#Fit statistic : Chi-Squared =          44.90 using 59 PHA bins.
# Reduced chi-squared =         0.8018 for     56 degrees of freedom
# Null hypothesis probability =   8.561870e-01

Photon flux (15-150 keV)    in 75.5 sec: 1.14792 ( -0.03514  0.03537 ) ph/cm2/s
Energy fluence (15-150 keV)             : 5.86337e-06 ( -1.58219e-07  1.57747e-07 ) ergs/cm2
1-s peak spectrum fit
Power-law model
Time interval is from   11.216 sec. to   12.216 sec.

Spectral model in power-law:
------------------------------------------------------------
Parameters  : value       lower 90%   higher 90%
Photon index: -0.940054     ( -0.0613719   0.0617734 )
Norm@50keV  : 8.36366E-02    ( -0.00287942   0.00287159 )
------------------------------------------------------------
#Fit statistic : Chi-Squared =          43.29 using 59 PHA bins.
# Reduced chi-squared =         0.7595 for     57 degrees of freedom
# Null hypothesis probability =   9.099384e-01

Photon flux (15-150 keV)    in 1 sec: 0.479969 (    ) ph/cm2/s
Energy fluence (15-150 keV)             : 9.24485e-07 ( -3.42186e-08  3.42973e-08 ) ergs/cm2
Cutoff power-law model
Time interval is from   11.216 sec. to   12.216 sec.
Spectral model in the cutoff power-law:
------------------------------------------------------------
Parameters  : value       lower 90%   higher 90%
Photon index: -0.8487     ( -0.116755   0.24112 )
Epeak [keV] : 758.910      ( -758.91 -758.91 )
Norm@50keV  : 9.14666E-02    ( -0.0131089   0.0235463 )
------------------------------------------------------------
#Fit statistic : Chi-Squared =          42.84 using 59 PHA bins.
# Reduced chi-squared =         0.7650 for     56 degrees of freedom
# Null hypothesis probability =   9.019059e-01

Photon flux (15-150 keV)    in 1 sec: 9.56870 ( -0.34598  0.3396 ) ph/cm2/s
Energy fluence (15-150 keV)             : 9.21446e-07 ( -3.52904e-08  3.48669e-08 ) ergs/cm2
Time-resolved spectra
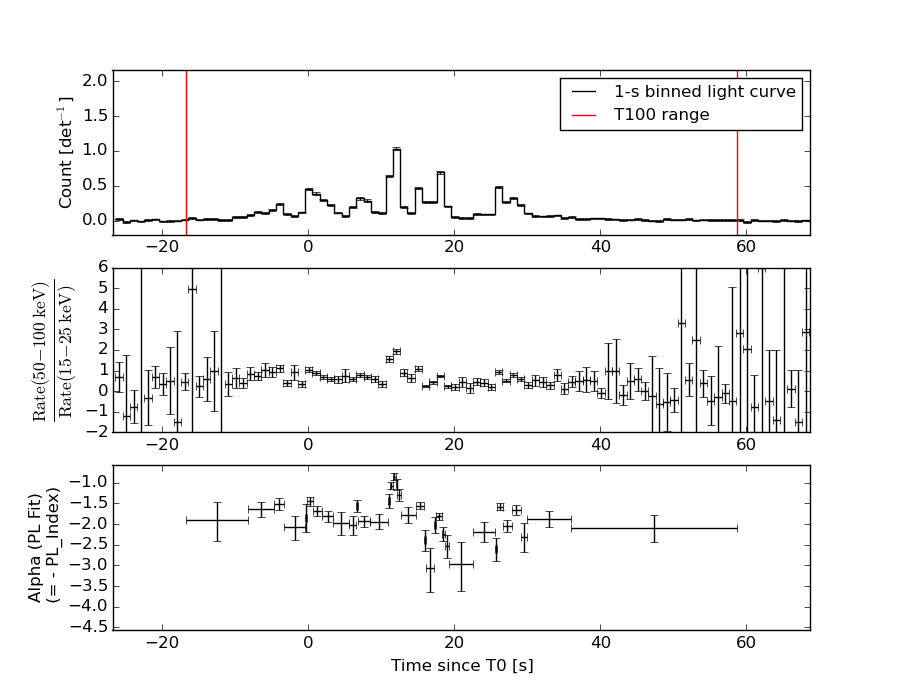
Distribution
T90 vs. Hardness ratio plot
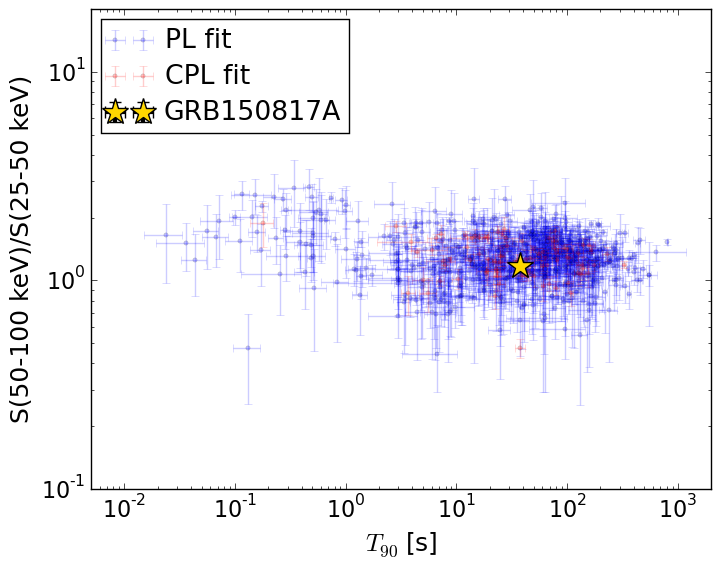
T90                                   = 37.996 sec.
Hardness ratio (energy fluence ratio) = 1.16917609172
S(15-50 keV) vs. S(50-150 keV) plot
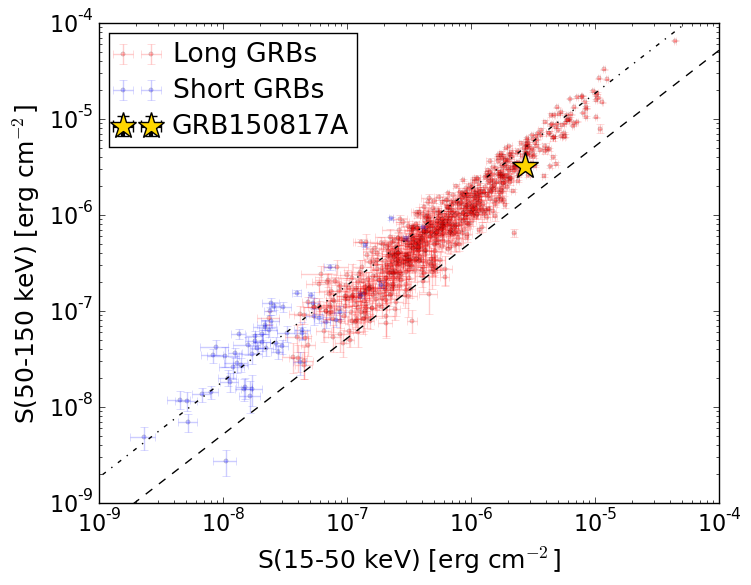
S(15-50 keV)  = 2.723698e-06
S(50-150 keV) = 3.220143e-06
The dash-dotted line and the dashed line traces the fluences calculated from the Band function with Epeak = 15 and 150 keV, respectively. Both lines assume a canonical values of alpha = -1 and beta = -2.5.
Mask shadow pattern
IMX = -8.926171229124183E-02, IMY = 3.874711303892153E-01
Spacecraft aspect plot
Bright source in the pre-burst/pre-slew/post-slew images
Pre-burst image of 15-350 keV band
Time interval of the image:
-154.283420 -16.764000

# RAcent  DECcent POSerr Theta    Phi  PeakCts   SNR AngSep     Name
#  [deg]    [deg]    ['] [deg]  [deg]                   [']
244.9887 -15.6387    0.5  26.9 -109.2   4.7844  23.7    0.5	Sco X-1
254.3189  35.2642    5.1  45.7  -18.7   0.5862   2.3    8.3	Her X-1
255.8897 -37.8533    9.7  33.3 -157.1  -0.1983  -1.2    4.6	4U 1700-377
256.5807 -36.5831   21.5  31.9 -156.8  -0.0835  -0.5   11.9	GX 349+2
262.8521 -24.6395    3.0  18.8 -155.3   0.5662   3.9   10.7	GX 1+4
264.5758 -44.2994    5.5  37.2 -171.5   0.3908   2.1   11.5	4U 1735-44
268.2200  -1.5005    7.8   6.8  -25.4  -0.2160  -1.5    9.3	SW J1753.5-0127
270.2611 -25.0525    7.6  17.5 -176.6   0.2026   1.5    2.0	GX 5-1
270.2517 -25.7882    3.1  18.2 -176.7   0.5048   3.7    3.9	GRS 1758-258
274.0745 -13.8850    3.4   6.9  156.6   0.4732   3.4    9.9	GX 17+2
275.7609 -30.2244    0.0  23.0  170.5   0.0814   0.6   12.1	H1820-303
284.8719 -24.7900    0.0  21.6  145.0   0.2255   1.4   11.9	HT1900.1-2455
288.8707  10.7989    7.9  25.5   44.6  -0.2657  -1.5    9.8	GRS 1915+105
299.6031  35.2286    1.4  50.5   30.9   5.6309   8.0    1.7	Cyg X-1
263.0544 -33.6892   18.9  27.2 -164.4   0.0886   0.6    9.3	GX 354-0
311.6649 -13.4391    2.8  40.2  102.5   2.3845   4.1 ------	UNKNOWN
287.2203 -16.9859    2.7  18.3  123.1   0.6455   4.2 ------	UNKNOWN
257.5214 -32.2393    2.2  27.7 -153.9   0.7814   5.2 ------	UNKNOWN
245.3017 -16.8055    2.4  26.9 -111.8   0.9605   4.7 ------	UNKNOWN
239.7676 -52.7708    2.9  51.9 -155.7   1.4590   3.9 ------	UNKNOWN
240.5364  44.4981    2.8  58.9  -24.5   4.0225   4.1 ------	UNKNOWN
	UNKNOWN
	UNKNOWN
Pre-slew background subtracted image of 15-350 keV band
Time interval of the image:
-16.764000 10.116600

# RAcent  DECcent POSerr Theta    Phi  PeakCts   SNR AngSep     Name
#  [deg]    [deg]    ['] [deg]  [deg]                   [']
244.8433 -15.6910   10.6  27.0 -109.2  -0.1019  -1.1    8.4	Sco X-1
254.5868  35.2131    0.0  45.6  -18.4  -0.1130  -0.9   10.0	Her X-1
255.8649 -37.7353   16.7  33.2 -156.9   0.0563   0.7    8.7	4U 1700-377
256.3883 -36.5658    5.3  32.0 -156.6   0.1826   2.2    8.9	GX 349+2
263.0883 -24.8876   13.5  19.0 -156.2   0.0604   0.9    9.6	GX 1+4
264.5749 -44.4289    6.3  37.3 -171.6  -0.1667  -1.8    7.3	4U 1735-44
268.5166  -1.3396    6.6   6.8  -22.5   0.1207   1.7   11.2	SW J1753.5-0127
270.2808 -25.0817  184.5  17.5 -176.7  -0.0041  -0.1    0.2	GX 5-1
270.3001 -25.7394   42.3  18.2 -176.8   0.0187   0.3    0.3	GRS 1758-258
274.0027 -14.0219   80.6   7.0  157.6   0.0100   0.1    0.9	GX 17+2
276.0892 -30.5094    0.0  23.4  169.9  -0.2227  -3.1   12.0	H1820-303
284.8719 -24.7900    0.0  21.6  145.0  -0.0727  -0.9   11.9	HT1900.1-2455
288.7793  10.9767    6.7  25.5   44.2   0.1525   1.7    2.2	GRS 1915+105
299.5993  35.2071    5.5  50.5   30.9  -0.7393  -2.1    0.5	Cyg X-1
263.1336 -33.7153    6.3  27.2 -164.6   0.1364   1.8   10.2	GX 354-0
302.3987  32.3958    2.2  49.8   35.6   1.7899   5.3 ------	UNKNOWN
287.7003 -59.4056    2.5  53.3  170.2   1.2315   4.6 ------	UNKNOWN
275.3813  -6.7540    2.0   4.3   79.7   0.3927   5.9 ------	UNKNOWN
249.6341 -12.0520    0.2  21.7 -103.0   3.8789  46.9 ------	UNKNOWN
249.5139  25.3986    2.5  39.1  -31.2   0.4886   4.5 ------	UNKNOWN
Post-slew image of 15-350 keV band
Time interval of the image:
54.116600 482.746000

# RAcent  DECcent POSerr Theta    Phi  PeakCts   SNR AngSep     Name
#  [deg]    [deg]    ['] [deg]  [deg]                   [']
244.9874 -15.6459    0.3   5.8 -139.5   5.6588  35.6    0.6	Sco X-1
254.5441  35.3787   10.9  47.7   -5.3   0.3596   1.1    4.8	Her X-1
255.9092 -37.9137    4.3  26.5  158.2   0.5405   2.7    5.6	4U 1700-377
256.3401 -36.5539   14.1  25.2  156.7   0.1672   0.8    9.1	GX 349+2
262.8578 -24.6616    8.3  17.7  126.5   0.2459   1.4    9.7	GX 1+4
264.7488 -44.4639    3.8  34.9  150.4   0.8849   3.0    0.9	4U 1735-44
268.5006  -1.3309    4.7  21.5   50.9  -0.5033  -2.5   10.8	SW J1753.5-0127
270.3769 -24.9420   25.4  23.4  115.6   0.0971   0.5    9.7	GX 5-1
270.3795 -25.6051    2.9  23.8  117.0   0.8688   4.0    9.3	GRS 1758-258
273.9525 -13.9500    3.0  23.7   86.6   0.8665   3.8    6.0	GX 17+2
275.9513 -30.4779   20.2  30.5  120.6   0.1605   0.6    6.8	H1820-303
285.2002 -24.8991    6.0  35.9  105.4   0.8648   1.9    9.0	HT1900.1-2455
288.7106  10.8432    6.2  45.0   50.3   1.4793   1.9    8.0	GRS 1915+105
262.8682 -33.9744    5.5  25.0  142.7   0.4129   2.1   10.3	GX 354-0
258.9794  -6.9535    3.0  10.5   51.1   0.6551   3.9 ------	UNKNOWN
265.4887  42.3615    2.1  56.3    3.3   5.2752   5.5 ------	UNKNOWN
255.2782   4.7070    2.6  17.7    8.0   0.7373   4.5 ------	UNKNOWN
203.4539 -23.6562    2.5  45.3 -122.1   3.7889   4.6 ------	UNKNOWN
201.2586 -29.0658    3.9  48.0 -129.1   2.5263   3.0 ------	UNKNOWN
203.2723 -23.1508    3.7  45.4 -121.4   2.5314   3.1 ------	UNKNOWN