Analysis Summary
Notes:
- 1) No attempt has been made to eliminate the non-significant decimal places.
- 2) This batgrbproduct analysis is done using the HEASARC data.
- 3) This batgrbproduct analysis is using the flight position for the mask-weighting calculation.
======================================================================
BAT GRB EVENT DATA PROCESSING REPORT
Process Script Ver: batgrbproduct v2.46
Process Start Time: Tue Sep 29 20:07:32 EDT 2015
Host Name: bat1
Current Working Dir: /local/data/bat1/alien/Swift_3rdBATcatalog/event/batevent_reproc/trigger652603
======================================================================
Trigger: 00652603 Segment: 000
BAT Trigger Time: 461590607.936 [s; MET]
Trigger Stop: 461590608.96 [s; MET]
UTC: 2015-08-18T11:36:32.925720 [includes UTCF correction]
Where From?: TDRSS position message
BAT
RA: 230.446048357731 Dec: 68.3422608837458 [deg; J2000]
Catalogged Source?: NO
Point Source?: YES
GRB Indicated?: YES [ by BAT flight software ]
Image S/N Ratio: 8.04
Image Trigger?: NO
Rate S/N Ratio: 12.9228479833201 [ if not an image trigger ]
Image S/N Ratio: 8.04
Analysis Position: [ source = BAT ]
RA: 230.446048357731 Dec: 68.3422608837458 [deg; J2000]
Refined Position: [ source = BAT pre-slew burst ]
RA: 230.340916903984 Dec: 68.3429974885415 [deg; J2000]
{ 15h 21m 21.8s , +68d 20' 34.8" }
+/- 1.24475611457742 [arcmin] (estimated 90% radius based on SNR)
+/- 0.431186498930022 [arcmin] (formal 1-sigma fit error)
SNR: 22.2476278372372
Angular difference between the analysis and refined position is 2.328379 arcmin
Partial Coding Fraction: 0.3632812 [ including projection effects ]
Duration
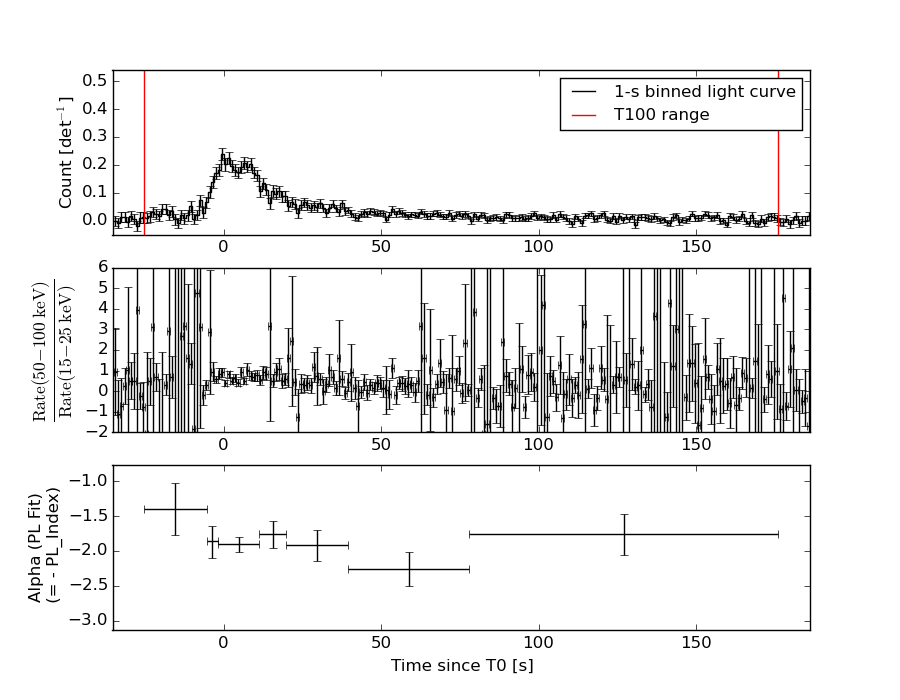
T90: 143.055999934673 +/- 21.8026197181464
Measured from: -9.32400000095367
to: 133.73199993372 [s; relative to TRIGTIME]
T50: 42.3679999113083 +/- 7.07170700025133
Measured from: 2.16000002622604
to: 44.5279999375343 [s; relative to TRIGTIME]
Fluence
Peak Flux (peak 1 second)
Measured from: 1.56800001859665
to: 2.56800001859665 [s; relative to TRIGTIME]
Total Fluence
Measured from: -25.255999982357
to: 176.019999980927 [s; relative to TRIGTIME]
Band 1 Band 2 Band 3 Band 4
15-25 25-50 50-100 100-350 keV
Total 2.460942 2.703435 1.669661 0.332793
0.102662 0.103564 0.091519 0.081170 [error]
Peak 0.095708 0.095713 0.060636 0.003202
0.012028 0.012093 0.010674 0.008416 [error]
[ fluence units of on-axis counts / fully illuminated detector ]
======================================================================
====== Table of the duration information =============================
Value tstart tstop
T100 201.276 -25.256 176.020
T90 143.056 -9.324 133.732
T50 42.368 2.160 44.528
Peak 1.000 1.568 2.568
====== Spectral Analysis Summary =====================================
Model : spectral model: simple power-law (PL) and cutoff power-law (CPL)
Ph_index : photon index: E^{Ph_index}
Ph_90err : 90% error of the photon index
Epeak : Epeak in keV
Epeak_90err: 90% error of Epeak
Norm : normalization at 50 keV in both the PL model and CPL model
Nomr_90err : 90% error of the normalization
chi2 : Chi-Squared
dof : degree of freedo
=== Time-averaged spectral analysis ===
(Best model with acceptable fit: PL)
Model Ph_index Ph_90err_low Ph_90err_hi Epeak Epeak_90err_low Epeak_90err_hi Norm Nomr_90err_low Norm_90err_hi chi2 dof
PL -1.875 -0.092 0.091 - - - 2.30e-03 -1.17e-04 1.16e-04 55.520 57
CPL -1.878 -0.089 0.264 9999.360 -9999.350 -9999.360 2.30e-03 -1.13e-04 8.05e-04 55.530 56
=== 1-s peak spectral analysis ===
(Best model with acceptable fit: PL)
Model Ph_index Ph_90err_low Ph_90err_hi Epeak Epeak_90err_low Epeak_90err_hi Norm Nomr_90err_low Norm_90err_hi chi2 dof
PL -1.978 -0.282 0.263 - - - 1.59e-02 -2.77e-03 2.67e-03 60.200 57
CPL -1.922 -0.298 1.046 62.276 N/A N/A 1.70e-02 N/A N/A 60.190 56
=== Fluence/Peak Flux Summary ===
Model Band1 Band2 Band3 Band4 Band5 Total
15-25 25-50 50-100 100-350 15-150 15-350 keV
Fluence PL 8.42e-07 1.23e-06 1.34e-06 2.75e-06 4.26e-06 6.16e-06 erg/cm2
90%_error_low -6.63e-08 -5.79e-08 -9.43e-08 -3.92e-07 -2.15e-07 -4.72e-07 erg/cm2
90%_error_hi 6.80e-08 5.78e-08 9.44e-08 4.35e-07 2.16e-07 5.04e-07 erg/cm2
Peak flux PL 1.03e+00 7.86e-01 3.99e-01 2.91e-01 2.35e+00 2.51e+00 ph/cm2/s
90%_error_low -2.17e-01 -1.10e-01 -9.09e-02 -1.12e-01 -3.34e-01 -3.52e-01 ph/cm2/s
90%_error_hi 2.28e-01 1.10e-01 9.13e-02 1.47e-01 3.35e-01 3.53e-01 ph/cm2/s
Fluence CPL 8.51e-07 1.23e-06 1.34e-06 2.74e-06 4.29e-06 6.19e-06 erg/cm2
90%_error_low N/A -5.66e-08 -5.91e-08 N/A -3.32e-07 -1.03e-06 erg/cm2
90%_error_hi N/A 5.64e-08 9.70e-08 N/A 2.66e-07 4.84e-07 erg/cm2
Peak flux CPL 1.03e+00 7.91e-01 4.00e-01 2.68e-01 2.35e+00 2.49e+00 ph/cm2/s
90%_error_low N/A -1.34e-01 -9.10e-02 -2.68e-01 -3.46e-01 -4.28e-01 ph/cm2/s
90%_error_hi N/A 1.39e-01 9.45e-02 1.10e-01 3.30e-01 3.98e-01 ph/cm2/s
======================================================================
Image
Pre-slew 15.0-350.0 keV image (Event data)
#   RAcent    DECcent   POSerr    Theta     Phi              Peak Cts       SNR   Name
  230.3409    68.3430   0.0087    43.9202  -149.4753         3.9481260     22.248 TRIG_00652603

Foreground time interval of the image:
-25.256  13.365 (delta_t =  38.621 [sec])
Background time interval of the image:
-65.635 -25.256 (delta_t =  40.379 [sec])
Light Curves
Note: The mask-weighted lightcurves have units of either count/det or counts/sec/det, where a det is 0.4 x 0.4 = 0.16 sq cm.
Full-time range; 1 s binning
Other quick-look light curves:
- 64 ms binning (zoomed)
- 16 ms binning (zoomed)
- 8 ms binning (zoomed)
- 2 ms binning (zoomed)
- SN=5 or 10 s binning (full-time range)
- Raw light curve
Spectra
- 64 ms binning (zoomed)
- 16 ms binning (zoomed)
- 8 ms binning (zoomed)
- 2 ms binning (zoomed)
- SN=5 or 10 s binning (full-time range)
- Raw light curve
Spectra
Notes:
- 1) The fitting includes the systematic errors.
- 2) When the burst includes telescope slew time periods, the fitting uses an average response file made from multiple 5-s response files through out the slew time plus single time preiod for the non-slew times, and weighted by the total counts in the corresponding time period using addrmf. An average response file is needed becuase a spectral fit using the pre-slew DRM will introduce some errors in both a spectral shape and a normalization if the PHA file contains a lot of the slew/post-slew time interval.
- 3) For fits to more complicated models (e.g. a power-law over a cutoff power-law), the BAT team has decided to require a chi-square improvement of more than 6 for each extra dof.
Time averaged spectrum fit using the average DRM
Power-law model
Time interval is from  -25.256 sec. to  176.020 sec.

Spectral model in power-law:
------------------------------------------------------------
Parameters  : value       lower 90%   higher 90%
Photon index: -1.87493     ( -0.092134   0.090832 )
Norm@50keV  : 2.30203E-03    ( -0.000116681   0.000115771 )
------------------------------------------------------------
#Fit statistic : Chi-Squared =          55.52 using 59 PHA bins.
# Reduced chi-squared =         0.9741 for     57 degrees of freedom
# Null hypothesis probability =   5.306093e-01

Photon flux (15-150 keV)    in 201.3 sec: 0.326925 ( -0.015936  0.016003 ) ph/cm2/s
Energy fluence (15-150 keV)             : 4.26074e-06 ( -2.1485e-07  2.1592e-07 ) ergs/cm2
Cutoff power-law model
Time interval is from  -25.256 sec. to  176.020 sec.
Spectral model in the cutoff power-law:
------------------------------------------------------------
Parameters  : value       lower 90%   higher 90%
Photon index: -1.87793     ( -0.0903246   0.262829 )
Epeak [keV] : 9999.36      ( -9999.35 -9999.36 )
Norm@50keV  : 2.29974E-03    ( -0.000116415   0.000801632 )
------------------------------------------------------------
#Fit statistic : Chi-Squared =          55.53 using 59 PHA bins.
# Reduced chi-squared =         0.9916 for     56 degrees of freedom
# Null hypothesis probability =   4.925135e-01

Photon flux (15-150 keV)    in 201.3 sec: 0.328568 ( -0.02363  0.019563 ) ph/cm2/s
Energy fluence (15-150 keV)             : 4.28523e-06 ( -3.32171e-07  2.65629e-07 ) ergs/cm2
1-s peak spectrum fit
Power-law model
Time interval is from    1.568 sec. to    2.568 sec.

Spectral model in power-law:
------------------------------------------------------------
Parameters  : value       lower 90%   higher 90%
Photon index: -1.97822     ( -0.282286   0.263029 )
Norm@50keV  : 1.58532E-02    ( -0.00276815   0.00266936 )
------------------------------------------------------------
#Fit statistic : Chi-Squared =          60.20 using 59 PHA bins.
# Reduced chi-squared =          1.056 for     57 degrees of freedom
# Null hypothesis probability =   3.608438e-01

Photon flux (15-150 keV)    in 1 sec: 2.35464 ( -0.33445  0.33497 ) ph/cm2/s
Energy fluence (15-150 keV)             : 1.4607e-07 ( -2.37972e-08  2.42596e-08 ) ergs/cm2
Cutoff power-law model
Time interval is from    1.568 sec. to    2.568 sec.
Spectral model in the cutoff power-law:
------------------------------------------------------------
Parameters  : value       lower 90%   higher 90%
Photon index: -1.92171     ( -0.297982   1.04557 )
Epeak [keV] : 62.2764      (   )
Norm@50keV  : 1.70356E-02    (     )
------------------------------------------------------------
#Fit statistic : Chi-Squared =          60.19 using 59 PHA bins.
# Reduced chi-squared =          1.075 for     56 degrees of freedom
# Null hypothesis probability =   3.268249e-01

Photon flux (15-150 keV)    in 1 sec: 2.34914 ( -0.34559  0.3295 ) ph/cm2/s
Energy fluence (15-150 keV)             : 0 ( 0  0 ) ergs/cm2
Time-resolved spectra
Distribution
T90 vs. Hardness ratio plot
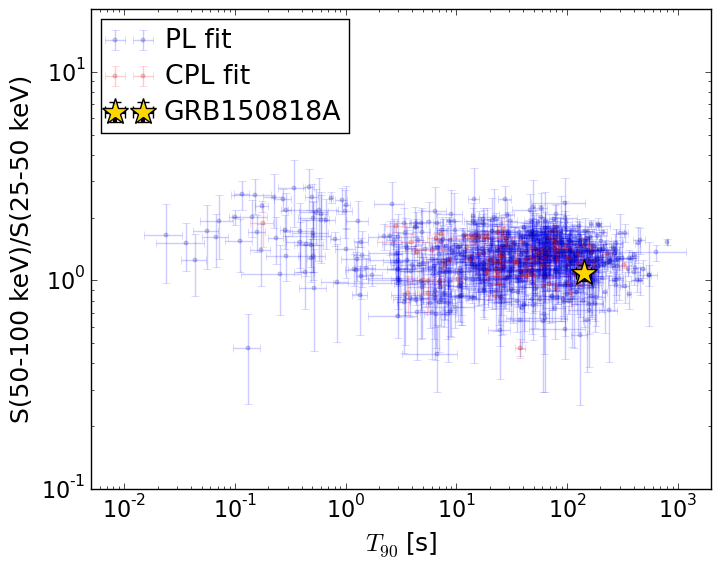
T90                                   = 143.056 sec.
Hardness ratio (energy fluence ratio) = 1.09058621915
S(15-50 keV) vs. S(50-150 keV) plot
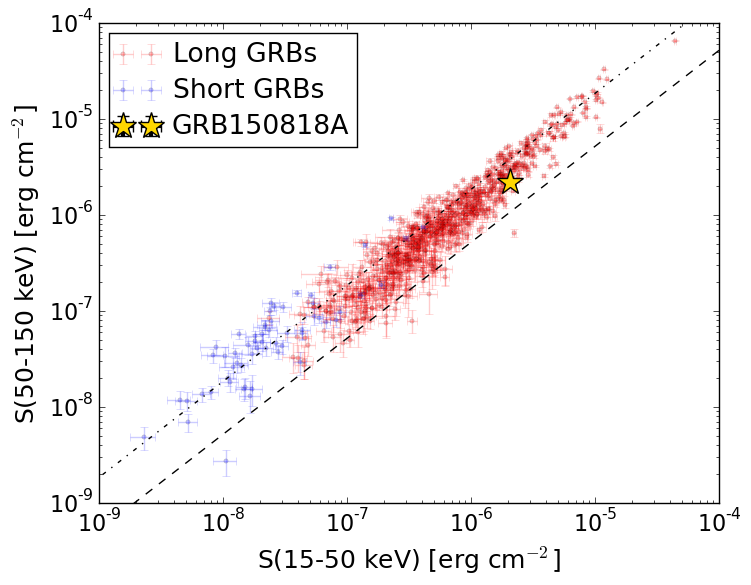
S(15-50 keV)  = 2.0747195e-06
S(50-150 keV) = 2.1859708e-06
The dash-dotted line and the dashed line traces the fluences calculated from the Band function with Epeak = 15 and 150 keV, respectively. Both lines assume a canonical values of alpha = -1 and beta = -2.5.
Mask shadow pattern
IMX = -8.295371942011757E-01, IMY = 4.891173970783941E-01
Spacecraft aspect plot
Bright source in the pre-burst/pre-slew/post-slew images
Pre-burst image of 15-350 keV band
Time interval of the image:
-65.635410 -25.256000

# RAcent  DECcent POSerr Theta    Phi  PeakCts   SNR AngSep     Name
#  [deg]    [deg]    ['] [deg]  [deg]                   [']
299.6464  35.1880    4.1  48.7  139.2   1.0206   2.8    2.9	Cyg X-1
308.1259  41.0065   11.4  40.2  135.9   0.1841   1.0    3.3	Cyg X-3
326.3317  38.1535    0.0  35.0  113.9   0.0909   0.6   12.6	Cyg X-2
 18.2349  14.8234    2.5  50.0   37.1   1.5215   4.6 ------	UNKNOWN
 25.0579  40.8967    2.3  25.6   18.1   0.3499   5.1 ------	UNKNOWN
 53.7720  53.1684    0.8  26.2  -35.8   1.1574  15.3 ------	UNKNOWN
185.6082  83.7154    2.8  32.2 -127.6   0.3891   4.1 ------	UNKNOWN
Pre-slew background subtracted image of 15-350 keV band
Time interval of the image:
-25.256000 13.364600

# RAcent  DECcent POSerr Theta    Phi  PeakCts   SNR AngSep     Name
#  [deg]    [deg]    ['] [deg]  [deg]                   [']
299.6950  35.3150   11.7  48.6  139.3   0.4879   1.0    8.5	Cyg X-1
308.2968  40.9532    6.6  40.2  135.7   0.4259   1.7    8.5	Cyg X-3
326.1754  38.3176   23.2  35.0  114.2  -0.1051  -0.5    0.3	Cyg X-2
 25.9093  14.3877    2.7  51.5   27.7   1.8573   4.3 ------	UNKNOWN
263.8408  75.0804    3.1  32.3 -155.8   0.4280   3.7 ------	UNKNOWN
230.3409  68.3430    0.5  43.9 -149.5   3.9475  22.2 ------	UNKNOWN
Post-slew image of 15-350 keV band
Time interval of the image:
73.764600 122.564600

# RAcent  DECcent POSerr Theta    Phi  PeakCts   SNR AngSep     Name
#  [deg]    [deg]    ['] [deg]  [deg]                   [']
254.3739  35.4386    3.9  35.5  147.2   0.3548   2.9    7.1	Her X-1
230.3302  68.3036    1.4   0.1 -124.2   0.5959   8.2 ------	UNKNOWN
221.5359  18.0965    2.4  50.6 -167.2   0.8546   4.8 ------	UNKNOWN
 86.2547  49.7908    2.9  58.9  -24.4   1.8798   4.0 ------	UNKNOWN