Analysis Summary
Notes:
- 1) No attempt has been made to eliminate the non-significant decimal places.
- 2) This batgrbproduct analysis is done using the HEASARC data.
- 3) This batgrbproduct analysis is using the flight position for the mask-weighting calculation.
======================================================================
BAT GRB EVENT DATA PROCESSING REPORT
Process Script Ver: batgrbproduct v2.46
Process Start Time: Tue Sep 29 20:04:20 EDT 2015
Host Name: bat1
Current Working Dir: /local/data/bat1/alien/Swift_3rdBATcatalog/event/batevent_reproc/trigger652643
======================================================================
Trigger: 00652643 Segment: 000
BAT Trigger Time: 461638224 [s; MET]
Trigger Stop: 461638288 [s; MET]
UTC: 2015-08-19T00:50:08.987220 [includes UTCF correction]
Where From?: TDRSS position message
BAT
RA: 42.336760697218 Dec: 9.78396975898111 [deg; J2000]
Catalogged Source?: NO
Point Source?: YES
GRB Indicated?: YES [ by BAT flight software ]
Image S/N Ratio: 7.26
Image Trigger?: YES
Rate S/N Ratio: 0 [ if not an image trigger ]
Image S/N Ratio: 7.26
Analysis Position: [ source = BAT ]
RA: 42.336760697218 Dec: 9.78396975898111 [deg; J2000]
Refined Position: [ source = BAT pre-slew burst ]
RA: 42.3212286326767 Dec: 9.79016069906509 [deg; J2000]
{ 02h 49m 17.1s , +09d 47' 24.6" }
+/- 2.4953130795547 [arcmin] (estimated 90% radius based on SNR)
+/- 1.10044691523558 [arcmin] (formal 1-sigma fit error)
SNR: 8.23752773727741
Angular difference between the analysis and refined position is 0.990640 arcmin
Partial Coding Fraction: 0.9375 [ including projection effects ]
Duration
T90: 51.6640000343323 +/- 13.6032043200312
Measured from: 17.1439999938011
to: 68.8080000281334 [s; relative to TRIGTIME]
T50: 23.120000064373 +/- 8.10791609954051
Measured from: 28.3759999871254
to: 51.4960000514984 [s; relative to TRIGTIME]
Fluence
Peak Flux (peak 1 second)
Measured from: 17.6759999990463
to: 18.6759999990463 [s; relative to TRIGTIME]
Total Fluence
Measured from: 14.0080000162125
to: 73.4480000138283 [s; relative to TRIGTIME]
Band 1 Band 2 Band 3 Band 4
15-25 25-50 50-100 100-350 keV
Total 0.271273 0.319954 0.179621 0.096056
0.043321 0.044081 0.038185 0.033810 [error]
Peak 0.016890 0.011093 0.007533 0.007146
0.005548 0.005727 0.004836 0.004491 [error]
[ fluence units of on-axis counts / fully illuminated detector ]
======================================================================
====== Table of the duration information =============================
Value tstart tstop
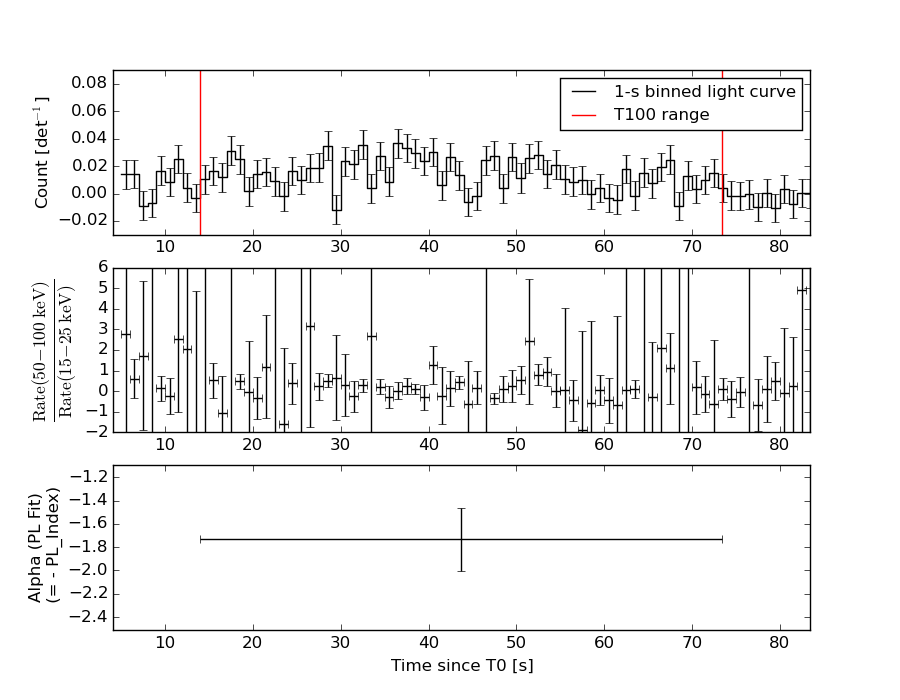
T100 59.440 14.008 73.448
T90 51.664 17.144 68.808
T50 23.120 28.376 51.496
Peak 1.000 17.676 18.676
====== Spectral Analysis Summary =====================================
Model : spectral model: simple power-law (PL) and cutoff power-law (CPL)
Ph_index : photon index: E^{Ph_index}
Ph_90err : 90% error of the photon index
Epeak : Epeak in keV
Epeak_90err: 90% error of Epeak
Norm : normalization at 50 keV in both the PL model and CPL model
Nomr_90err : 90% error of the normalization
chi2 : Chi-Squared
dof : degree of freedo
=== Time-averaged spectral analysis ===
(Best model with acceptable fit: PL)
Model Ph_index Ph_90err_low Ph_90err_hi Epeak Epeak_90err_low Epeak_90err_hi Norm Nomr_90err_low Norm_90err_hi chi2 dof
PL -1.730 -0.279 0.266 - - - 8.56e-04 -1.51e-04 1.48e-04 45.060 57
CPL -1.165 -1.067 1.504 64.119 -24.567 -64.119 1.79e-03 -1.79e-03 1.09e-02 44.380 56
=== 1-s peak spectral analysis ===
(Best model with acceptable fit: N/A)
Model Ph_index Ph_90err_low Ph_90err_hi Epeak Epeak_90err_low Epeak_90err_hi Norm Nomr_90err_low Norm_90err_hi chi2 dof
PL -2.295 -1.364 0.850 - - - 1.82e-03 -1.82e-03 1.22e-03 57.690 57
CPL -2.557 -0.271 3.750 205.648 N/A N/A 1.32e-03 N/A N/A 57.650 56
=== Fluence/Peak Flux Summary ===
Model Band1 Band2 Band3 Band4 Band5 Total
15-25 25-50 50-100 100-350 15-150 15-350 keV
Fluence PL 8.06e-08 1.29e-07 1.55e-07 3.66e-07 4.70e-07 7.31e-07 erg/cm2
90%_error_low -1.79e-08 -1.96e-08 -3.64e-08 -1.48e-07 -8.51e-08 -1.90e-07 erg/cm2
90%_error_hi 1.86e-08 1.96e-08 3.68e-08 2.04e-07 8.73e-08 2.34e-07 erg/cm2
Peak flux PL 1.62e-01 1.02e-01 4.17e-02 2.30e-02 3.18e-01 3.29e-01 ph/cm2/s
90%_error_low -8.32e-02 -5.39e-02 -3.36e-02 -2.30e-02 -1.32e-01 -1.40e-01 ph/cm2/s
90%_error_hi 8.63e-02 4.58e-02 4.14e-02 6.54e-02 1.32e-01 1.43e-01 ph/cm2/s
Fluence CPL 7.65e-08 1.38e-07 1.54e-07 1.41e-07 4.42e-07 5.10e-07 erg/cm2
90%_error_low -2.06e-08 -2.46e-08 -4.35e-08 -1.18e-07 -9.76e-08 -1.60e-07 erg/cm2
90%_error_hi 2.05e-08 2.89e-08 4.00e-08 3.65e-07 1.03e-07 3.01e-07 erg/cm2
Peak flux CPL 1.55e-01 1.06e-01 4.16e-02 1.65e-02 3.16e-01 3.22e-01 ph/cm2/s
90%_error_low -9.39e-02 -4.52e-02 -2.39e-02 N/A N/A N/A ph/cm2/s
90%_error_hi 8.25e-02 3.39e-02 3.49e-02 N/A N/A N/A ph/cm2/s
======================================================================
Image
Pre-slew 15.0-350.0 keV image (Event data)
#   RAcent    DECcent   POSerr    Theta     Phi              Peak Cts       SNR   Name
   42.3212     9.7902   0.0232    22.7628    -5.3589         0.7769026      8.238 TRIG_00652643

Foreground time interval of the image:
 14.008  73.101 (delta_t =  59.093 [sec])
Background time interval of the image:
-239.000  14.008 (delta_t = 253.008 [sec])
Light Curves
Note: The mask-weighted lightcurves have units of either count/det or counts/sec/det, where a det is 0.4 x 0.4 = 0.16 sq cm.
Full-time range; 1 s binning
Other quick-look light curves:
- 64 ms binning (zoomed)
- 16 ms binning (zoomed)
- 8 ms binning (zoomed)
- 2 ms binning (zoomed)
- SN=5 or 10 s binning (full-time range)
- Raw light curve
Spectra
- 64 ms binning (zoomed)
- 16 ms binning (zoomed)
- 8 ms binning (zoomed)
- 2 ms binning (zoomed)
- SN=5 or 10 s binning (full-time range)
- Raw light curve
Spectra
Notes:
- 1) The fitting includes the systematic errors.
- 2) When the burst includes telescope slew time periods, the fitting uses an average response file made from multiple 5-s response files through out the slew time plus single time preiod for the non-slew times, and weighted by the total counts in the corresponding time period using addrmf. An average response file is needed becuase a spectral fit using the pre-slew DRM will introduce some errors in both a spectral shape and a normalization if the PHA file contains a lot of the slew/post-slew time interval.
- 3) For fits to more complicated models (e.g. a power-law over a cutoff power-law), the BAT team has decided to require a chi-square improvement of more than 6 for each extra dof.
Time averaged spectrum fit using the average DRM
Power-law model
Time interval is from   14.008 sec. to   73.448 sec.

Spectral model in power-law:
------------------------------------------------------------
Parameters  : value       lower 90%   higher 90%
Photon index: -1.72964     ( -0.278934   0.266247 )
Norm@50keV  : 8.55671E-04    ( -0.000151343   0.000147524 )
------------------------------------------------------------
#Fit statistic : Chi-Squared =          45.06 using 59 PHA bins.
# Reduced chi-squared =         0.7906 for     57 degrees of freedom
# Null hypothesis probability =   8.736079e-01

Photon flux (15-150 keV)    in 59.44 sec: 0.114850 ( -0.0175486  0.017555 ) ph/cm2/s
Energy fluence (15-150 keV)             : 4.69968e-07 ( -8.50586e-08  8.72544e-08 ) ergs/cm2
Cutoff power-law model
Time interval is from   14.008 sec. to   73.448 sec.
Spectral model in the cutoff power-law:
------------------------------------------------------------
Parameters  : value       lower 90%   higher 90%
Photon index: -1.16507     ( -1.06698   1.50347 )
Epeak [keV] : 64.1194      ( -24.5591 -64.1112 )
Norm@50keV  : 1.78513E-03    ( -0.0017856   0.0109461 )
------------------------------------------------------------
#Fit statistic : Chi-Squared =          44.38 using 59 PHA bins.
# Reduced chi-squared =         0.7925 for     56 degrees of freedom
# Null hypothesis probability =   8.687236e-01

Photon flux (15-150 keV)    in 59.44 sec: 0.112472 ( -0.0183026  0.018224 ) ph/cm2/s
Energy fluence (15-150 keV)             : 4.41976e-07 ( -9.75559e-08  1.03278e-07 ) ergs/cm2
1-s peak spectrum fit
Power-law model
Time interval is from   17.676 sec. to   18.676 sec.

Spectral model in power-law:
------------------------------------------------------------
Parameters  : value       lower 90%   higher 90%
Photon index: -2.29508     ( -1.36373   0.849725 )
Norm@50keV  : 1.82461E-03    ( -0.00182457   0.0012245 )
------------------------------------------------------------
#Fit statistic : Chi-Squared =          57.69 using 59 PHA bins.
# Reduced chi-squared =          1.012 for     57 degrees of freedom
# Null hypothesis probability =   4.493780e-01

Photon flux (15-150 keV)    in 1 sec: 0.318039 ( -0.131799  0.13186 ) ph/cm2/s
Energy fluence (15-150 keV)             : 1.74241e-08 ( -9.34003e-09  1.06748e-08 ) ergs/cm2
Cutoff power-law model
Time interval is from   17.676 sec. to   18.676 sec.
Spectral model in the cutoff power-law:
------------------------------------------------------------
Parameters  : value       lower 90%   higher 90%
Photon index: -2.55653     ( -0.253567   3.76707 )
Epeak [keV] : 205.648      (   )
Norm@50keV  : 1.32121E-03    (     )
------------------------------------------------------------
#Fit statistic : Chi-Squared =          57.65 using 59 PHA bins.
# Reduced chi-squared =          1.029 for     56 degrees of freedom
# Null hypothesis probability =   4.140643e-01

Photon flux (15-150 keV)    in 1 sec: 0.315886 (    ) ph/cm2/s
Energy fluence (15-150 keV)             : 0 ( 0  0 ) ergs/cm2
Time-resolved spectra
Distribution
T90 vs. Hardness ratio plot
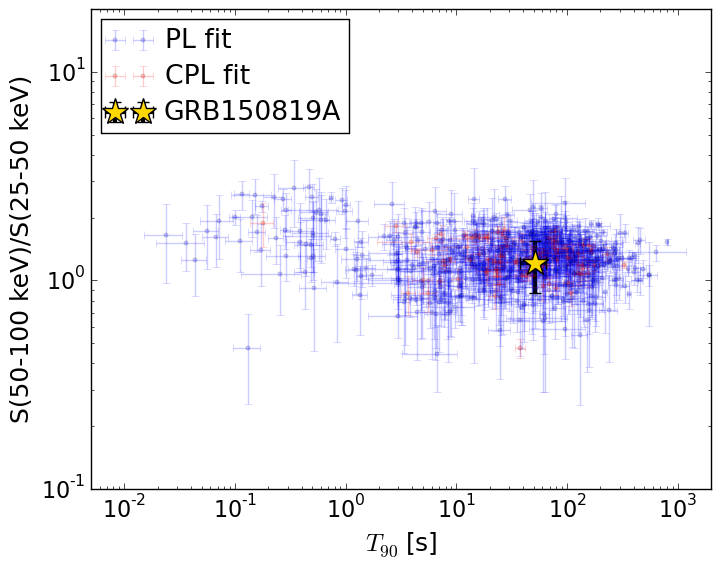
T90                                   = 51.664 sec.
Hardness ratio (energy fluence ratio) = 1.20614545661
S(15-50 keV) vs. S(50-150 keV) plot
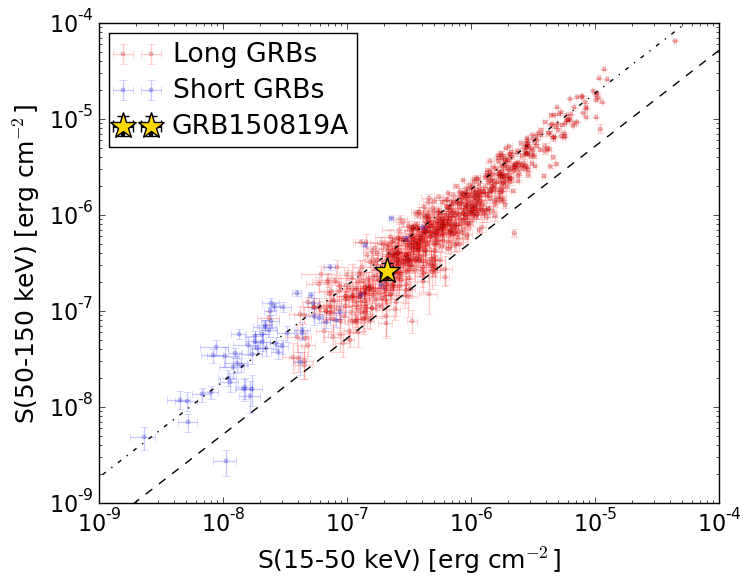
S(15-50 keV)  = 2.0936531e-07
S(50-150 keV) = 2.606085e-07
The dash-dotted line and the dashed line traces the fluences calculated from the Band function with Epeak = 15 and 150 keV, respectively. Both lines assume a canonical values of alpha = -1 and beta = -2.5.
Mask shadow pattern
IMX = 4.177627969290901E-01, IMY = 3.918811376565548E-02
Spacecraft aspect plot
Bright source in the pre-burst/pre-slew/post-slew images
Pre-burst image of 15-350 keV band
Time interval of the image:
-239.000000 14.008000

# RAcent  DECcent POSerr Theta    Phi  PeakCts   SNR AngSep     Name
#  [deg]    [deg]    ['] [deg]  [deg]                   [']
326.0368  38.2599   10.6  51.4  155.9  -1.1193  -1.1    7.4	Cyg X-2
 48.7411 -17.6242    3.3  49.7    9.5   1.8864   3.5 ------	UNKNOWN
316.9616  69.7563    3.1  57.6 -165.4   3.9815   3.7 ------	UNKNOWN
 53.7399  53.1691    0.6  32.6 -112.6   7.0350  19.9 ------	UNKNOWN
 76.2402  -2.9214    3.0  56.3  -28.3   4.1094   3.9 ------	UNKNOWN
 72.2319  49.9186    4.7  41.1  -98.6   2.6501   2.5 ------	UNKNOWN
Pre-slew background subtracted image of 15-350 keV band
Time interval of the image:
14.008000 73.100590

# RAcent  DECcent POSerr Theta    Phi  PeakCts   SNR AngSep     Name
#  [deg]    [deg]    ['] [deg]  [deg]                   [']
326.1527  38.3562   17.0  51.3  156.0   0.2642   0.7    2.3	Cyg X-2
 42.3212   9.7902    1.4  22.8   -5.4   0.7770   8.2 ------	UNKNOWN
 30.2037  50.5087    2.0  23.3 -137.5   0.5156   5.8 ------	UNKNOWN
 26.8492  62.2195    2.4  34.9 -142.8   0.5504   4.8 ------	UNKNOWN
 54.0461  59.8173    2.3  37.4 -120.6   0.8386   5.1 ------	UNKNOWN
Post-slew image of 15-350 keV band
Time interval of the image:
121.900600 963.099900

# RAcent  DECcent POSerr Theta    Phi  PeakCts   SNR AngSep     Name
#  [deg]    [deg]    ['] [deg]  [deg]                   [']
 17.5804 -30.2479    4.6  46.6   45.9   5.8396   2.5 ------	UNKNOWN
 23.2911  55.3310    1.9  48.0 -178.5   7.2101   6.3 ------	UNKNOWN
 64.1406  -3.9208    2.2  25.7  -42.8   2.7021   5.3 ------	UNKNOWN
 53.7682  53.1567    0.6  44.4 -154.2  19.6758  20.0 ------	UNKNOWN
 64.6762  34.9739    3.2  32.4 -128.5   2.5593   3.7 ------	UNKNOWN
 73.9061  59.5407    3.7  55.1 -145.1  11.6362   3.6 ------	UNKNOWN
 74.0506  59.6794    5.1  55.3 -145.2   9.2359   3.0 ------	UNKNOWN
 85.6659  -2.6128    2.6  44.9  -60.2   9.9703   4.4 ------	UNKNOWN