Analysis Summary
Notes:
- 1) No attempt has been made to eliminate the non-significant decimal places.
- 2) This batgrbproduct analysis is done using the HEASARC data.
- 3) This batgrbproduct analysis is using the flight position for the mask-weighting calculation.
======================================================================
                  BAT GRB EVENT DATA PROCESSING REPORT
    Process Script Ver: batgrbproduct v2.46
    Process Start Time: Thu Dec 17 11:16:10 EST 2015
             Host Name: bat1
   Current Working Dir: /local/data/bat1/alien/Swift_3rdBATcatalog/event/batevent_reproc/trigger652847
======================================================================

  Trigger: 00652847      Segment: 000

  BAT Trigger Time: 461843056   [s; MET]
      Trigger Stop: 461843208   [s; MET]
               UTC: 2015-08-21T09:44:00.976460    [includes UTCF correction]
       Where From?: TDRSS position message

  BAT
    RA: 341.905812314366   Dec: -57.8753482469684  [deg; J2000]

     Catalogged Source?: NO
     Point Source?:      YES
     GRB Indicated?:     YES    [ by BAT flight software ]
     Image S/N Ratio:    7.18
     Image Trigger?:     YES
     Rate S/N Ratio:     0  [ if not an image trigger ]
     Image S/N Ratio:    7.18

  Analysis Position:   [ source = BAT ]
    RA: 341.905812314366   Dec: -57.8753482469684  [deg; J2000]

  Refined Position:   [ source = BAT pre-slew burst ]
    RA: 341.916214293096   Dec: -57.8723837737101  [deg; J2000]
        { 22h 47m 39.9s , -57d 52' 20.6" }
         +/- 2.02173716780448 [arcmin] (estimated 90% radius based on SNR)
         +/- 0.967992881613575 [arcmin] (formal 1-sigma fit error)
    SNR: 11.1267624269188

  Angular difference between the analysis and refined position is 0.376554 arcmin

  Partial Coding Fraction: 0.02124023    [ including projection effects ]

  Duration
     T90: 168.944000005722 +/- 102.337127308651
        Measured from: 27.5120000243187
                   to: 196.456000030041     [s; relative to TRIGTIME]
     T50: 48.5760000348091 +/- 13.8892718285374
        Measured from: 39.8799999952316
                   to: 88.4560000300407     [s; relative to TRIGTIME]

======================================================================


====== Table of the duration information =============================

        Value   tstart    tstop
T100  309.648   21.096  330.744
T90   168.944   27.512  196.456
T50    48.576   39.880   88.456
Peak    1.000   34.268   35.268


====== Spectral Analysis Summary =====================================

Model      : spectral model: simple power-law (PL) and cutoff power-law (CPL)
Ph_index   : photon index: E^{Ph_index}
Ph_90err   : 90% error of the photon index
Epeak      : Epeak in keV
Epeak_90err: 90% error of Epeak
Norm       : normalization at 50 keV in both the PL model and CPL model
Nomr_90err : 90% error of the normalization
chi2       : Chi-Squared
dof        : degree of freedo

=== Time-averaged spectral analysis ===
(Best model with acceptable fit: PL)

Model Ph_index Ph_90err_low Ph_90err_hi  Epeak  Epeak_90err_low  Epeak_90err_hi  Norm       Nomr_90err_low    Norm_90err_hi    chi2    dof
PL      -1.931    -0.359      0.331       -           -               -         5.86e-04     -1.44e-04          1.41e-04      62.890   57
CPL      0.607    -1.864      2.978       42.105      -8.933        14.180      1.69e-02     -1.69e-02          7.82e-01      56.830   56


=== 1-s peak spectral analysis ===
(Best model with acceptable fit: N/A)

Model Ph_index Ph_90err_low Ph_90err_hi  Epeak  Epeak_90err_low  Epeak_90err_hi  Norm       Nomr_90err_low    Norm_90err_hi    chi2    dof
PL      N/A         N/A       N/A          -           -               -           N/A           N/A               N/A         N/A        N/A
CPL     N/A         N/A       N/A          N/A         N/A           N/A           N/A           N/A               N/A         N/A        N/A


=== Fluence/Peak Flux Summary ===

              Model    Band1     Band2     Band3     Band4     Band5     Total
                       15-25     25-50    50-100    100-350    15-150    15-350    keV
Fluence         PL   1.76e-07  2.49e-07  2.61e-07  5.04e-07  8.44e-07  1.19e-06   erg/cm2
      90%_error_low -4.78e-08 -5.11e-08 -8.17e-08 -2.52e-07 -1.98e-07 -3.64e-07   erg/cm2
      90%_error_hi   5.01e-08  5.10e-08  8.55e-08  3.80e-07  2.05e-07  4.61e-07   erg/cm2
Peak flux       PL     N/A      N/A      N/A      N/A      N/A      N/A     ph/cm2/s
Image
Pre-slew 15.0-350.0 keV image (Event data with DETECTION mask)
#   RAcent    DECcent   POSerr    Theta     Phi              Peak Cts       SNR   Name
  341.9162   -57.8724   0.0172    53.9158   147.9355        28.9170864     11.127 TRIG_00652847

Foreground time interval of the image:
 21.096 161.301 (delta_t = 140.205 [sec])
Background time interval of the image:
-239.000  21.096 (delta_t = 260.096 [sec])
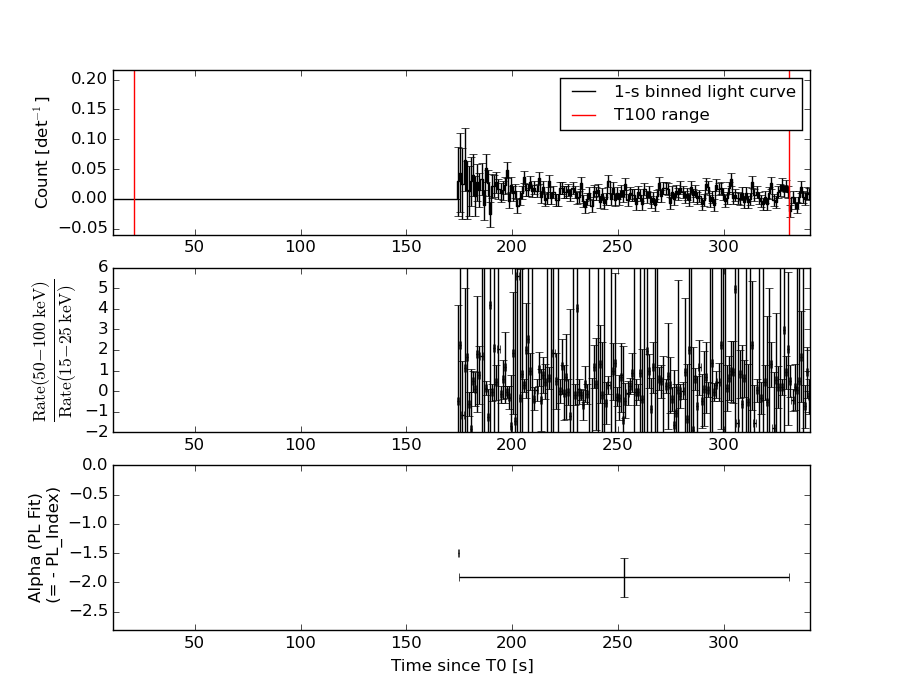
Light Curves
Note: The mask-weighted lightcurves have units of either count/det or counts/sec/det, where a det is 0.4 x 0.4 = 0.16 sq cm.
Full-time range; 1 s binning
Other quick-look light curves:
- 64 ms binning (zoomed)
- 16 ms binning (zoomed)
- 8 ms binning (zoomed)
- 2 ms binning (zoomed)
- SN=5 or 10 s binning (full-time range)
- Raw light curve
Spectra
- 64 ms binning (zoomed)
- 16 ms binning (zoomed)
- 8 ms binning (zoomed)
- 2 ms binning (zoomed)
- SN=5 or 10 s binning (full-time range)
- Raw light curve
Spectra
Notes:
- 1) The fitting includes the systematic errors.
- 2) When the burst includes telescope slew time periods, the fitting uses an average response file made from multiple 5-s response files through out the slew time plus single time preiod for the non-slew times, and weighted by the total counts in the corresponding time period using addrmf. An average response file is needed becuase a spectral fit using the pre-slew DRM will introduce some errors in both a spectral shape and a normalization if the PHA file contains a lot of the slew/post-slew time interval.
- 3) For fits to more complicated models (e.g. a power-law over a cutoff power-law), the BAT team has decided to require a chi-square improvement of more than 6 for each extra dof.
Time averaged spectrum fit using the average DRM
Power-law model
Time interval is from  174.240 sec. to  330.744 sec.

Spectral model in power-law:
------------------------------------------------------------
Parameters  : value       lower 90%   higher 90%
Photon index: -1.93097     ( -0.35792   0.331814 )
Norm@50keV  : 5.86132E-04    ( -0.000144105   0.000141046 )
------------------------------------------------------------
#Fit statistic : Chi-Squared =          62.89 using 59 PHA bins.
# Reduced chi-squared =          1.103 for     57 degrees of freedom
# Null hypothesis probability =   2.758257e-01

Photon flux (15-150 keV)    in 156.5 sec: 8.52515E-02 ( -0.0175126  0.0175255 ) ph/cm2/s
Energy fluence (15-150 keV)             : 8.43751e-07 ( -1.97763e-07  2.04594e-07 ) ergs/cm2
Cutoff power-law model
Time interval is from  174.240 sec. to  330.744 sec.
Spectral model in the cutoff power-law:
------------------------------------------------------------
Parameters  : value       lower 90%   higher 90%
Photon index: 0.607063     ( -1.89231   2.9492 )
Epeak [keV] : 42.1053      ( -8.95597 14.1571 )
Norm@50keV  : 1.68954E-02    ( -0.0179153   0.780932 )
------------------------------------------------------------
#Fit statistic : Chi-Squared =          56.83 using 59 PHA bins.
# Reduced chi-squared =          1.015 for     56 degrees of freedom
# Null hypothesis probability =   4.437534e-01

Photon flux (15-150 keV)    in 156.5 sec: 7.95172E-02 ( -0.0177062  0.0177957 ) ph/cm2/s
Energy fluence (15-150 keV)             : 7.13025e-07 ( -1.67375e-07  1.98638e-07 ) ergs/cm2
1-s peak spectrum fit
1-s peak spectrum unavailable, likely because there are no event data in the 1-s peak range.
Time-resolved spectra
Distribution
T90 vs. Hardness ratio plot
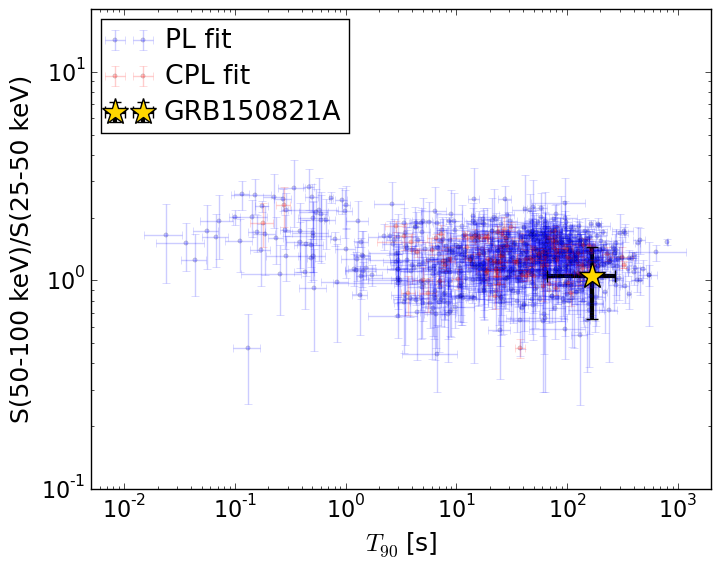
T90                                   = 168.944 sec.
Hardness ratio (energy fluence ratio) = 1.04869755298
S(15-50 keV) vs. S(50-150 keV) plot
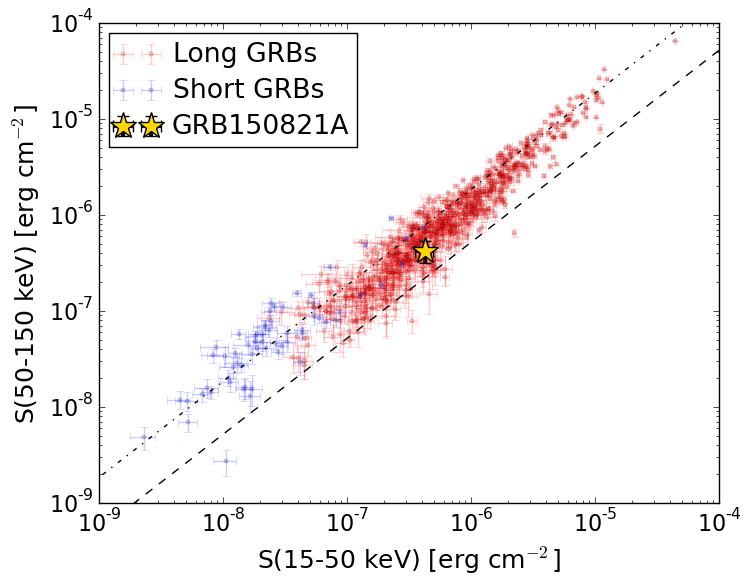
S(15-50 keV)  = 4.24553e-07
S(50-150 keV) = 4.191919e-07
The dash-dotted line and the dashed line traces the fluences calculated from the Band function with Epeak = 15 and 150 keV, respectively. Both lines assume a canonical values of alpha = -1 and beta = -2.5.
Mask shadow pattern (with DETECTION mask)
IMX = 0, IMY = 0
Spacecraft aspect plot
Bright source in the event data image
Event data image of 15-350 keV band
Time interval of the image:
21.096000 161.300590

# RAcent  DECcent POSerr Theta    Phi  PeakCts   SNR AngSep     Name
#  [deg]    [deg]    ['] [deg]  [deg]                   [']
170.4440 -60.7362   25.5  49.2 -131.2  -0.3134  -0.5    7.8	Cen X-3
186.7031 -62.7299    1.9  41.2 -131.6  -1.8543  -6.2    2.7	GX 301-2
244.8753 -15.6334    6.8  28.9   -5.9   0.3267   1.7    6.0	Sco X-1
256.0084 -37.8082    6.2   6.6   35.3   0.3091   1.9    2.4	4U 1700-377
256.6458 -36.5018    5.9   8.0   34.8   0.3334   2.0   11.2	GX 349+2
262.9936 -24.7777  281.2  20.9   37.2   0.0077   0.0    2.1	GX 1+4
264.8795 -44.2624    0.0   9.0  106.3   0.1671   0.9   12.7	4U 1735-44
268.3628  -1.5936    8.7  44.6   32.3   0.5358   1.3    8.5	SW J1753.5-0127
270.4447 -25.0513   63.7  23.9   53.2   0.0400   0.2    8.9	GX 5-1
270.3172 -25.7591    5.9  23.2   54.0  -0.4208  -2.0    1.2	GRS 1758-258
274.0826 -14.1529  132.4  35.0   47.9   0.0287   0.1    8.3	GX 17+2
275.9784 -30.4986    6.2  22.9   71.6  -0.4155  -1.9    8.4	H1820-303
284.9511 -25.0459   15.2  32.5   74.6   0.2762   0.8    8.8	HT1900.1-2455
262.9638 -33.6875    6.1  13.1   51.9  -0.3359  -1.9    8.9	GX 354-0
341.9163 -57.8724    1.0  53.9  147.9  28.9060  11.1 ------	UNKNOWN
275.7159 -68.9716    1.9  27.9  171.4   1.2468   6.0 ------	UNKNOWN
 61.2211 -75.1454    2.7  60.8 -174.2   9.3411   4.3 ------	UNKNOWN
236.7988   7.3264    2.5  53.0  -10.3   1.9269   4.7 ------	UNKNOWN
203.6642 -23.6111    2.5  44.4  -70.2   4.0111   4.6 ------	UNKNOWN
Webpage updated on:
Mon Jan 11 18:19:16 EST 2016