Analysis Summary
Notes:
- 1) No attempt has been made to eliminate the non-significant decimal places.
- 2) This batgrbproduct analysis is done using the HEASARC data.
- 3) This batgrbproduct analysis is using the flight position for the mask-weighting calculation.
======================================================================
                  BAT GRB EVENT DATA PROCESSING REPORT
    Process Script Ver: batgrbproduct v2.46
    Process Start Time: Tue Sep 29 19:50:03 EDT 2015
             Host Name: bat1
   Current Working Dir: /local/data/bat1/alien/Swift_3rdBATcatalog/event/batevent_reproc/trigger653978
======================================================================

  Trigger: 00653978      Segment: 000

  BAT Trigger Time: 462752382.336   [s; MET]
      Trigger Stop: 462752383.36   [s; MET]
               UTC: 2015-08-31T22:19:27.264720    [includes UTCF correction]
       Where From?: TDRSS position message

  BAT
    RA: 271.021331292747   Dec: -27.2521426009604  [deg; J2000]

     Catalogged Source?: NO
     Point Source?:      YES
     GRB Indicated?:     YES    [ by BAT flight software ]
     Image S/N Ratio:    8.54
     Image Trigger?:     NO
     Rate S/N Ratio:     16.1864140562386  [ if not an image trigger ]
     Image S/N Ratio:    8.54

  Analysis Position:   [ source = BAT ]
    RA: 271.021331292747   Dec: -27.2521426009604  [deg; J2000]

  Refined Position:   [ source = BAT pre-slew burst ]
    RA: 271.03017980431   Dec: -27.2427473337378  [deg; J2000]
        { 18h 04m 07.2s , -27d 14' 33.9" }
         +/- 1.97131546118086 [arcmin] (estimated 90% radius based on SNR)
         +/- 0.815612591481984 [arcmin] (formal 1-sigma fit error)
    SNR: 11.5355471047656

  Angular difference between the analysis and refined position is 0.735227 arcmin

  Partial Coding Fraction: 0.0703125    [ including projection effects ]

  Duration
     T90: 6.17600005865097 +/- 1.03296077403421
        Measured from: -0.312000036239624
                   to: 5.86400002241135     [s; relative to TRIGTIME]
     T50: 3.19999998807907 +/- 0.64358994665835
        Measured from: 0.407999992370605
                   to: 3.60799998044968     [s; relative to TRIGTIME]


  Fluence
     Peak Flux  (peak 1 second)
        Measured from: -0.148000001907349
                   to: 0.851999998092651     [s; relative to TRIGTIME]
     Total Fluence
        Measured from: -0.584000051021576
                   to: 6.83999997377396     [s; relative to TRIGTIME]

             Band 1     Band 2     Band 3     Band 4
              15-25      25-50     50-100    100-350     keV
 Total     0.590347   0.865227   0.501651   0.168897
           0.079573   0.085273   0.075234   0.063659 [error]
 Peak      0.153124   0.232506   0.203464   0.051326
           0.033079   0.037622   0.033763   0.025535 [error]

     [ fluence units of on-axis counts / fully illuminated detector ]

======================================================================


====== Table of the duration information =============================

        Value   tstart    tstop
T100    7.424   -0.584    6.840
T90     6.176   -0.312    5.864
T50     3.200    0.408    3.608
Peak    1.000   -0.148    0.852


====== Spectral Analysis Summary =====================================

Model      : spectral model: simple power-law (PL) and cutoff power-law (CPL)
Ph_index   : photon index: E^{Ph_index}
Ph_90err   : 90% error of the photon index
Epeak      : Epeak in keV
Epeak_90err: 90% error of Epeak
Norm       : normalization at 50 keV in both the PL model and CPL model
Nomr_90err : 90% error of the normalization
chi2       : Chi-Squared
dof        : degree of freedo

=== Time-averaged spectral analysis ===
(Best model with acceptable fit: PL)

Model Ph_index Ph_90err_low Ph_90err_hi  Epeak  Epeak_90err_low  Epeak_90err_hi  Norm       Nomr_90err_low    Norm_90err_hi    chi2    dof
PL      -1.898    -0.200      0.191       -           -               -         2.03e-02     -2.60e-03          2.57e-03      65.920   57
CPL     -0.522    -0.982      1.343       50.740      -9.185        18.078      1.08e-01     -1.08e-01          4.54e-01      59.690   56


=== 1-s peak spectral analysis ===
(Best model with acceptable fit: N/A)

Model Ph_index Ph_90err_low Ph_90err_hi  Epeak  Epeak_90err_low  Epeak_90err_hi  Norm       Nomr_90err_low    Norm_90err_hi    chi2    dof
PL      -1.899     -0.281     0.258       -           -               -         4.13e-02     -7.82e-03          7.70e-03      78.440   57
CPL     -0.563     -1.083     1.351       58.724      -8.235        30.800      1.82e-01     -1.82e-01          5.80e-01      73.860   56


=== Fluence/Peak Flux Summary ===

              Model    Band1     Band2     Band3     Band4     Band5     Total
                       15-25     25-50    50-100    100-350    15-150    15-350    keV
Fluence         PL   2.79e-07  4.03e-07  4.33e-07  8.65e-07  1.38e-06  1.98e-06   erg/cm2
      90%_error_low -4.88e-08 -4.79e-08 -7.19e-08 -2.58e-07 -1.75e-07 -3.40e-07   erg/cm2
      90%_error_hi   5.10e-08  4.79e-08  7.16e-08  3.14e-07  1.76e-07  3.78e-07   erg/cm2
Peak flux       PL   2.50e+00  1.99e+00  1.07e+00  8.33e-01  5.93e+00  6.38e+00   ph/cm2/s
      90%_error_low -6.30e-01 -3.60e-01 -2.46e-01 -3.16e-01 -1.08e+00 -1.13e+00   ph/cm2/s
      90%_error_hi   6.74e-01  3.58e-01  2.41e-01  3.85e-01  1.09e+00  1.13e+00   ph/cm2/s

Fluence        CPL   2.29e-07  4.67e-07  4.56e-07  1.90e-07  1.29e-06  1.34e-06   erg/cm2
      90%_error_low -5.96e-08 -6.59e-08 -9.08e-08 -1.31e-07 -1.89e-07 -2.29e-07   erg/cm2
      90%_error_hi   6.11e-08  7.00e-08  8.72e-08  3.34e-07  1.91e-07  3.57e-07   erg/cm2
Peak flux      CPL     N/A      N/A      N/A      N/A      N/A      N/A     ph/cm2/s
      90%_error_low -6.30e-01 -3.60e-01 -2.46e-01 -3.16e-01 -1.08e+00 -1.13e+00   ph/cm2/s
      90%_error_hi   6.74e-01  3.58e-01  2.41e-01  3.85e-01  1.09e+00  1.13e+00   ph/cm2/s

======================================================================
Image
Pre-slew 15.0-350.0 keV image (Event data)
#   RAcent    DECcent   POSerr    Theta     Phi              Peak Cts       SNR   Name
  271.0302   -27.2427   0.0166    57.1060    -4.9451         2.0819189     11.536 TRIG_00653978

Foreground time interval of the image:
 -0.584   6.840 (delta_t =   7.424 [sec])
Background time interval of the image:
-47.835  -0.584 (delta_t =  47.251 [sec])
Light Curves
Note: The mask-weighted lightcurves have units of either count/det or counts/sec/det, where a det is 0.4 x 0.4 = 0.16 sq cm.
Full-time range; 1 s binning
Other quick-look light curves:
- 64 ms binning (zoomed)
- 16 ms binning (zoomed)
- 8 ms binning (zoomed)
- 2 ms binning (zoomed)
- SN=5 or 10 s binning (full-time range)
- Raw light curve
Spectra
- 64 ms binning (zoomed)
- 16 ms binning (zoomed)
- 8 ms binning (zoomed)
- 2 ms binning (zoomed)
- SN=5 or 10 s binning (full-time range)
- Raw light curve
Spectra
Notes:
- 1) The fitting includes the systematic errors.
- 2) When the burst includes telescope slew time periods, the fitting uses an average response file made from multiple 5-s response files through out the slew time plus single time preiod for the non-slew times, and weighted by the total counts in the corresponding time period using addrmf. An average response file is needed becuase a spectral fit using the pre-slew DRM will introduce some errors in both a spectral shape and a normalization if the PHA file contains a lot of the slew/post-slew time interval.
- 3) For fits to more complicated models (e.g. a power-law over a cutoff power-law), the BAT team has decided to require a chi-square improvement of more than 6 for each extra dof.
Time averaged spectrum fit using the average DRM
Power-law model
Time interval is from   -0.584 sec. to    6.840 sec.

Spectral model in power-law:
------------------------------------------------------------
Parameters  : value       lower 90%   higher 90%
Photon index: -1.89764     ( -0.19992   0.191063 )
Norm@50keV  : 2.02625E-02    ( -0.00259979   0.00256623 )
------------------------------------------------------------
#Fit statistic : Chi-Squared =          65.92 using 59 PHA bins.
# Reduced chi-squared =          1.156 for     57 degrees of freedom
# Null hypothesis probability =   1.956754e-01

Photon flux (15-150 keV)    in 7.424 sec: 2.90513 ( -0.35417  0.3553 ) ph/cm2/s
Energy fluence (15-150 keV)             : 1.38324e-06 ( -1.74764e-07  1.75803e-07 ) ergs/cm2
Cutoff power-law model
Time interval is from   -0.584 sec. to    6.840 sec.
Spectral model in the cutoff power-law:
------------------------------------------------------------
Parameters  : value       lower 90%   higher 90%
Photon index: -0.5218     ( -0.981817   1.34272 )
Epeak [keV] : 50.7397      ( -9.18517 18.0786 )
Norm@50keV  : 0.107625    ( -0.107631   0.454165 )
------------------------------------------------------------
#Fit statistic : Chi-Squared =          59.69 using 59 PHA bins.
# Reduced chi-squared =          1.066 for     56 degrees of freedom
# Null hypothesis probability =   3.429694e-01

Photon flux (15-150 keV)    in 7.424 sec:  (    ) ph/cm2/s
Energy fluence (15-150 keV)             : 1.29059e-06 ( -1.89206e-07  1.90558e-07 ) ergs/cm2
1-s peak spectrum fit
Power-law model
Time interval is from   -0.148 sec. to    0.852 sec.

Spectral model in power-law:
------------------------------------------------------------
Parameters  : value       lower 90%   higher 90%
Photon index: -1.89867     ( -0.280907   0.257462 )
Norm@50keV  : 4.13085E-02    ( -0.00782553   0.00770174 )
------------------------------------------------------------
#Fit statistic : Chi-Squared =          78.44 using 59 PHA bins.
# Reduced chi-squared =          1.376 for     57 degrees of freedom
# Null hypothesis probability =   3.136775e-02

Photon flux (15-150 keV)    in 1 sec: 5.92506 ( -1.0837  1.08763 ) ph/cm2/s
Energy fluence (15-150 keV)             : 3.79848e-07 ( -7.08113e-08  7.10206e-08 ) ergs/cm2
Cutoff power-law model
Time interval is from   -0.148 sec. to    0.852 sec.
Spectral model in the cutoff power-law:
------------------------------------------------------------
Parameters  : value       lower 90%   higher 90%
Photon index: -0.562886     ( -1.08261   1.3516 )
Epeak [keV] : 58.7241      ( -8.23741 30.7974 )
Norm@50keV  : 0.182200    ( -0.182159   0.580011 )
------------------------------------------------------------
#Fit statistic : Chi-Squared =          73.86 using 59 PHA bins.
# Reduced chi-squared =          1.319 for     56 degrees of freedom
# Null hypothesis probability =   5.516034e-02

Photon flux (15-150 keV)    in 1 sec:  (    ) ph/cm2/s
Energy fluence (15-150 keV)             : 3.8376e-07 ( -7.14902e-08  7.18151e-08 ) ergs/cm2
Time-resolved spectra
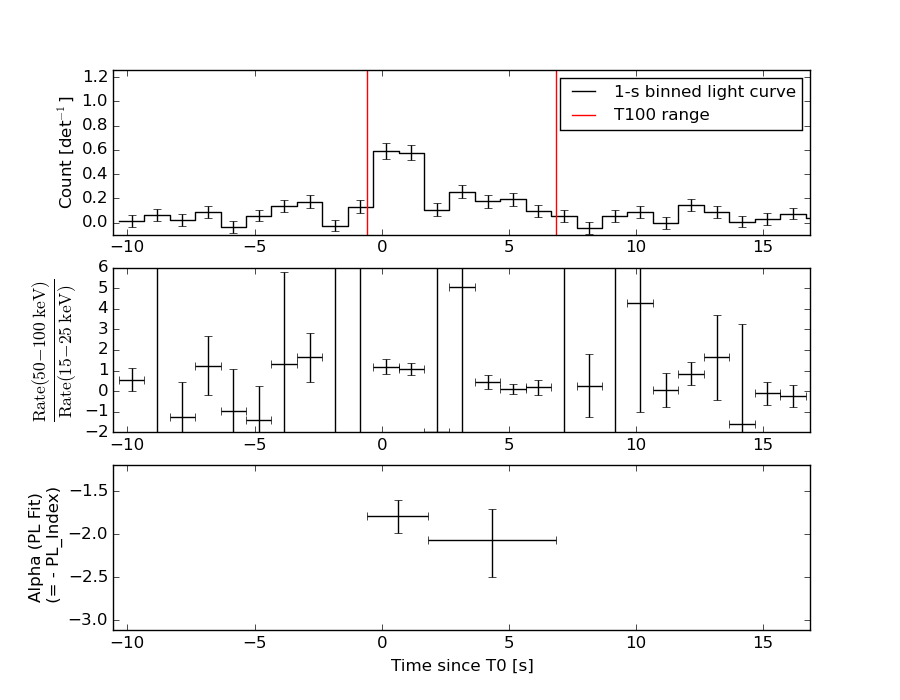
Distribution
T90 vs. Hardness ratio plot
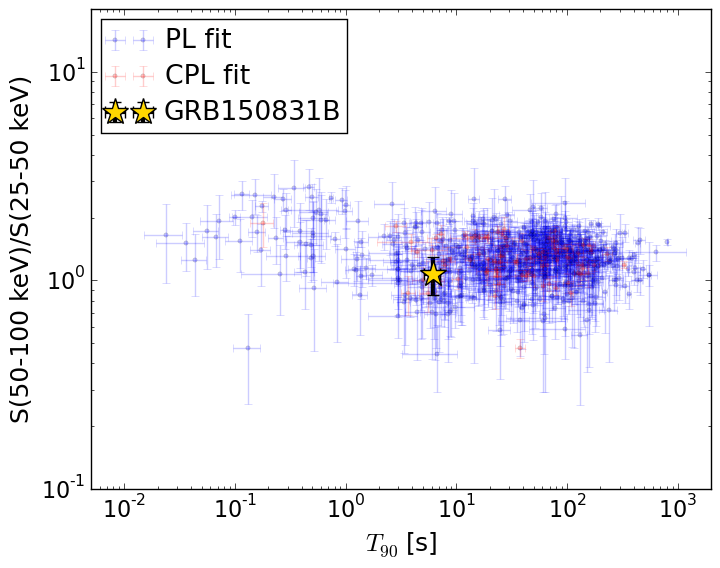
T90                                   = 6.176 sec.
Hardness ratio (energy fluence ratio) = 1.07361866565
S(15-50 keV) vs. S(50-150 keV) plot
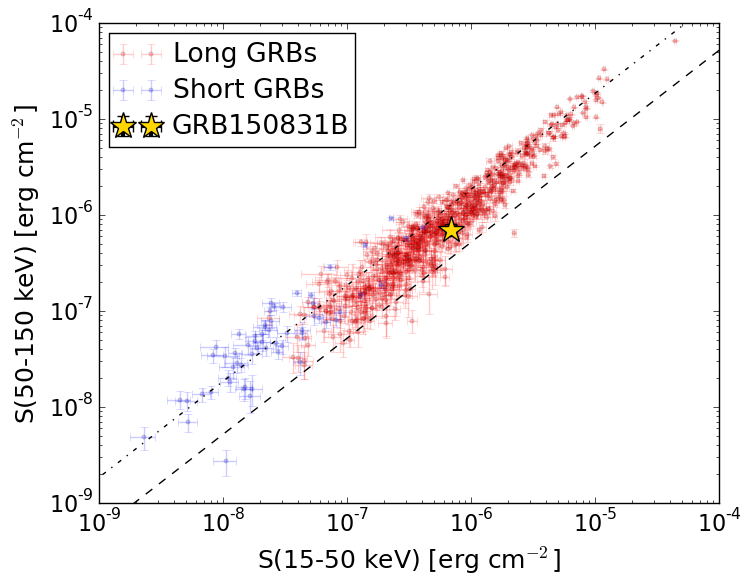
S(15-50 keV)  = 6.825543e-07
S(50-150 keV) = 7.006774e-07
The dash-dotted line and the dashed line traces the fluences calculated from the Band function with Epeak = 15 and 150 keV, respectively. Both lines assume a canonical values of alpha = -1 and beta = -2.5.
Mask shadow pattern
IMX = 1.540364286128175E+00, IMY = 1.332772111267381E-01
Spacecraft aspect plot
Bright source in the pre-burst/pre-slew/post-slew images
Pre-burst image of 15-350 keV band
Time interval of the image:
-47.835400 -0.584000

# RAcent  DECcent POSerr Theta    Phi  PeakCts   SNR AngSep     Name
#  [deg]    [deg]    ['] [deg]  [deg]                   [']
256.1105 -37.7977    5.8  56.6  -24.5  -0.7120  -2.0    6.5	4U 1700-377
256.3177 -36.4997    7.6  57.5  -23.4   0.6150   1.5    7.3	GX 349+2
264.8443 -44.3082  204.9  47.4  -23.9  -0.0085  -0.1    9.6	4U 1735-44
275.8213 -30.3519    6.0  52.1   -3.2   0.3768   1.9    5.4	H1820-303
284.9670 -24.9882    6.4  51.6    9.2  -0.4432  -1.8    5.5	HT1900.1-2455
263.0044 -33.8254    6.5  56.2  -16.3   0.5669   1.8    0.9	GX 354-0
 52.4709 -30.9631    3.6  54.1  177.1   0.9000   3.2 ------	UNKNOWN
  1.6704 -85.4068    2.0  27.9  -98.5   0.5851   5.7 ------	UNKNOWN
240.2067 -60.4971    2.8  46.8  -53.8   1.4451   4.2 ------	UNKNOWN
170.0745 -81.1670    3.1  40.9  -93.3   1.2122   3.8 ------	UNKNOWN
Pre-slew background subtracted image of 15-350 keV band
Time interval of the image:
-0.584000 6.840000

# RAcent  DECcent POSerr Theta    Phi  PeakCts   SNR AngSep     Name
#  [deg]    [deg]    ['] [deg]  [deg]                   [']
255.8610 -37.9796   19.8  56.6  -24.9   0.0917   0.6   10.1	4U 1700-377
256.5524 -36.3565  515.6  57.5  -23.1  -0.0037  -0.0    6.9	GX 349+2
264.8576 -44.2962    8.4  47.4  -23.8   0.0921   1.4   10.5	4U 1735-44
275.8495 -30.4367    4.5  52.0   -3.2   0.2393   2.5    5.7	H1820-303
285.0960 -24.8491    9.5  51.6    9.4  -0.1335  -1.2    5.4	HT1900.1-2455
263.0457 -33.8261    9.1  56.1  -16.3  -0.1759  -1.3    2.9	GX 354-0
 31.2184 -21.1189    2.9  51.1  150.3   0.6959   3.9 ------	UNKNOWN
312.5184 -28.3861    2.4  35.8   37.4   0.2839   4.8 ------	UNKNOWN
310.7138 -35.3702    2.4  30.5   28.7   0.2044   4.8 ------	UNKNOWN
271.0302 -27.2428    1.0  57.1   -4.9   2.0830  11.4 ------	UNKNOWN
 83.9144 -48.2427    2.2  56.1 -146.9   0.9459   5.2 ------	UNKNOWN
 91.9547 -61.2679    2.5  49.1 -131.9   0.6483   4.5 ------	UNKNOWN
Post-slew image of 15-350 keV band
Time interval of the image:
837.164600 962.743500

# RAcent  DECcent POSerr Theta    Phi  PeakCts   SNR AngSep     Name
#  [deg]    [deg]    ['] [deg]  [deg]                   [']
 83.6316  22.0154    0.8  42.2  -48.4   4.6965  14.9    0.1	Crab
 53.7467  53.2002    0.7  19.6 -116.6   2.5715  17.3 ------	UNKNOWN
281.3210  80.0797    2.9  57.8 -156.6   2.9106   4.1 ------	UNKNOWN
 95.0270  65.0999    2.3  43.3 -114.9   2.6899   5.0 ------	UNKNOWN