Analysis Summary
Notes:
- 1) No attempt has been made to eliminate the non-significant decimal places.
- 2) This batgrbproduct analysis is done using the HEASARC data.
- 3) This batgrbproduct analysis is using the flight position for the mask-weighting calculation.
======================================================================
BAT GRB EVENT DATA PROCESSING REPORT
Process Script Ver: batgrbproduct v2.46
Process Start Time: Sun Nov 1 01:44:22 EDT 2015
Host Name: bat1
Current Working Dir: /local/data/bat1/alien/Swift_3rdBATcatalog/event/batevent_reproc/trigger655721
======================================================================
Trigger: 00655721 Segment: 000
BAT Trigger Time: 464044720 [s; MET]
Trigger Stop: 464044784 [s; MET]
UTC: 2015-09-15T21:18:24.860420 [includes UTCF correction]
Where From?: TDRSS position message
BAT
RA: 319.730955300173 Dec: -34.8537258550562 [deg; J2000]
Catalogged Source?: NO
Point Source?: YES
GRB Indicated?: YES [ by BAT flight software ]
Image S/N Ratio: 7.23
Image Trigger?: YES
Rate S/N Ratio: 0 [ if not an image trigger ]
Image S/N Ratio: 7.23
Analysis Position: [ source = BAT ]
RA: 319.730955300173 Dec: -34.8537258550562 [deg; J2000]
Refined Position: [ source = BAT pre-slew burst ]
RA: 319.679786129478 Dec: -34.8652489691896 [deg; J2000]
{ 21h 18m 43.1s , -34d 51' 54.9" }
+/- 3.62218481295882 [arcmin] (estimated 90% radius based on SNR)
+/- 2.20575107198738 [arcmin] (formal 1-sigma fit error)
SNR: 4.83714319162991
Angular difference between the analysis and refined position is 2.612382 arcmin
Partial Coding Fraction: 0.5546875 [ including projection effects ]
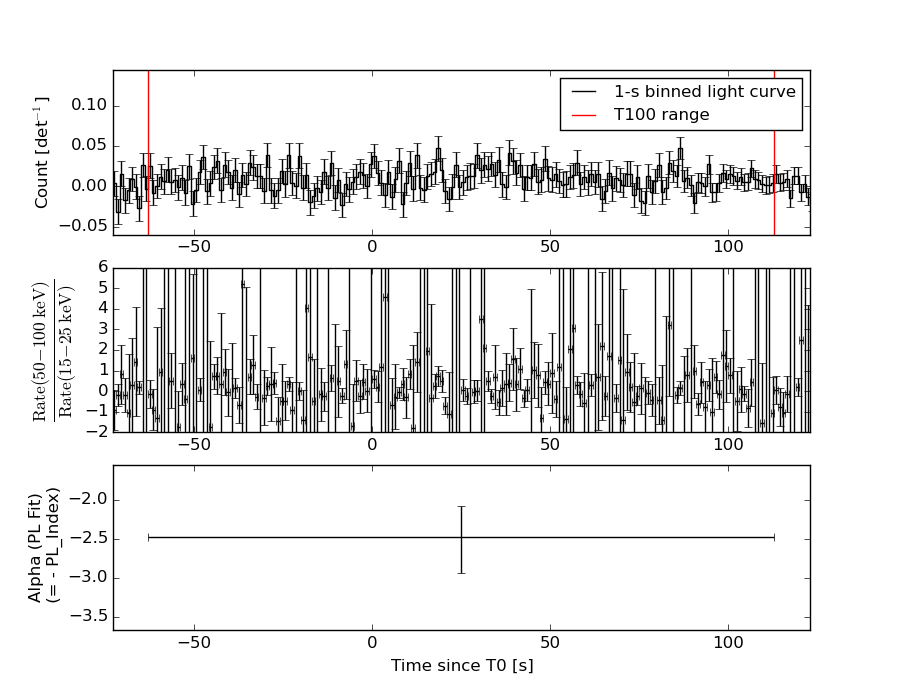
Duration
T90: 160 +/- 57.6888204074238
Measured from: -63
to: 97 [s; relative to TRIGTIME]
T50: 64 +/- 45.254833995939
Measured from: -15
to: 49 [s; relative to TRIGTIME]
Fluence
Peak Flux (peak 1 second)
Measured from: 40.5
to: 41.5 [s; relative to TRIGTIME]
Total Fluence
Measured from: -63
to: 113 [s; relative to TRIGTIME]
Band 1 Band 2 Band 3 Band 4
15-25 25-50 50-100 100-350 keV
Total 0.818489 0.596014 0.183994 0.033346
0.108507 0.106067 0.090961 0.083400 [error]
Peak 0.000853 0.013820 0.003483 -0.000788
0.008674 0.008352 0.007045 0.006573 [error]
[ fluence units of on-axis counts / fully illuminated detector ]
======================================================================
====== Table of the duration information =============================
Value tstart tstop
T100 176.000 -63.000 113.000
T90 160.000 -63.000 97.000
T50 64.000 -15.000 49.000
Peak 1.000 40.500 41.500
====== Spectral Analysis Summary =====================================
Model : spectral model: simple power-law (PL) and cutoff power-law (CPL)
Ph_index : photon index: E^{Ph_index}
Ph_90err : 90% error of the photon index
Epeak : Epeak in keV
Epeak_90err: 90% error of Epeak
Norm : normalization at 50 keV in both the PL model and CPL model
Nomr_90err : 90% error of the normalization
chi2 : Chi-Squared
dof : degree of freedo
=== Time-averaged spectral analysis ===
(Best model with acceptable fit: PL)
Model Ph_index Ph_90err_low Ph_90err_hi Epeak Epeak_90err_low Epeak_90err_hi Norm Nomr_90err_low Norm_90err_hi chi2 dof
PL -2.474 -0.460 0.393 - - - 4.22e-04 -1.37e-04 1.36e-04 53.270 57
CPL -1.921 N/A N/A 4.860 N/A N/A 9.68e-04 N/A N/A 53.520 56
=== 1-s peak spectral analysis ===
(Best model with acceptable fit: N/A)
Model Ph_index Ph_90err_low Ph_90err_hi Epeak Epeak_90err_low Epeak_90err_hi Norm Nomr_90err_low Norm_90err_hi chi2 dof
PL -2.218 2.218 2.218 - - - 1.08e-03 -1.08e-03 1.55e-03 56.100 57
CPL 0.112 N/A N/A 43.299 N/A N/A 1.97e-02 N/A N/A 55.510 56
=== Fluence/Peak Flux Summary ===
Model Band1 Band2 Band3 Band4 Band5 Total
15-25 25-50 50-100 100-350 15-150 15-350 keV
Fluence PL 2.39e-07 2.44e-07 1.76e-07 2.03e-07 7.38e-07 8.62e-07 erg/cm2
90%_error_low -5.27e-08 -5.44e-08 -7.22e-08 -1.23e-07 -1.73e-07 -2.46e-07 erg/cm2
90%_error_hi 5.30e-08 5.18e-08 8.33e-08 2.20e-07 1.86e-07 3.21e-07 erg/cm2
Peak flux PL 8.90e-02 5.86e-02 2.56e-02 1.53e-02 1.80e-01 1.89e-01 ph/cm2/s
90%_error_low -8.90e-02 -5.86e-02 -2.56e-02 -1.53e-02 -1.80e-01 -1.89e-01 ph/cm2/s
90%_error_hi 1.23e-01 6.62e-02 4.97e-02 1.07e-01 1.99e-01 2.11e-01 ph/cm2/s
Fluence CPL 2.38e-07 2.34e-07 1.68e-07 2.32e-07 7.19e-07 8.71e-07 erg/cm2
90%_error_low -5.77e-08 -1.08e-07 -1.17e-07 -1.98e-07 -3.20e-07 -4.51e-07 erg/cm2
90%_error_hi 5.44e-08 6.23e-08 9.34e-08 2.60e-07 2.14e-07 3.88e-07 erg/cm2
Peak flux CPL N/A N/A N/A N/A N/A N/A ph/cm2/s
90%_error_low -8.90e-02 -5.86e-02 -2.56e-02 -1.53e-02 -1.80e-01 -1.89e-01 ph/cm2/s
90%_error_hi 1.23e-01 6.62e-02 4.97e-02 1.07e-01 1.99e-01 2.11e-01 ph/cm2/s
======================================================================
Image
Pre-slew 15.0-350.0 keV image (Event data)
#   RAcent    DECcent   POSerr    Theta     Phi              Peak Cts       SNR   Name
  319.6798   -34.8652   0.0396    24.5786   121.4265         1.1257401      4.837 TRIG_00655721

Foreground time interval of the image:
-63.000  72.301 (delta_t = 135.301 [sec])
Background time interval of the image:
-239.000 -63.000 (delta_t = 176.000 [sec])
Light Curves
Note: The mask-weighted lightcurves have units of either count/det or counts/sec/det, where a det is 0.4 x 0.4 = 0.16 sq cm.
Full-time range; 1 s binning
Other quick-look light curves:
- 64 ms binning (zoomed)
- 16 ms binning (zoomed)
- 8 ms binning (zoomed)
- 2 ms binning (zoomed)
- SN=5 or 10 s binning (full-time range)
- Raw light curve
Spectra
- 64 ms binning (zoomed)
- 16 ms binning (zoomed)
- 8 ms binning (zoomed)
- 2 ms binning (zoomed)
- SN=5 or 10 s binning (full-time range)
- Raw light curve
Spectra
Notes:
- 1) The fitting includes the systematic errors.
- 2) When the burst includes telescope slew time periods, the fitting uses an average response file made from multiple 5-s response files through out the slew time plus single time preiod for the non-slew times, and weighted by the total counts in the corresponding time period using addrmf. An average response file is needed becuase a spectral fit using the pre-slew DRM will introduce some errors in both a spectral shape and a normalization if the PHA file contains a lot of the slew/post-slew time interval.
- 3) For fits to more complicated models (e.g. a power-law over a cutoff power-law), the BAT team has decided to require a chi-square improvement of more than 6 for each extra dof.
Time averaged spectrum fit using the average DRM
Power-law model
Time interval is from  -63.000 sec. to  113.000 sec.

Spectral model in power-law:
------------------------------------------------------------
Parameters  : value       lower 90%   higher 90%
Photon index: -2.47391     ( -0.460319   0.393281 )
Norm@50keV  : 4.22275E-04    ( -0.000137072   0.000136467 )
------------------------------------------------------------
#Fit statistic : Chi-Squared =          53.27 using 59 PHA bins.
# Reduced chi-squared =         0.9346 for     57 degrees of freedom
# Null hypothesis probability =   6.156998e-01

Photon flux (15-150 keV)    in 176 sec: 8.16593E-02 ( -0.0148113  0.0148151 ) ph/cm2/s
Energy fluence (15-150 keV)             : 7.38265e-07 ( -1.73273e-07  1.86013e-07 ) ergs/cm2
Cutoff power-law model
Time interval is from  -63.000 sec. to  113.000 sec.
Spectral model in the cutoff power-law:
------------------------------------------------------------
Parameters  : value       lower 90%   higher 90%
Photon index: -1.92115     (       )
Epeak [keV] : 4.86026      (   )
Norm@50keV  : 9.68270E-04    (     )
------------------------------------------------------------
#Fit statistic : Chi-Squared =          53.52 using 59 PHA bins.
# Reduced chi-squared =         0.9556 for     56 degrees of freedom
# Null hypothesis probability =   5.694957e-01

Photon flux (15-150 keV)    in 176 sec: 7.99522E-02 ( -0.0142646  0.0150586 ) ph/cm2/s
Energy fluence (15-150 keV)             : 7.18626e-07 ( -3.20278e-07  2.14333e-07 ) ergs/cm2
1-s peak spectrum fit
Power-law model
Time interval is from   40.500 sec. to   41.500 sec.

Spectral model in power-law:
------------------------------------------------------------
Parameters  : value       lower 90%   higher 90%
Photon index: -2.21818     ( 2.21558   2.21558 )
Norm@50keV  : 1.07750E-03    ( -0.00107796   0.00154959 )
------------------------------------------------------------
#Fit statistic : Chi-Squared =          56.10 using 59 PHA bins.
# Reduced chi-squared =         0.9842 for     57 degrees of freedom
# Null hypothesis probability =   5.089292e-01

Photon flux (15-150 keV)    in 1 sec: 0.180018 ( -0.180018  0.19877 ) ph/cm2/s
Energy fluence (15-150 keV)             : 1.01191e-08 ( 1  1.43947e-08 ) ergs/cm2
Cutoff power-law model
Time interval is from   40.500 sec. to   41.500 sec.
Spectral model in the cutoff power-law:
------------------------------------------------------------
Parameters  : value       lower 90%   higher 90%
Photon index: 1.58651     (       )
Epeak [keV] : 45.3051      (   )
Norm@50keV  : 0.105095    (     )
------------------------------------------------------------
#Fit statistic : Chi-Squared =          55.42 using 59 PHA bins.
# Reduced chi-squared =         0.9897 for     56 degrees of freedom
# Null hypothesis probability =   4.966629e-01

Photon flux (15-150 keV)    in 1 sec:  (    ) ph/cm2/s
Energy fluence (15-150 keV)             : 1.03822e-08 ( -1.01308e-08  1.31965e-08 ) ergs/cm2
Time-resolved spectra
Distribution
T90 vs. Hardness ratio plot
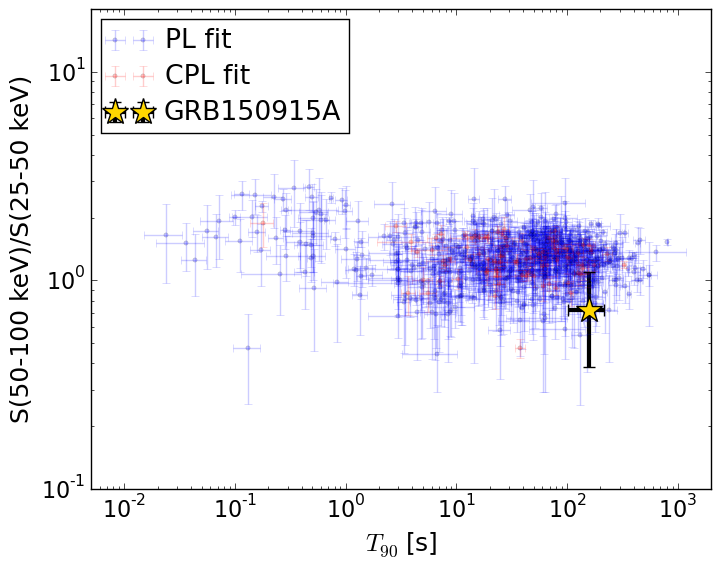
T90                                   = 160.0 sec.
Hardness ratio (energy fluence ratio) = 0.720045241608
S(15-50 keV) vs. S(50-150 keV) plot
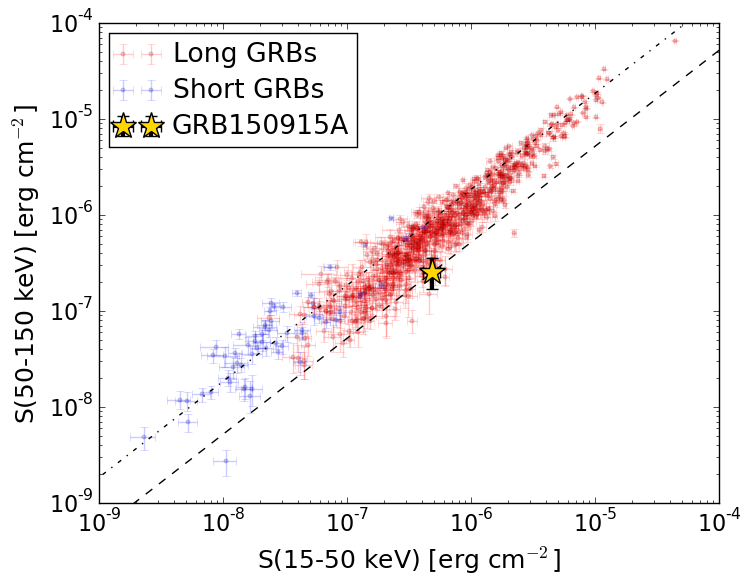
S(15-50 keV)  = 4.832909e-07
S(50-150 keV) = 2.5497251e-07
The dash-dotted line and the dashed line traces the fluences calculated from the Band function with Epeak = 15 and 150 keV, respectively. Both lines assume a canonical values of alpha = -1 and beta = -2.5.
Mask shadow pattern
IMX = -2.384817959365511E-01, IMY = -3.902897601720814E-01
Spacecraft aspect plot
Bright source in the pre-burst/pre-slew/post-slew images
Pre-burst image of 15-350 keV band
Time interval of the image:
-239.000000 -63.000000

# RAcent  DECcent POSerr Theta    Phi  PeakCts   SNR AngSep     Name
#  [deg]    [deg]    ['] [deg]  [deg]                   [']
244.9595 -15.6451    1.0  44.2  -56.8   7.6467  11.7    1.2	Sco X-1
255.9126 -37.7211    4.6  27.7  -87.7   0.6553   2.5    8.2	4U 1700-377
256.2820 -36.4144    9.5  27.5  -84.8   0.3109   1.2    7.4	GX 349+2
263.0035 -24.8059    4.5  25.0  -55.8   0.5696   2.6    3.6	GX 1+4
264.5365 -44.3998    3.7  22.2 -105.7   0.6675   3.1    9.3	4U 1735-44
268.3690  -1.4535    7.8  38.0  -16.1   0.3537   1.5    0.1	SW J1753.5-0127
270.2673 -25.0972    1.7  19.1  -47.8   1.2488   6.6    1.4	GX 5-1
270.4033 -25.7463    8.9  18.6  -49.3   0.2464   1.3    5.5	GRS 1758-258
273.9094 -14.1497    5.8  24.4  -19.8   0.3600   2.0    8.8	GX 17+2
275.8080 -30.3263    5.7  12.4  -57.4   0.3790   2.0    6.5	H1820-303
284.9138 -25.0587    6.4   9.7   -7.2  -0.3196  -1.8   10.6	HT1900.1-2455
288.7808  10.9479    1.4  44.7   18.9   3.1683   8.2    1.0	GRS 1915+105
263.0357 -33.7383    3.2  22.2  -77.1   0.7413   3.6    6.2	GX 354-0
279.4192  19.1567    2.5  53.8    8.1   3.3723   4.7 ------	UNKNOWN
  7.8115 -70.8961    3.1  54.4  177.2   3.0218   3.7 ------	UNKNOWN
355.1735 -84.0264    2.8  53.9 -166.4   2.3590   4.1 ------	UNKNOWN
230.0509 -86.2935    2.5  54.4 -155.7   3.0100   4.7 ------	UNKNOWN
251.7490 -46.4958    2.7  31.4 -105.0   1.2135   4.3 ------	UNKNOWN
238.7231 -39.1850    5.1  40.9  -92.5   1.8103   2.3 ------	UNKNOWN
Pre-slew background subtracted image of 15-350 keV band
Time interval of the image:
-63.000000 72.300600

# RAcent  DECcent POSerr Theta    Phi  PeakCts   SNR AngSep     Name
#  [deg]    [deg]    ['] [deg]  [deg]                   [']
244.8287 -15.6798    5.8  44.3  -56.9  -1.2883  -2.0    9.0	Sco X-1
256.1766 -37.9435    4.0  27.5  -88.2   0.6905   2.9   10.8	4U 1700-377
256.6226 -36.5528    0.0  27.2  -85.1   0.3206   1.3   11.9	GX 349+2
263.0676 -24.8791   27.3  24.9  -55.8  -0.0907  -0.4    8.6	GX 1+4
264.5818 -44.3162    7.4  22.2 -105.6  -0.3238  -1.6   10.6	4U 1735-44
268.2555  -1.5130   19.8  38.0  -16.3   0.1424   0.6    7.7	SW J1753.5-0127
270.2080 -25.1456    4.4  19.1  -48.0  -0.4825  -2.6    5.7	GX 5-1
270.1678 -25.8563    5.1  18.8  -50.0   0.4171   2.3   10.0	GRS 1758-258
274.1111 -13.8540    0.0  24.5  -19.1   0.0803   0.4   12.5	GX 17+2
275.9524 -30.3781  143.8  12.2  -57.4   0.0140   0.1    1.6	H1820-303
285.1558 -24.9537   10.7   9.7   -5.7  -0.1820  -1.1    6.8	HT1900.1-2455
288.9587  10.8572   20.0  44.6   19.1  -0.2141  -0.6   10.8	GRS 1915+105
263.0934 -33.6849    4.0  22.2  -77.0  -0.6006  -2.9   10.4	GX 354-0
Post-slew image of 15-350 keV band
Time interval of the image:
117.900620 854.800600

# RAcent  DECcent POSerr Theta    Phi  PeakCts   SNR AngSep     Name
#  [deg]    [deg]    ['] [deg]  [deg]                   [']
270.3142 -25.1341   16.8  43.4  -52.6   1.2018   0.7    3.7	GX 5-1
270.1995 -25.6446    4.9  43.3  -53.4   4.1792   2.4    8.1	GRS 1758-258
273.9022 -13.9572   27.6  46.1  -36.5   0.4042   0.4    7.7	GX 17+2
276.0727 -30.2598    6.8  36.8  -57.0   1.2445   1.7   10.0	H1820-303
285.0432 -24.9132   18.3  31.5  -42.8   0.3545   0.6    0.6	HT1900.1-2455
288.8140  10.9610    2.3  54.4    0.0   7.6989   5.0    1.3	GRS 1915+105
316.7387 -17.8869    3.3  17.2   28.8   1.5695   3.5 ------	UNKNOWN
303.0519 -18.9774    4.0  21.7   -8.8   1.2558   2.9 ------	UNKNOWN
 46.6961 -66.0949    3.5  57.3 -170.4   7.8857   3.3 ------	UNKNOWN
 49.9097 -70.1026    5.4  57.6 -165.4   5.0552   2.1 ------	UNKNOWN
266.9358 -43.9238    2.3  41.1  -80.8  11.2210   4.9 ------	UNKNOWN
266.3183 -27.4138    2.6  45.8  -57.7  10.2653   4.5 ------	UNKNOWN