Analysis Summary
Notes:
- 1) No attempt has been made to eliminate the non-significant decimal places.
- 2) This batgrbproduct analysis is done using the HEASARC data.
- 3) This batgrbproduct analysis is using the flight position for the mask-weighting calculation.
======================================================================
                  BAT GRB EVENT DATA PROCESSING REPORT
    Process Script Ver: batgrbproduct v2.46
    Process Start Time: Sun Nov  1 01:33:46 EDT 2015
             Host Name: bat1
   Current Working Dir: /local/data/bat1/alien/Swift_3rdBATcatalog/event/batevent_reproc/trigger657286
======================================================================

  Trigger: 00657286      Segment: 000

  BAT Trigger Time: 465404678.144   [s; MET]
      Trigger Stop: 465404679.168   [s; MET]
               UTC: 2015-10-01T15:04:22.932420    [includes UTCF correction]
       Where From?: TDRSS position message

  BAT
    RA: 233.730768614118   Dec: 10.971220915415  [deg; J2000]

     Catalogged Source?: NO
     Point Source?:      YES
     GRB Indicated?:     YES    [ by BAT flight software ]
     Image S/N Ratio:    11
     Image Trigger?:     NO
     Rate S/N Ratio:     22.1359436211787  [ if not an image trigger ]
     Image S/N Ratio:    11

  Analysis Position:   [ source = BAT ]
    RA: 233.730768614118   Dec: 10.971220915415  [deg; J2000]

  Refined Position:   [ source = BAT pre-slew burst ]
    RA: 233.711040658112   Dec: 10.9796414255402  [deg; J2000]
        { 15h 34m 50.6s , +10d 58' 46.7" }
         +/- 1.25127035143776 [arcmin] (estimated 90% radius based on SNR)
         +/- 0.44621347616881 [arcmin] (formal 1-sigma fit error)
    SNR: 22.0823506876487

  Angular difference between the analysis and refined position is 1.267108 arcmin

  Partial Coding Fraction: 1.015625    [ including projection effects ]

  Duration
     T90: 9.82799994945526 +/- 3.19957245018445
        Measured from: -5.43999999761581
                   to: 4.38799995183945     [s; relative to TRIGTIME]
     T50: 4.69599992036819 +/- 0.569097539526206
        Measured from: -2.63999998569489
                   to: 2.05599993467331     [s; relative to TRIGTIME]


  Fluence
     Peak Flux  (peak 1 second)
        Measured from: -0.043999969959259
                   to: 0.956000030040741     [s; relative to TRIGTIME]
     Total Fluence
        Measured from: -6.28799998760223
                   to: 7.77600002288818     [s; relative to TRIGTIME]

             Band 1     Band 2     Band 3     Band 4
              15-25      25-50     50-100    100-350     keV
 Total     0.224423   0.388510   0.334168   0.110697
           0.023915   0.024030   0.021338   0.017762 [error]
 Peak      0.033514   0.064080   0.056468   0.013501
           0.006666   0.007099   0.006307   0.004906 [error]

     [ fluence units of on-axis counts / fully illuminated detector ]

======================================================================


====== Table of the duration information =============================

        Value   tstart    tstop
T100   14.064   -6.288    7.776
T90     9.828   -5.440    4.388
T50     4.696   -2.640    2.056
Peak    1.000   -0.044    0.956


====== Spectral Analysis Summary =====================================

Model      : spectral model: simple power-law (PL) and cutoff power-law (CPL)
Ph_index   : photon index: E^{Ph_index}
Ph_90err   : 90% error of the photon index
Epeak      : Epeak in keV
Epeak_90err: 90% error of Epeak
Norm       : normalization at 50 keV in both the PL model and CPL model
Nomr_90err : 90% error of the normalization
chi2       : Chi-Squared
dof        : degree of freedo

=== Time-averaged spectral analysis ===
(Best model with acceptable fit: PL)

Model Ph_index Ph_90err_low Ph_90err_hi  Epeak  Epeak_90err_low  Epeak_90err_hi  Norm       Nomr_90err_low    Norm_90err_hi    chi2    dof
PL      -1.202    -0.119      0.120       -           -               -         4.87e-03     -3.23e-04          3.23e-04      44.980   57
CPL     -0.964    -0.295      0.495      235.664    -235.664      -235.664      6.30e-03     -1.68e-03          4.27e-03      44.170   56


=== 1-s peak spectral analysis ===
(Best model with acceptable fit: PL)

Model Ph_index Ph_90err_low Ph_90err_hi  Epeak  Epeak_90err_low  Epeak_90err_hi  Norm       Nomr_90err_low    Norm_90err_hi    chi2    dof
PL      -1.197     -0.198     0.201       -           -               -         1.11e-02     -1.30e-03          1.30e-03      54.100   57
CPL     -0.603     -0.705     0.975      126.667     -49.168      -126.667      2.13e-02     -9.62e-03          3.80e-02      52.530   56


=== Fluence/Peak Flux Summary ===

              Model    Band1     Band2     Band3     Band4     Band5     Total
                       15-25     25-50    50-100    100-350    15-150    15-350    keV
Fluence         PL   6.62e-08  1.46e-07  2.54e-07  1.03e-06  6.94e-07  1.49e-06   erg/cm2
      90%_error_low -8.46e-09 -1.13e-08 -2.02e-08 -1.74e-07 -5.09e-08 -1.87e-07   erg/cm2
      90%_error_hi   8.82e-09  1.12e-08  2.01e-08  1.98e-07  5.12e-08  2.08e-07   erg/cm2
Peak flux       PL   3.43e-01  4.14e-01  3.61e-01  5.39e-01  1.31e+00  1.66e+00   ph/cm2/s
      90%_error_low -7.33e-02 -5.66e-02 -4.89e-02 -1.39e-01 -1.56e-01 -2.03e-01   ph/cm2/s
      90%_error_hi   7.83e-02  5.58e-02  4.84e-02  1.67e-01  1.56e-01  2.07e-01   ph/cm2/s

Fluence        CPL   6.28e-08  1.49e-07  2.59e-07  7.28e-07  6.83e-07  1.20e-06   erg/cm2
      90%_error_low -1.04e-08 -1.25e-08 -2.25e-08 -3.33e-07 -5.60e-08 -3.33e-07   erg/cm2
      90%_error_hi   1.06e-08  1.27e-08  2.29e-08  3.50e-07  5.56e-08  3.62e-07   erg/cm2
Peak flux      CPL   3.01e-01  4.32e-01  3.83e-01  2.99e-01  1.28e+00  1.42e+00   ph/cm2/s
      90%_error_low -9.05e-02 -6.33e-02 -5.78e-02 -1.59e-01 -1.63e-01 -2.38e-01   ph/cm2/s
      90%_error_hi   9.37e-02  6.53e-02  5.95e-02  2.96e-01  1.62e-01  3.53e-01   ph/cm2/s

======================================================================
Image
Pre-slew 15.0-350.0 keV image (Event data)
#   RAcent    DECcent   POSerr    Theta     Phi              Peak Cts       SNR   Name
  233.7110    10.9796   0.0087     2.3963   178.5098         1.0837381     22.082 TRIG_00657286

Foreground time interval of the image:
 -6.288   7.776 (delta_t =  14.064 [sec])
Background time interval of the image:
-463.743 -446.933 (delta_t =  16.811 [sec])
-239.144  -6.288 (delta_t = 232.856 [sec])
Light Curves
Note: The mask-weighted lightcurves have units of either count/det or counts/sec/det, where a det is 0.4 x 0.4 = 0.16 sq cm.
Full-time range; 1 s binning
Other quick-look light curves:
- 64 ms binning (zoomed)
- 16 ms binning (zoomed)
- 8 ms binning (zoomed)
- 2 ms binning (zoomed)
- SN=5 or 10 s binning (full-time range)
- Raw light curve
Spectra
- 64 ms binning (zoomed)
- 16 ms binning (zoomed)
- 8 ms binning (zoomed)
- 2 ms binning (zoomed)
- SN=5 or 10 s binning (full-time range)
- Raw light curve
Spectra
Notes:
- 1) The fitting includes the systematic errors.
- 2) When the burst includes telescope slew time periods, the fitting uses an average response file made from multiple 5-s response files through out the slew time plus single time preiod for the non-slew times, and weighted by the total counts in the corresponding time period using addrmf. An average response file is needed becuase a spectral fit using the pre-slew DRM will introduce some errors in both a spectral shape and a normalization if the PHA file contains a lot of the slew/post-slew time interval.
- 3) For fits to more complicated models (e.g. a power-law over a cutoff power-law), the BAT team has decided to require a chi-square improvement of more than 6 for each extra dof.
Time averaged spectrum fit using the average DRM
Power-law model
Time interval is from   -6.288 sec. to    7.776 sec.

Spectral model in power-law:
------------------------------------------------------------
Parameters  : value       lower 90%   higher 90%
Photon index: -1.20191     ( -0.119024   0.120308 )
Norm@50keV  : 4.86950E-03    ( -0.000322747   0.000322725 )
------------------------------------------------------------
#Fit statistic : Chi-Squared =          44.98 using 59 PHA bins.
# Reduced chi-squared =         0.7891 for     57 degrees of freedom
# Null hypothesis probability =   8.754914e-01

Photon flux (15-150 keV)    in 14.06 sec: 0.571737 ( -0.039287  0.039362 ) ph/cm2/s
Energy fluence (15-150 keV)             : 6.94314e-07 ( -5.09075e-08  5.12338e-08 ) ergs/cm2
Cutoff power-law model
Time interval is from   -6.288 sec. to    7.776 sec.
Spectral model in the cutoff power-law:
------------------------------------------------------------
Parameters  : value       lower 90%   higher 90%
Photon index: -0.963716     ( -0.295476   0.495008 )
Epeak [keV] : 235.664      ( -235.665 -235.665 )
Norm@50keV  : 6.30063E-03    ( -0.00167587   0.00427238 )
------------------------------------------------------------
#Fit statistic : Chi-Squared =          44.17 using 59 PHA bins.
# Reduced chi-squared =         0.7888 for     56 degrees of freedom
# Null hypothesis probability =   8.735262e-01

Photon flux (15-150 keV)    in 14.06 sec: 0.564831 ( -0.041404  0.041381 ) ph/cm2/s
Energy fluence (15-150 keV)             : 6.82818e-07 ( -5.59658e-08  5.55539e-08 ) ergs/cm2
1-s peak spectrum fit
Power-law model
Time interval is from   -0.044 sec. to    0.956 sec.

Spectral model in power-law:
------------------------------------------------------------
Parameters  : value       lower 90%   higher 90%
Photon index: -1.19743     ( -0.198223   0.201016 )
Norm@50keV  : 1.11419E-02    ( -0.00129781   0.00129781 )
------------------------------------------------------------
#Fit statistic : Chi-Squared =          54.10 using 59 PHA bins.
# Reduced chi-squared =         0.9491 for     57 degrees of freedom
# Null hypothesis probability =   5.847220e-01

Photon flux (15-150 keV)    in 1 sec: 1.30736 ( -0.15615  0.15646 ) ph/cm2/s
Energy fluence (15-150 keV)             : 1.13133e-07 ( -1.45913e-08  1.47168e-08 ) ergs/cm2
Cutoff power-law model
Time interval is from   -0.044 sec. to    0.956 sec.
Spectral model in the cutoff power-law:
------------------------------------------------------------
Parameters  : value       lower 90%   higher 90%
Photon index: -0.602522     ( -0.704979   0.974903 )
Epeak [keV] : 126.667      ( -49.1677 -126.667 )
Norm@50keV  : 2.13023E-02    ( -0.00962459   0.0380381 )
------------------------------------------------------------
#Fit statistic : Chi-Squared =          52.53 using 59 PHA bins.
# Reduced chi-squared =         0.9380 for     56 degrees of freedom
# Null hypothesis probability =   6.070013e-01

Photon flux (15-150 keV)    in 1 sec: 1.27554 ( -0.16314  0.16234 ) ph/cm2/s
Energy fluence (15-150 keV)             : 1.09109e-07 ( -1.59296e-08  1.58104e-08 ) ergs/cm2
Time-resolved spectra
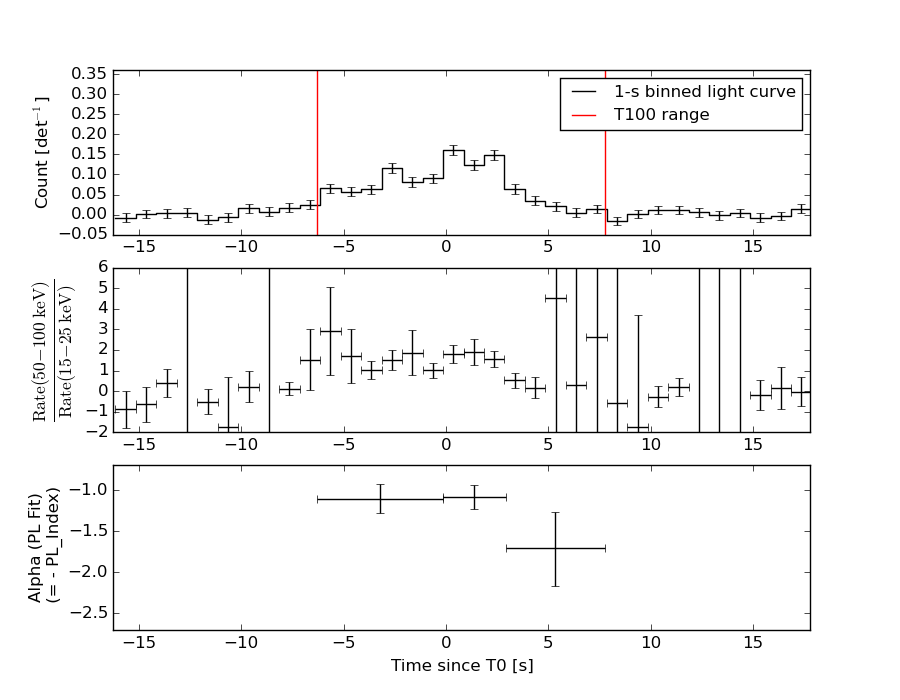
Distribution
T90 vs. Hardness ratio plot
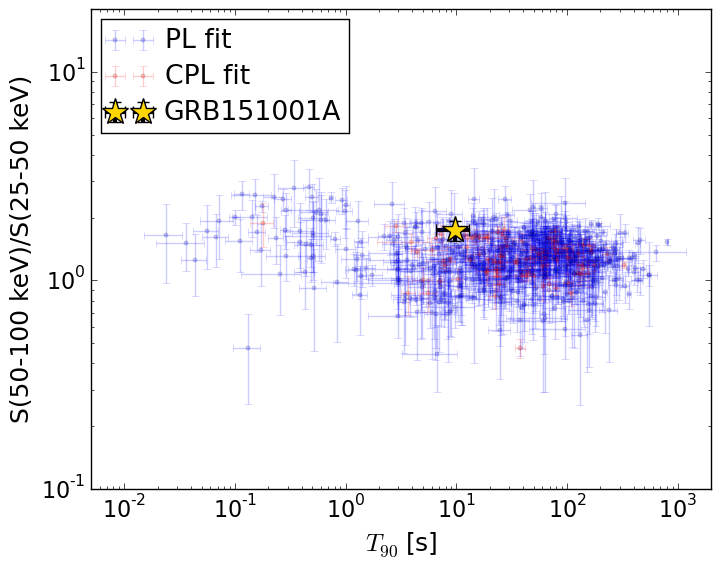
T90                                   = 9.828 sec.
Hardness ratio (energy fluence ratio) = 1.73884141852
S(15-50 keV) vs. S(50-150 keV) plot
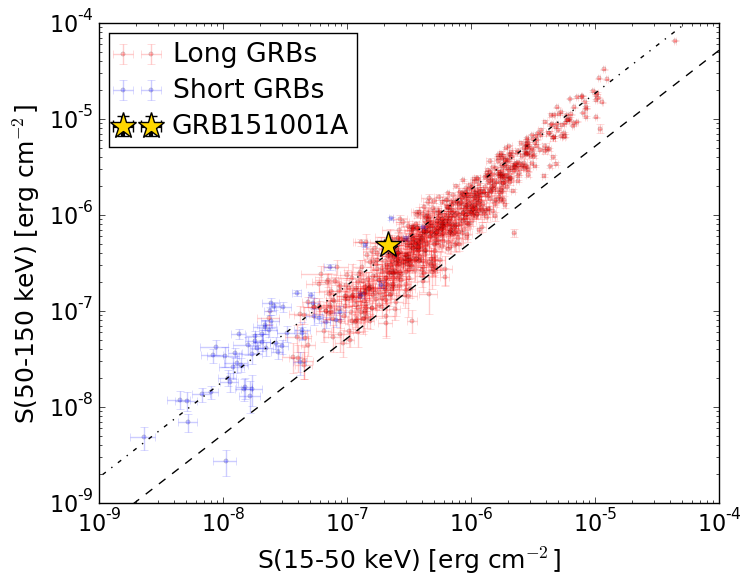
S(15-50 keV)  = 2.121651e-07
S(50-150 keV) = 4.821556e-07
The dash-dotted line and the dashed line traces the fluences calculated from the Band function with Epeak = 15 and 150 keV, respectively. Both lines assume a canonical values of alpha = -1 and beta = -2.5.
Mask shadow pattern
IMX = -4.183390703165987E-02, IMY = -1.088327625007844E-03
Spacecraft aspect plot
Bright source in the pre-burst/pre-slew/post-slew images
Pre-burst image of 15-350 keV band
Time interval of the image:
-463.743400 -446.932600
-239.143600 -6.288000

# RAcent  DECcent POSerr Theta    Phi  PeakCts   SNR AngSep     Name
#  [deg]    [deg]    ['] [deg]  [deg]                   [']
244.9953 -15.6319    0.4  31.2 -174.4   8.1558  30.1    1.0	Sco X-1
254.4385  35.3627    8.0  29.9   67.2   0.6176   1.4    1.5	Her X-1
256.1258 -37.8490  695.5  55.5 -173.2  -0.0132  -0.0    6.6	4U 1700-377
256.4194 -36.4586   40.0  54.4 -174.3  -0.2268  -0.3    2.3	GX 349+2
262.9989 -24.7447  154.6  48.1  171.1   0.0428   0.1    0.6	GX 1+4
268.3772  -1.5084    7.9  38.5  139.0   0.7886   1.5    3.4	SW J1753.5-0127
270.2649 -25.1024    4.0  53.0  165.4  -3.1151  -2.9    1.7	GX 5-1
270.2267 -25.8184    6.1  53.5  166.1  -2.1343  -1.9    6.1	GRS 1758-258
273.8610 -13.9701    0.0  49.1  151.3   1.1895   1.1    9.3	GX 17+2
263.1579 -33.8883   16.8  55.3  178.4  -0.7232  -0.7    9.0	GX 354-0
254.3176 -15.3003    2.5  35.7  171.4   1.4749   4.7 ------	UNKNOWN
210.3304 -26.7687    2.2  45.2 -122.3   5.0854   5.1 ------	UNKNOWN
Pre-slew background subtracted image of 15-350 keV band
Time interval of the image:
-6.288000 7.776000

# RAcent  DECcent POSerr Theta    Phi  PeakCts   SNR AngSep     Name
#  [deg]    [deg]    ['] [deg]  [deg]                   [']
244.7912 -15.5864   31.8  31.1 -174.1   0.0196   0.4   11.3	Sco X-1
254.3468  35.4541    7.3  29.9   67.0  -0.1297  -1.6    8.6	Her X-1
256.0174 -37.8879    6.0  55.5 -173.1   0.3323   1.9    3.0	4U 1700-377
256.4820 -36.4718    3.5  54.4 -174.3   0.5157   3.3    3.7	GX 349+2
263.0229 -24.7714    4.4  48.2  171.1  -0.3271  -2.6    1.7	GX 1+4
268.2703  -1.5773  154.7  38.4  139.1  -0.0081  -0.1    9.5	SW J1753.5-0127
270.2117 -25.1595    5.5  53.0  165.5   0.4761   2.1    6.2	GX 5-1
270.3973 -25.7475    5.6  53.6  165.9   0.4887   2.1    5.1	GRS 1758-258
274.0026 -13.8801    9.5  49.2  151.1  -0.2524  -1.2    9.4	GX 17+2
262.9889 -33.8344  190.6  55.2  178.5  -0.0137  -0.1    0.0	GX 354-0
233.7110  10.9796    0.5   2.4  178.5   1.0836  22.1 ------	UNKNOWN
220.2488 -24.9079    2.5  39.8 -133.2   0.3759   4.5 ------	UNKNOWN
Post-slew image of 15-350 keV band
Time interval of the image:
44.156600 962.894200

# RAcent  DECcent POSerr Theta    Phi  PeakCts   SNR AngSep     Name
#  [deg]    [deg]    ['] [deg]  [deg]                   [']
244.9976 -15.6360    0.3  28.9  171.8  30.8604  43.3    1.1	Sco X-1
254.6226  35.3914   16.0  30.9   49.2   0.7749   0.7    8.6	Her X-1
255.9255 -37.7023    3.9  52.9  172.7   6.9260   3.0    9.0	4U 1700-377
256.3402 -36.4975   30.6  52.0  171.6   0.8549   0.4    6.4	GX 349+2
262.9943 -24.5932   11.9  45.6  156.2   2.0685   1.0    9.2	GX 1+4
268.2445  -1.6281    0.0  36.6  122.8   1.0112   0.7   12.9	SW J1753.5-0127
270.2158 -25.2733    8.1  50.8  150.7   4.8093   1.4   12.2	GX 5-1
270.3410 -25.7491    4.2  51.2  151.1   9.0052   2.7    2.1	GRS 1758-258
274.1202 -13.8402    6.0  47.1  135.5   6.0908   1.9   13.5	GX 17+2
262.9833 -33.8447  175.3  52.8  164.0  -0.1914  -0.1    0.7	GX 354-0
267.4860  42.0613    3.1  42.8   52.1   9.1160   3.8 ------	UNKNOWN
254.5026  29.5213    3.0  26.8   57.9   3.7756   3.8 ------	UNKNOWN
237.6819  19.6585    2.8   9.5   37.9   2.7824   4.2 ------	UNKNOWN
216.9867  19.4325    2.2  18.2  -45.7   3.2382   5.3 ------	UNKNOWN
199.1754  41.3649    3.3  42.9  -24.0   3.9738   3.5 ------	UNKNOWN
233.7498 -46.5729    3.5  57.6 -165.3   9.6853   3.3 ------	UNKNOWN
178.8831  48.6962    3.5  58.9  -24.4  19.9616   3.2 ------	UNKNOWN
217.1422 -45.3705    2.9  58.3 -151.7  14.7891   4.0 ------	UNKNOWN
200.5763 -11.9061    3.5  40.1 -109.1   7.4326   3.3 ------	UNKNOWN
211.7776 -40.4966    4.8  55.3 -145.1  10.5874   2.4 ------	UNKNOWN