Analysis Summary
Notes:
- 1) No attempt has been made to eliminate the non-significant decimal places.
- 2) This batgrbproduct analysis is done using the HEASARC data.
- 3) This batgrbproduct analysis is using the flight position for the mask-weighting calculation.
======================================================================
BAT GRB EVENT DATA PROCESSING REPORT
Process Script Ver: batgrbproduct v2.46
Process Start Time: Sun Nov 1 01:30:34 EDT 2015
Host Name: bat1
Current Working Dir: /local/data/bat1/alien/Swift_3rdBATcatalog/event/batevent_reproc/trigger657321
======================================================================
Trigger: 00657321 Segment: 000
BAT Trigger Time: 465416992 [s; MET]
Trigger Stop: 465417056 [s; MET]
UTC: 2015-10-01T18:29:36.787760 [includes UTCF correction]
Where From?: TDRSS position message
BAT
RA: 336.844828924081 Dec: 64.6607919699014 [deg; J2000]
Catalogged Source?: NO
Point Source?: YES
GRB Indicated?: YES [ by BAT flight software ]
Image S/N Ratio: 7.4
Image Trigger?: YES
Rate S/N Ratio: 0 [ if not an image trigger ]
Image S/N Ratio: 7.4
Analysis Position: [ source = BAT ]
RA: 336.844828924081 Dec: 64.6607919699014 [deg; J2000]
Refined Position: [ source = BAT pre-slew burst ]
RA: 336.959072323374 Dec: 64.6468660404292 [deg; J2000]
{ 22h 27m 50.2s , +64d 38' 48.7" }
+/- 2.13371853446056 [arcmin] (estimated 90% radius based on SNR)
+/- 1.15428672098023 [arcmin] (formal 1-sigma fit error)
SNR: 10.3020221758911
Angular difference between the analysis and refined position is 3.051005 arcmin
Partial Coding Fraction: 0.2851562 [ including projection effects ]
Duration
T90: 131.520000040531 +/- 26.8529220711676
Measured from: -27.3360000252724
to: 104.184000015259 [s; relative to TRIGTIME]
T50: 63.6000000238419 +/- 18.0376494853698
Measured from: 10.5680000185966
to: 74.1680000424385 [s; relative to TRIGTIME]
Fluence
Peak Flux (peak 1 second)
Measured from: 47.4679999947548
to: 48.4679999947548 [s; relative to TRIGTIME]
Total Fluence
Measured from: -39.9599999785423
to: 118.680000007153 [s; relative to TRIGTIME]
Band 1 Band 2 Band 3 Band 4
15-25 25-50 50-100 100-350 keV
Total 1.259749 1.122723 0.479636 0.017222
0.126696 0.130786 0.113448 0.099929 [error]
Peak 0.021325 0.024169 0.018183 0.028176
0.010932 0.011765 0.009571 0.008824 [error]
[ fluence units of on-axis counts / fully illuminated detector ]
======================================================================
====== Table of the duration information =============================
Value tstart tstop
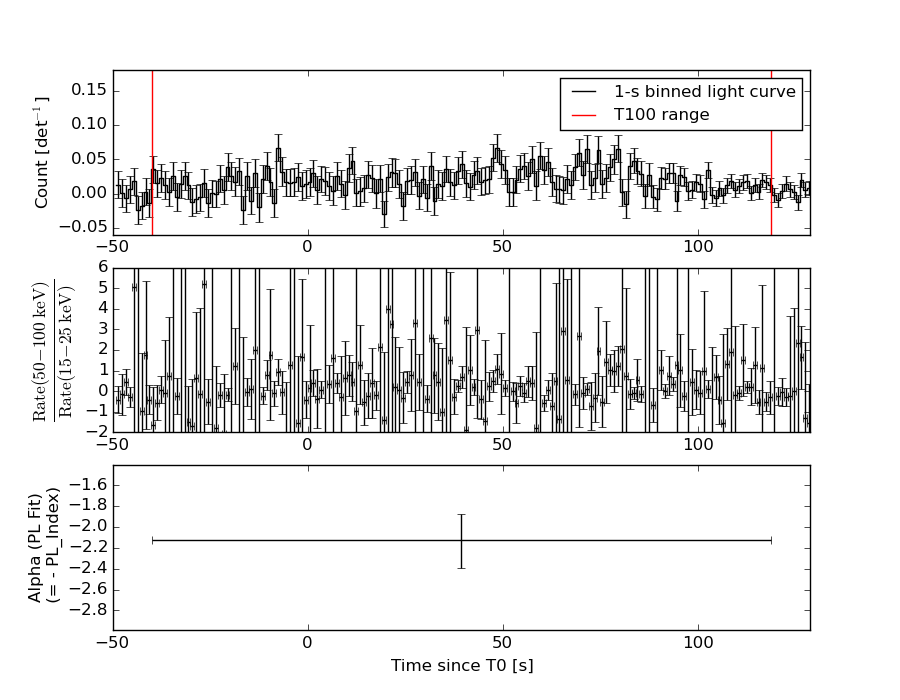
T100 158.640 -39.960 118.680
T90 131.520 -27.336 104.184
T50 63.600 10.568 74.168
Peak 1.000 47.468 48.468
====== Spectral Analysis Summary =====================================
Model : spectral model: simple power-law (PL) and cutoff power-law (CPL)
Ph_index : photon index: E^{Ph_index}
Ph_90err : 90% error of the photon index
Epeak : Epeak in keV
Epeak_90err: 90% error of Epeak
Norm : normalization at 50 keV in both the PL model and CPL model
Nomr_90err : 90% error of the normalization
chi2 : Chi-Squared
dof : degree of freedo
=== Time-averaged spectral analysis ===
(Best model with acceptable fit: PL)
Model Ph_index Ph_90err_low Ph_90err_hi Epeak Epeak_90err_low Epeak_90err_hi Norm Nomr_90err_low Norm_90err_hi chi2 dof
PL -2.125 -0.265 0.244 - - - 1.07e-03 -1.90e-04 1.84e-04 43.890 57
CPL -1.958 N/A N/A 10.454 N/A N/A 1.34e-03 N/A N/A 43.880 56
=== 1-s peak spectral analysis ===
(Best model with acceptable fit: N/A)
Model Ph_index Ph_90err_low Ph_90err_hi Epeak Epeak_90err_low Epeak_90err_hi Norm Nomr_90err_low Norm_90err_hi chi2 dof
PL -0.925 -0.842 1.557 - - - 4.67e-03 -4.67e-03 -4.17e-03 54.280 57
CPL -0.967 -0.802 1.617 9999.360 -9999.360 -9999.360 4.76e-03 -4.76e-03 2.02e-02 54.300 56
=== Fluence/Peak Flux Summary ===
Model Band1 Band2 Band3 Band4 Band5 Total
15-25 25-50 50-100 100-350 15-150 15-350 keV
Fluence PL 3.90e-07 4.90e-07 4.50e-07 7.20e-07 1.58e-06 2.05e-06 erg/cm2
90%_error_low -6.57e-08 -6.39e-08 -1.07e-07 -2.88e-07 -2.44e-07 -4.29e-07 erg/cm2
90%_error_hi 6.70e-08 6.33e-08 1.11e-07 3.95e-07 2.52e-07 5.11e-07 erg/cm2
Peak flux PL 1.11e-01 1.57e-01 1.66e-01 3.23e-01 5.36e-01 7.57e-01 ph/cm2/s
90%_error_low -1.11e-01 -1.57e-01 -7.10e-02 -2.29e-01 -2.81e-01 -3.20e-01 ph/cm2/s
90%_error_hi 1.55e-01 1.07e-01 6.96e-02 1.84e+00 2.76e-01 4.84e-01 ph/cm2/s
Fluence CPL 3.86e-07 4.96e-07 4.14e-07 5.49e-07 1.57e-06 1.85e-06 erg/cm2
90%_error_low -5.83e-08 -5.99e-08 -8.60e-08 -3.49e-07 -1.79e-07 -5.47e-07 erg/cm2
90%_error_hi 5.10e-08 6.47e-08 1.46e-07 6.73e-07 2.20e-07 8.18e-07 erg/cm2
Peak flux CPL 1.32e-01 1.64e-01 1.59e-01 3.15e-01 5.45e-01 7.91e-01 ph/cm2/s
90%_error_low -1.32e-01 N/A -1.59e-01 N/A -5.45e-01 N/A ph/cm2/s
90%_error_hi 1.34e-01 N/A 1.03e-01 N/A 2.71e-01 N/A ph/cm2/s
======================================================================
Image
Pre-slew 15.0-350.0 keV image (Event data)

#   RAcent    DECcent   POSerr    Theta     Phi              Peak Cts       SNR   Name
  336.9591    64.6469   0.0186    33.1457   123.0414         2.8525559     10.302 TRIG_00657321

Foreground time interval of the image:
-39.960  72.901 (delta_t = 112.861 [sec])
Background time interval of the image:
-239.000 -39.960 (delta_t = 199.040 [sec])
Light Curves
Note: The mask-weighted lightcurves have units of either count/det or counts/sec/det, where a det is 0.4 x 0.4 = 0.16 sq cm.
Full-time range; 1 s binning
Other quick-look light curves:
- 64 ms binning (zoomed)
- 16 ms binning (zoomed)
- 8 ms binning (zoomed)
- 2 ms binning (zoomed)
- SN=5 or 10 s binning (full-time range)
- Raw light curve
Spectra
- 64 ms binning (zoomed)
- 16 ms binning (zoomed)
- 8 ms binning (zoomed)
- 2 ms binning (zoomed)
- SN=5 or 10 s binning (full-time range)
- Raw light curve
Spectra
Notes:
- 1) The fitting includes the systematic errors.
- 2) When the burst includes telescope slew time periods, the fitting uses an average response file made from multiple 5-s response files through out the slew time plus single time preiod for the non-slew times, and weighted by the total counts in the corresponding time period using addrmf. An average response file is needed becuase a spectral fit using the pre-slew DRM will introduce some errors in both a spectral shape and a normalization if the PHA file contains a lot of the slew/post-slew time interval.
- 3) For fits to more complicated models (e.g. a power-law over a cutoff power-law), the BAT team has decided to require a chi-square improvement of more than 6 for each extra dof.
Time averaged spectrum fit using the average DRM
Power-law model

Time interval is from  -39.960 sec. to  118.680 sec.

Spectral model in power-law:
------------------------------------------------------------
Parameters  : value       lower 90%   higher 90%
Photon index: -2.12502     ( -0.264833   0.243778 )
Norm@50keV  : 1.06618E-03    ( -0.000190331   0.00018441 )
------------------------------------------------------------
#Fit statistic : Chi-Squared =          43.89 using 59 PHA bins.
# Reduced chi-squared =         0.7700 for     57 degrees of freedom
# Null hypothesis probability =   8.985070e-01

Photon flux (15-150 keV)    in 158.6 sec: 0.169855 ( -0.021201  0.021201 ) ph/cm2/s
Energy fluence (15-150 keV)             : 1.57541e-06 ( -2.44455e-07  2.51906e-07 ) ergs/cm2
Cutoff power-law model
Time interval is from  -39.960 sec. to  118.680 sec.
Spectral model in the cutoff power-law:
------------------------------------------------------------
Parameters  : value       lower 90%   higher 90%
Photon index: -1.98704     (       )
Epeak [keV] : 3.82425      (   )
Norm@50keV  : 1.28636E-03    (     )
------------------------------------------------------------
#Fit statistic : Chi-Squared =          43.87 using 59 PHA bins.
# Reduced chi-squared =         0.7833 for     56 degrees of freedom
# Null hypothesis probability =   8.805037e-01

Photon flux (15-150 keV)    in 158.6 sec: 0.169620 ( -0.02109  0.021785 ) ph/cm2/s
Energy fluence (15-150 keV)             : 1.57037e-06 ( -1.79356e-07  2.20368e-07 ) ergs/cm2
1-s peak spectrum fit
Power-law model

Time interval is from   47.468 sec. to   48.468 sec.

Spectral model in power-law:
------------------------------------------------------------
Parameters  : value       lower 90%   higher 90%
Photon index: 2.33886     ( -0.842965   1.5569 )
Norm@50keV  : 8.76267E-05    ( -8.75513e-05   0.000412328 )
------------------------------------------------------------
#Fit statistic : Chi-Squared =          53.89 using 59 PHA bins.
# Reduced chi-squared =         0.9455 for     57 degrees of freedom
# Null hypothesis probability =   5.923449e-01

Photon flux (15-150 keV)    in 1 sec: 0.535520 ( -0.280594  0.27633 ) ph/cm2/s
Energy fluence (15-150 keV)             : 5.18681e-08 ( -2.19647e-08  2.19495e-08 ) ergs/cm2
Cutoff power-law model

Time interval is from   47.468 sec. to   48.468 sec.
Spectral model in the cutoff power-law:
------------------------------------------------------------
Parameters  : value       lower 90%   higher 90%
Photon index: -0.96675     ( -0.803727   1.61455 )
Epeak [keV] : 9999.36      ( -9999.36 -9999.36 )
Norm@50keV  : 4.75924E-03    ( -0.00475155   0.0202183 )
------------------------------------------------------------
#Fit statistic : Chi-Squared =          54.30 using 59 PHA bins.
# Reduced chi-squared =         0.9697 for     56 degrees of freedom
# Null hypothesis probability =   5.394280e-01

Photon flux (15-150 keV)    in 1 sec: 0.544999 ( -0.544999  0.271267 ) ph/cm2/s
Energy fluence (15-150 keV)             : 5.14719e-08 ( -2.15988e-08  2.20082e-08 ) ergs/cm2
Time-resolved spectra
Distribution
T90 vs. Hardness ratio plot

T90                                   = 131.52 sec.
Hardness ratio (energy fluence ratio) = 0.917043558509
S(15-50 keV) vs. S(50-150 keV) plot

S(15-50 keV)  = 8.801035e-07
S(50-150 keV) = 6.953208e-07
The dash-dotted line and the dashed line traces the fluences calculated from the Band function with Epeak = 15 and 150 keV, respectively. Both lines assume a canonical values of alpha = -1 and beta = -2.5.
Mask shadow pattern

IMX = -3.560606092275742E-01, IMY = -5.474196051367878E-01
Spacecraft aspect plot

Bright source in the pre-burst/pre-slew/post-slew images
Pre-burst image of 15-350 keV band
Time interval of the image:
-239.000000 -39.960000

# RAcent  DECcent POSerr Theta    Phi  PeakCts   SNR AngSep     Name
#  [deg]    [deg]    ['] [deg]  [deg]                   [']
 20.3534  52.3327    2.7  39.6   81.4   3.5403   4.2 ------	UNKNOWN
266.6368  56.7551    2.4  41.8  177.7   1.4041   4.8 ------	UNKNOWN
169.3313  77.8035    2.8  10.0 -128.7   0.7058   4.2 ------	UNKNOWN
241.6932  64.9784    2.9  31.5 -165.0   0.8258   4.0 ------	UNKNOWN
228.2063  38.8312    4.1  55.3 -144.7   2.9854   2.8 ------	UNKNOWN
217.4469  41.6187    2.5  50.9 -135.4   4.2834   4.6 ------	UNKNOWN
Pre-slew background subtracted image of 15-350 keV band
Time interval of the image:
-39.960000 72.900610

# RAcent  DECcent POSerr Theta    Phi  PeakCts   SNR AngSep     Name
#  [deg]    [deg]    ['] [deg]  [deg]                   [']
336.9588  64.6476    1.1  33.1  123.0   2.8541  10.3 ------	UNKNOWN
123.7495  44.3292    1.9  36.2  -35.4   1.0883   6.0 ------	UNKNOWN
Post-slew image of 15-350 keV band
Time interval of the image:
127.700600 963.080000

# RAcent  DECcent POSerr Theta    Phi  PeakCts   SNR AngSep     Name
#  [deg]    [deg]    ['] [deg]  [deg]                   [']
299.6277  35.1890    2.6  36.9  179.7   3.3893   4.4    2.0	Cyg X-1
308.0605  40.9618    1.2  28.9  173.2   6.0445   9.9    2.3	Cyg X-3
325.9415  38.2979   45.1  27.2  143.4  -0.1781  -0.3   10.9	Cyg X-2
 35.6581  58.6416    2.8  27.5   19.1   2.3197   4.1 ------	UNKNOWN
 73.1676  57.6941    5.1  42.4   -3.6   1.8915   2.3 ------	UNKNOWN
 98.3938  49.1681    2.4  57.5  -14.2  12.3488   4.7 ------	UNKNOWN
268.5579  36.8967    3.1  48.0 -146.4   5.1624   3.7 ------	UNKNOWN
111.6378  51.2168    3.7  58.9  -24.3  13.7084   3.1 ------	UNKNOWN
262.8606  31.1439    5.0  55.3 -145.1   8.2597   2.3 ------	UNKNOWN
250.1128  49.4503    4.1  45.3 -121.4   6.8309   2.8 ------	UNKNOWN