Analysis Summary
Notes:
- 1) No attempt has been made to eliminate the non-significant decimal places.
- 2) This batgrbproduct analysis is done using the HEASARC data.
- 3) This batgrbproduct analysis is using the flight position for the mask-weighting calculation.
======================================================================
                  BAT GRB EVENT DATA PROCESSING REPORT
    Process Script Ver: batgrbproduct v2.46
    Process Start Time: Sun Nov  1 01:26:32 EDT 2015
             Host Name: bat1
   Current Working Dir: /local/data/bat1/alien/Swift_3rdBATcatalog/event/batevent_reproc/trigger657564
======================================================================

  Trigger: 00657564      Segment: 000

  BAT Trigger Time: 465674960   [s; MET]
      Trigger Stop: 465675032   [s; MET]
               UTC: 2015-10-04T18:09:04.774100    [includes UTCF correction]
       Where From?: TDRSS position message

  BAT
    RA: 213.584663525959   Dec: -64.9473172592527  [deg; J2000]

     Catalogged Source?: NO
     Point Source?:      YES
     GRB Indicated?:     YES    [ by BAT flight software ]
     Image S/N Ratio:    8.34
     Image Trigger?:     YES
     Rate S/N Ratio:     0  [ if not an image trigger ]
     Image S/N Ratio:    8.34

  Analysis Position:   [ source = BAT ]
    RA: 213.584663525959   Dec: -64.9473172592527  [deg; J2000]

  Refined Position:   [ source = BAT pre-slew burst ]
    RA: 213.612422909715   Dec: -64.9553838360062  [deg; J2000]
        { 14h 14m 27.0s , -64d 57' 19.4" }
         +/- 2.32132264971755 [arcmin] (estimated 90% radius based on SNR)
         +/- 1.38499924215337 [arcmin] (formal 1-sigma fit error)
    SNR: 9.13353887294024

  Angular difference between the analysis and refined position is 0.855294 arcmin

  Partial Coding Fraction: 1.03125    [ including projection effects ]

  Duration
     T90: 137.271999955177 +/- 17.0245339786588
        Measured from: -9.36000001430511
                   to: 127.911999940872     [s; relative to TRIGTIME]
     T50: 69.1959999799728 +/- 20.6551922084551
        Measured from: 22.0199999809265
                   to: 91.2159999608994     [s; relative to TRIGTIME]


  Fluence
     Peak Flux  (peak 1 second)
        Measured from: 50.8600000143051
                   to: 51.8600000143051     [s; relative to TRIGTIME]
     Total Fluence
        Measured from: -13.6320000290871
                   to: 134.367999970913     [s; relative to TRIGTIME]

             Band 1     Band 2     Band 3     Band 4
              15-25      25-50     50-100    100-350     keV
 Total     0.733502   0.696735   0.398822   0.174855
           0.079864   0.075049   0.062808   0.053940 [error]
 Peak      0.028063   0.014240   0.007713   0.009344
           0.006751   0.006192   0.005121   0.004326 [error]

     [ fluence units of on-axis counts / fully illuminated detector ]

======================================================================


====== Table of the duration information =============================

        Value   tstart    tstop
T100  148.000  -13.632  134.368
T90   137.272   -9.360  127.912
T50    69.196   22.020   91.216
Peak    1.000   50.860   51.860


====== Spectral Analysis Summary =====================================

Model      : spectral model: simple power-law (PL) and cutoff power-law (CPL)
Ph_index   : photon index: E^{Ph_index}
Ph_90err   : 90% error of the photon index
Epeak      : Epeak in keV
Epeak_90err: 90% error of Epeak
Norm       : normalization at 50 keV in both the PL model and CPL model
Nomr_90err : 90% error of the normalization
chi2       : Chi-Squared
dof        : degree of freedo

=== Time-averaged spectral analysis ===
(Best model with acceptable fit: PL)

Model Ph_index Ph_90err_low Ph_90err_hi  Epeak  Epeak_90err_low  Epeak_90err_hi  Norm       Nomr_90err_low    Norm_90err_hi    chi2    dof
PL      -1.953    -0.231      0.219       -           -               -         7.44e-04     -1.07e-04          1.04e-04      37.000   57
CPL     -1.947    -0.728      0.913      356.408      N/A           N/A         7.49e-04        N/A               N/A         37.010   56


=== 1-s peak spectral analysis ===
(Best model with acceptable fit: N/A)

Model Ph_index Ph_90err_low Ph_90err_hi  Epeak  Epeak_90err_low  Epeak_90err_hi  Norm       Nomr_90err_low    Norm_90err_hi    chi2    dof
PL      -2.437     -1.081     0.813       -           -               -         2.18e-03     -2.18e-03          1.39e-03      77.120   57
CPL     -1.849      N/A       N/A          21.369      N/A           N/A         3.77e-03        N/A               N/A         77.930   56


=== Fluence/Peak Flux Summary ===

              Model    Band1     Band2     Band3     Band4     Band5     Total
                       15-25     25-50    50-100    100-350    15-150    15-350    keV
Fluence         PL   2.15e-07  3.01e-07  3.11e-07  5.88e-07  1.01e-06  1.41e-06   erg/cm2
      90%_error_low -3.60e-08 -3.41e-08 -6.09e-08 -2.04e-07 -1.37e-07 -2.74e-07   erg/cm2
      90%_error_hi   3.71e-08  3.41e-08  6.21e-08  2.68e-07  1.41e-07  3.23e-07   erg/cm2
Peak flux       PL   2.23e-01  1.30e-01  4.79e-02  2.34e-02  4.13e-01  4.24e-01   ph/cm2/s
      90%_error_low -1.01e-01 -5.77e-02 -3.46e-02 -2.34e-02 -1.46e-01 -1.52e-01   ph/cm2/s
      90%_error_hi   1.01e-01  5.11e-02  4.58e-02  6.39e-02  1.46e-01  1.54e-01   ph/cm2/s

Fluence        CPL   2.16e-07  2.99e-07  3.13e-07  6.65e-07  1.02e-06  1.41e-06   erg/cm2
      90%_error_low -3.82e-08 -4.62e-08 -6.29e-08 -4.82e-07 -1.71e-07 -5.02e-07   erg/cm2
      90%_error_hi   3.32e-08  3.35e-08  3.71e-08  1.50e-07  1.19e-07  1.69e-07   erg/cm2
Peak flux      CPL   2.09e-01  8.47e-02  2.12e-02  7.75e-03  3.20e-01  3.22e-01   ph/cm2/s
      90%_error_low -1.04e-01 -8.47e-02     N/A   -7.75e-03     N/A   -1.81e-01   ph/cm2/s
      90%_error_hi   1.04e-01  8.86e-02     N/A    5.83e-02     N/A    2.41e-01   ph/cm2/s

======================================================================
Image
Pre-slew 15.0-350.0 keV image (Event data)
#   RAcent    DECcent   POSerr    Theta     Phi              Peak Cts       SNR   Name
  213.6124   -64.9554   0.0211    16.0347  -166.3599         1.6049647      9.134 TRIG_00657564

Foreground time interval of the image:
-13.632 134.368 (delta_t = 148.000 [sec])
Background time interval of the image:
-204.899 -13.632 (delta_t = 191.267 [sec])
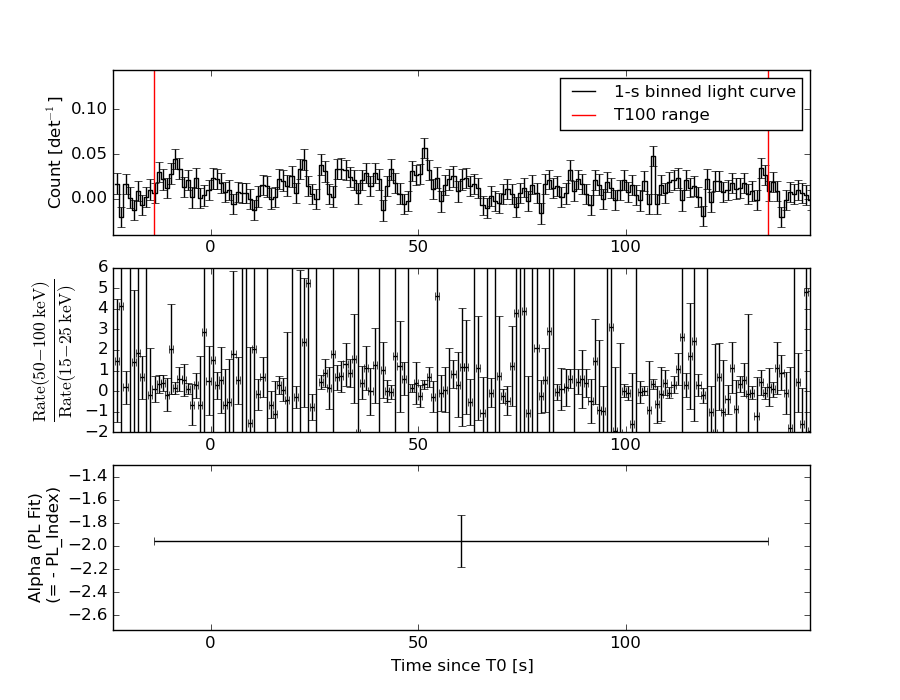
Light Curves
Note: The mask-weighted lightcurves have units of either count/det or counts/sec/det, where a det is 0.4 x 0.4 = 0.16 sq cm.
Full-time range; 1 s binning
Other quick-look light curves:
- 64 ms binning (zoomed)
- 16 ms binning (zoomed)
- 8 ms binning (zoomed)
- 2 ms binning (zoomed)
- SN=5 or 10 s binning (full-time range)
- Raw light curve
Spectra
- 64 ms binning (zoomed)
- 16 ms binning (zoomed)
- 8 ms binning (zoomed)
- 2 ms binning (zoomed)
- SN=5 or 10 s binning (full-time range)
- Raw light curve
Spectra
Notes:
- 1) The fitting includes the systematic errors.
- 2) When the burst includes telescope slew time periods, the fitting uses an average response file made from multiple 5-s response files through out the slew time plus single time preiod for the non-slew times, and weighted by the total counts in the corresponding time period using addrmf. An average response file is needed becuase a spectral fit using the pre-slew DRM will introduce some errors in both a spectral shape and a normalization if the PHA file contains a lot of the slew/post-slew time interval.
- 3) For fits to more complicated models (e.g. a power-law over a cutoff power-law), the BAT team has decided to require a chi-square improvement of more than 6 for each extra dof.
Time averaged spectrum fit using the average DRM
Power-law model
Time interval is from  -13.632 sec. to  134.368 sec.

Spectral model in power-law:
------------------------------------------------------------
Parameters  : value       lower 90%   higher 90%
Photon index: -1.95256     ( -0.230686   0.219386 )
Norm@50keV  : 7.43679E-04    ( -0.000106924   0.000103845 )
------------------------------------------------------------
#Fit statistic : Chi-Squared =          37.00 using 59 PHA bins.
# Reduced chi-squared =         0.6492 for     57 degrees of freedom
# Null hypothesis probability =   9.815691e-01

Photon flux (15-150 keV)    in 148 sec: 0.109195 ( -0.012436  0.012446 ) ph/cm2/s
Energy fluence (15-150 keV)             : 1.01315e-06 ( -1.37493e-07  1.40631e-07 ) ergs/cm2
Cutoff power-law model

Time interval is from  -13.632 sec. to  134.368 sec.
Spectral model in the cutoff power-law:
------------------------------------------------------------
Parameters  : value       lower 90%   higher 90%
Photon index: -1.94703     ( -0.724369   0.915934 )
Epeak [keV] : 356.408      (   )
Norm@50keV  : 7.48873E-04    (     )
------------------------------------------------------------
#Fit statistic : Chi-Squared =          37.00 using 59 PHA bins.
# Reduced chi-squared =         0.6608 for     56 degrees of freedom
# Null hypothesis probability =   9.764699e-01

Photon flux (15-150 keV)    in 148 sec: 0.109481 ( -0.0123789  0.012383 ) ph/cm2/s
Energy fluence (15-150 keV)             : 1.02198e-06 ( -1.70582e-07  1.18775e-07 ) ergs/cm2
1-s peak spectrum fit
Power-law model
Time interval is from   50.860 sec. to   51.860 sec.

Spectral model in power-law:
------------------------------------------------------------
Parameters  : value       lower 90%   higher 90%
Photon index: -2.43741     ( -1.08139   0.813236 )
Norm@50keV  : 2.18331E-03    ( -0.00218326   0.0013853 )
------------------------------------------------------------
#Fit statistic : Chi-Squared =          77.12 using 59 PHA bins.
# Reduced chi-squared =          1.353 for     57 degrees of freedom
# Null hypothesis probability =   3.920492e-02

Photon flux (15-150 keV)    in 1 sec: 0.413040 ( -0.145714  0.14589 ) ph/cm2/s
Energy fluence (15-150 keV)             : 2.14902e-08 ( -9.70302e-09  1.13276e-08 ) ergs/cm2
Cutoff power-law model
Time interval is from   50.860 sec. to   51.860 sec.
Spectral model in the cutoff power-law:
------------------------------------------------------------
Parameters  : value       lower 90%   higher 90%
Photon index: -1.84908     (       )
Epeak [keV] : 21.3692      (   )
Norm@50keV  : 3.76509E-03    (     )
------------------------------------------------------------
#Fit statistic : Chi-Squared =          77.93 using 59 PHA bins.
# Reduced chi-squared =          1.392 for     56 degrees of freedom
# Null hypothesis probability =   2.794911e-02

Photon flux (15-150 keV)    in 1 sec: 0.319611 (    ) ph/cm2/s
Energy fluence (15-150 keV)             : 1.86226e-08 ( 0  0 ) ergs/cm2
Time-resolved spectra
Distribution
T90 vs. Hardness ratio plot
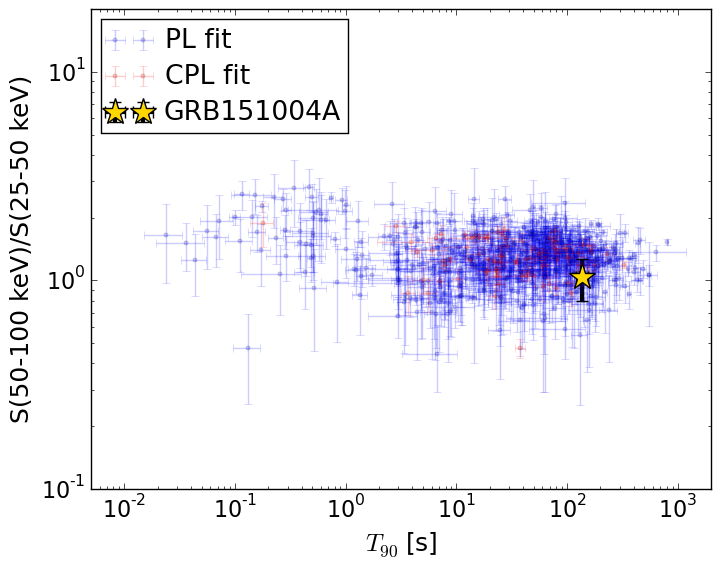
T90                                   = 137.272 sec.
Hardness ratio (energy fluence ratio) = 1.03347529753
S(15-50 keV) vs. S(50-150 keV) plot
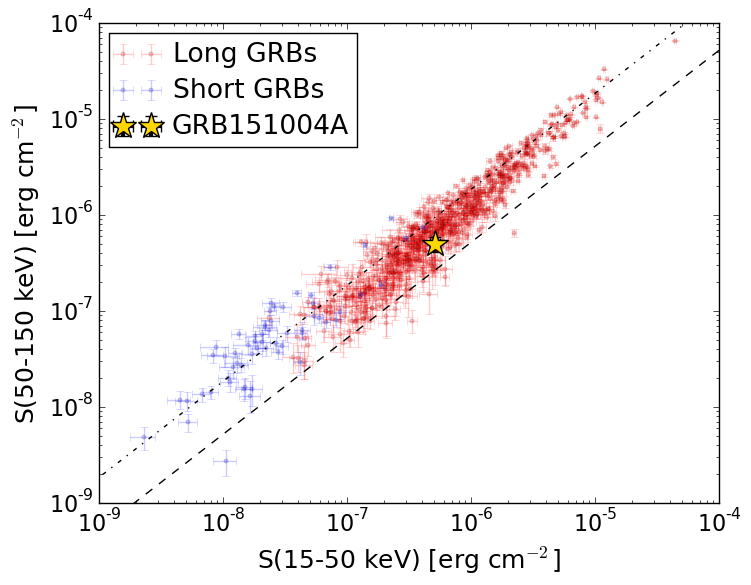
S(15-50 keV)  = 5.159393e-07
S(50-150 keV) = 4.971974e-07
The dash-dotted line and the dashed line traces the fluences calculated from the Band function with Epeak = 15 and 150 keV, respectively. Both lines assume a canonical values of alpha = -1 and beta = -2.5.
Mask shadow pattern
IMX = -2.792950495861873E-01, IMY = 6.777528116018484E-02
Spacecraft aspect plot
Bright source in the pre-burst/pre-slew/post-slew images
Pre-burst image of 15-350 keV band
Time interval of the image:
-204.899400 -13.632000

# RAcent  DECcent POSerr Theta    Phi  PeakCts   SNR AngSep     Name
#  [deg]    [deg]    ['] [deg]  [deg]                   [']
170.3899 -60.6210    3.1  35.1 -153.3   1.0101   3.7    2.2	Cen X-3
186.3343 -62.7917    5.1  27.3 -154.0   0.4964   2.2    8.9	GX 301-2
244.9872 -15.6499    0.5  39.1  -14.2   6.4663  22.7    0.7	Sco X-1
255.7835 -37.9535   42.3  20.4   19.0   0.0561   0.3   11.6	4U 1700-377
256.5908 -36.3167    6.3  22.2   18.3   0.3979   1.8    9.9	GX 349+2
262.8748 -24.7310   31.4  34.9   17.0  -0.1118  -0.4    7.4	GX 1+4
264.8626 -44.3132   11.8  20.1   46.2   0.2216   1.0    9.7	4U 1735-44
270.4020 -25.1662    2.3  37.8   27.5   1.7824   5.0    8.3	GX 5-1
270.2522 -25.7551    3.3  37.2   27.9   1.2816   3.5    2.8	GRS 1758-258
274.0259 -14.0598   22.0  49.2   24.1  -0.3799  -0.5    1.8	GX 17+2
276.0767 -30.5162    3.3  36.2   39.5  -1.3528  -3.5   11.9	H1820-303
285.1076 -24.8936   11.6  45.5   44.0  -0.8739  -1.0    4.2	HT1900.1-2455
262.8244 -33.8787    5.0  26.9   25.7   0.5910   2.3    8.6	GX 354-0
116.4104 -59.1724    3.8  57.2 -173.9   3.6889   3.0 ------	UNKNOWN
246.9900   3.2652    2.2  58.1  -14.4   5.0286   5.2 ------	UNKNOWN
234.6912  -5.0664    2.7  49.3  -29.3   1.8937   4.2 ------	UNKNOWN
210.6056 -23.9810    2.6  36.4  -69.8   1.9756   4.4 ------	UNKNOWN
220.5980  -7.2808    2.5  49.0  -48.1   4.3856   4.6 ------	UNKNOWN
Pre-slew background subtracted image of 15-350 keV band
Time interval of the image:
-13.632000 134.368000

# RAcent  DECcent POSerr Theta    Phi  PeakCts   SNR AngSep     Name
#  [deg]    [deg]    ['] [deg]  [deg]                   [']
170.6065 -60.5493    4.0  35.1 -153.2  -0.7270  -2.9    9.6	Cen X-3
186.3576 -62.8119    6.6  27.3 -154.1  -0.3540  -1.7    8.6	GX 301-2
244.9348 -15.5827    6.4  39.1  -14.3   0.4675   1.8    4.3	Sco X-1
255.8040 -37.8451   22.8  20.5   18.9   0.0933   0.5    8.7	4U 1700-377
256.5278 -36.5929    7.8  21.9   18.5   0.2731   1.5   11.1	GX 349+2
262.9905 -24.5913    8.0  35.1   17.1  -0.3926  -1.4    9.3	GX 1+4
264.8174 -44.3097   15.5  20.1   46.1  -0.1624  -0.7    9.0	4U 1735-44
270.1484 -25.1523    3.9  37.7   27.2   0.9183   3.0    8.6	GX 5-1
270.2735 -25.7594    7.4  37.2   27.9  -0.4851  -1.5    1.8	GRS 1758-258
273.9388 -13.9780    3.6  49.2   23.9   2.2678   3.2    5.2	GX 17+2
276.0056 -30.3939    9.4  36.3   39.2   0.4389   1.2    4.5	H1820-303
285.0404 -24.8523    7.4  45.5   43.9   1.2612   1.6    4.1	HT1900.1-2455
263.0566 -33.7991    6.1  27.1   26.0   0.4165   1.9    4.0	GX 354-0
213.6130 -64.9547    1.3  16.0 -166.4   1.5899   9.0 ------	UNKNOWN
250.5653  -7.3032    2.4  48.1   -8.1   1.8811   4.8 ------	UNKNOWN
167.6857 -64.4509    2.4  35.1 -160.3   1.1494   4.8 ------	UNKNOWN
Post-slew image of 15-350 keV band
Time interval of the image:
798.500630 963.110000

# RAcent  DECcent POSerr Theta    Phi  PeakCts   SNR AngSep     Name
#  [deg]    [deg]    ['] [deg]  [deg]                   [']
268.3408  -1.4346  149.8  48.7  -42.0  -0.0383  -0.1    2.0	SW J1753.5-0127
270.2272 -24.9697    3.5  39.4  -73.5   1.4708   3.3    7.3	GX 5-1
270.2363 -25.8610    3.4  39.3  -74.9   1.5608   3.4    7.9	GRS 1758-258
273.9813 -14.0051    8.0  38.4  -55.2   0.4088   1.4    2.4	GX 17+2
276.0720 -30.2245    4.5  34.1  -82.1   0.7786   2.5   11.5	H1820-303
285.1521 -24.7407    0.0  25.9  -71.4  -0.2392  -1.1   12.5	HT1900.1-2455
288.8046  10.9590    0.9  41.6   -9.6   3.0343  12.5    0.9	GRS 1915+105
318.8045 -26.5587    3.3   6.1  157.2   0.5284   3.5 ------	UNKNOWN
 15.5998 -62.1748    3.3  57.0  179.1   4.3822   3.6 ------	UNKNOWN
296.3911   1.7749    2.1  29.7   -7.8   1.0064   5.5 ------	UNKNOWN
284.0057  15.1402    2.7  47.7  -11.4   1.3374   4.2 ------	UNKNOWN
  9.0480 -70.5976    2.9  57.4 -170.4   3.3006   4.0 ------	UNKNOWN
272.0204   2.3082    2.6  47.6  -35.1   1.7131   4.5 ------	UNKNOWN