Analysis Summary
Notes:
- 1) No attempt has been made to eliminate the non-significant decimal places.
- 2) This batgrbproduct analysis is done using the HEASARC data.
- 3) This batgrbproduct analysis is using the flight position for the mask-weighting calculation.
======================================================================
                  BAT GRB EVENT DATA PROCESSING REPORT
    Process Script Ver: batgrbproduct v2.46
    Process Start Time: Mon Nov 16 01:27:45 EST 2015
             Host Name: bat1
   Current Working Dir: /local/data/bat1/alien/Swift_3rdBATcatalog/event/batevent_reproc/trigger660671
======================================================================

  Trigger: 00660671      Segment: 000

  BAT Trigger Time: 467083767.872   [s; MET]
      Trigger Stop: 467083768.896   [s; MET]
               UTC: 2015-10-21T01:29:12.571160    [includes UTCF correction]
       Where From?: TDRSS position message

  BAT
    RA: 337.611486078815   Dec: -33.1989135771919  [deg; J2000]

     Catalogged Source?: NO
     Point Source?:      YES
     GRB Indicated?:     YES    [ by BAT flight software ]
     Image S/N Ratio:    6.89
     Image Trigger?:     NO
     Rate S/N Ratio:     35.028559776274  [ if not an image trigger ]
     Image S/N Ratio:    6.89

  Analysis Position:   [ source = BAT ]
    RA: 337.611486078815   Dec: -33.1989135771919  [deg; J2000]

  Refined Position:   [ source = BAT pre-slew burst ]
    RA: 337.64732576254   Dec: -33.188926355189  [deg; J2000]
        { 22h 30m 35.4s , -33d 11' 20.1" }
         +/- 0.953072280628945 [arcmin] (estimated 90% radius based on SNR)
         +/- 0.305838480370022 [arcmin] (formal 1-sigma fit error)
    SNR: 32.5790645789516

  Angular difference between the analysis and refined position is 1.896638 arcmin

  Partial Coding Fraction: 0.1054688    [ including projection effects ]

  Duration
     T90: 110.055999994278 +/- 3.59386366914112
        Measured from: -15.2039999961853
                   to: 94.8519999980927     [s; relative to TRIGTIME]
     T50: 36.3719999790192 +/- 1.13083329441536
        Measured from: 0.675999999046326
                   to: 37.0479999780655     [s; relative to TRIGTIME]


  Fluence
     Peak Flux  (peak 1 second)
        Measured from: -0.131999969482422
                   to: 0.868000030517578     [s; relative to TRIGTIME]
     Total Fluence
        Measured from: -21.6200000047684
                   to: 127.424000024796     [s; relative to TRIGTIME]

             Band 1     Band 2     Band 3     Band 4
              15-25      25-50     50-100    100-350     keV
 Total    10.781857  15.186069  12.009707   3.691396
           0.177256   0.198785   0.188483   0.148115 [error]
 Peak      0.293533   0.355235   0.375000   0.129215
           0.026112   0.031302   0.032684   0.024505 [error]

     [ fluence units of on-axis counts / fully illuminated detector ]

======================================================================


====== Table of the duration information =============================

        Value   tstart    tstop
T100  149.044  -21.620  127.424
T90   110.056  -15.204   94.852
T50    36.372    0.676   37.048
Peak    1.000   -0.132    0.868


====== Spectral Analysis Summary =====================================

Model      : spectral model: simple power-law (PL) and cutoff power-law (CPL)
Ph_index   : photon index: E^{Ph_index}
Ph_90err   : 90% error of the photon index
Epeak      : Epeak in keV
Epeak_90err: 90% error of Epeak
Norm       : normalization at 50 keV in both the PL model and CPL model
Nomr_90err : 90% error of the normalization
chi2       : Chi-Squared
dof        : degree of freedo

=== Time-averaged spectral analysis ===
(Best model with acceptable fit: PL)

Model Ph_index Ph_90err_low Ph_90err_hi  Epeak  Epeak_90err_low  Epeak_90err_hi  Norm       Nomr_90err_low    Norm_90err_hi    chi2    dof
PL      -1.525    -0.037      0.037       -           -               -         1.95e-02     -3.69e-04          3.68e-04      37.100   57
CPL     -1.523    -0.036      0.039     9999.360    -9999.360      -9999.360      1.95e-02     -3.40e-04          1.76e-03      37.180   56


=== 1-s peak spectral analysis ===
(Best model with acceptable fit: PL)

Model Ph_index Ph_90err_low Ph_90err_hi  Epeak  Epeak_90err_low  Epeak_90err_hi  Norm       Nomr_90err_low    Norm_90err_hi    chi2    dof
PL      -1.420     -0.157     0.154       -           -               -         7.96e-02     -6.98e-03          6.94e-03      47.830   57
CPL     -1.417     -0.159     0.265     9999.340    -9999.340      -9999.340      7.99e-02     -7.99e-02          2.84e-02      47.850   56


=== Fluence/Peak Flux Summary ===

              Model    Band1     Band2     Band3     Band4     Band5     Total
                       15-25     25-50    50-100    100-350    15-150    15-350    keV
Fluence         PL   3.79e-06  6.86e-06  9.53e-06  2.76e-05  2.74e-05  4.78e-05   erg/cm2
      90%_error_low -1.55e-07 -1.62e-07 -2.11e-07 -1.43e-06 -5.25e-07 -1.50e-06   erg/cm2
      90%_error_hi   1.58e-07  1.61e-07  2.10e-07  1.48e-06  5.25e-07  1.54e-06   erg/cm2
Peak flux       PL   3.04e+00  3.20e+00  2.39e+00  2.90e+00  9.74e+00  1.15e+01   ph/cm2/s
      90%_error_low -4.54e-01 -2.96e-01 -2.69e-01 -6.31e-01 -8.39e-01 -1.02e+00   ph/cm2/s
      90%_error_hi   4.76e-01  2.93e-01  2.65e-01  7.25e-01  8.40e-01  1.03e+00   ph/cm2/s

Fluence        CPL   3.79e-06  6.85e-06  9.48e-06  2.91e-05  2.75e-05  4.77e-05   erg/cm2
      90%_error_low    N/A       N/A       N/A       N/A    -6.28e-07 -2.96e-06   erg/cm2
      90%_error_hi     N/A       N/A       N/A       N/A     4.22e-07  1.48e-06   erg/cm2
Peak flux      CPL   2.34e+00  1.51e+00  6.69e-01  4.86e-01  4.71e+00  4.98e+00   ph/cm2/s
      90%_error_low -6.51e-01 -4.27e-01 -6.69e-01 4.16e-02 -1.33e+00 -1.40e+00   ph/cm2/s
      90%_error_hi   6.33e-01  4.60e-01  2.86e-01  4.43e-01  1.32e+00  1.40e+00   ph/cm2/s

======================================================================
Image
Pre-slew 15.0-350.0 keV image (Event data)
#   RAcent    DECcent   POSerr    Theta     Phi              Peak Cts       SNR   Name
  337.6473   -33.1889   0.0060    43.6488    37.5777        22.7162599     32.579 TRIG_00660671

Foreground time interval of the image:
-21.620  16.829 (delta_t =  38.449 [sec])
Background time interval of the image:
-239.872 -21.620 (delta_t = 218.252 [sec])
Light Curves
Note: The mask-weighted lightcurves have units of either count/det or counts/sec/det, where a det is 0.4 x 0.4 = 0.16 sq cm.
Full-time range; 1 s binning
Other quick-look light curves:
- 64 ms binning (zoomed)
- 16 ms binning (zoomed)
- 8 ms binning (zoomed)
- 2 ms binning (zoomed)
- SN=5 or 10 s binning (full-time range)
- Raw light curve
Spectra
- 64 ms binning (zoomed)
- 16 ms binning (zoomed)
- 8 ms binning (zoomed)
- 2 ms binning (zoomed)
- SN=5 or 10 s binning (full-time range)
- Raw light curve
Spectra
Notes:
- 1) The fitting includes the systematic errors.
- 2) When the burst includes telescope slew time periods, the fitting uses an average response file made from multiple 5-s response files through out the slew time plus single time preiod for the non-slew times, and weighted by the total counts in the corresponding time period using addrmf. An average response file is needed becuase a spectral fit using the pre-slew DRM will introduce some errors in both a spectral shape and a normalization if the PHA file contains a lot of the slew/post-slew time interval.
- 3) For fits to more complicated models (e.g. a power-law over a cutoff power-law), the BAT team has decided to require a chi-square improvement of more than 6 for each extra dof.
Time averaged spectrum fit using the average DRM
Power-law model
Time interval is from  -21.620 sec. to  127.424 sec.

Spectral model in power-law:
------------------------------------------------------------
Parameters  : value       lower 90%   higher 90%
Photon index: -1.52493     ( -0.0370114   0.0370307 )
Norm@50keV  : 1.94554E-02    ( -0.000368632   0.000368495 )
------------------------------------------------------------
#Fit statistic : Chi-Squared =          37.10 using 59 PHA bins.
# Reduced chi-squared =         0.6509 for     57 degrees of freedom
# Null hypothesis probability =   9.809880e-01

Photon flux (15-150 keV)    in 149 sec: 2.44551 ( -0.05497  0.0552 ) ph/cm2/s
Energy fluence (15-150 keV)             : 2.73953e-05 ( -5.25375e-07  5.25408e-07 ) ergs/cm2
Cutoff power-law model
Time interval is from  -21.620 sec. to  127.424 sec.
Spectral model in the cutoff power-law:
------------------------------------------------------------
Parameters  : value       lower 90%   higher 90%
Photon index: -1.52348     ( -0.0362971   0.0384429 )
Epeak [keV] : 9999.36      ( -9999.36 -9999.36 )
Norm@50keV  : 1.94840E-02    ( -0.000367567   0.00173075 )
------------------------------------------------------------
#Fit statistic : Chi-Squared =          37.18 using 59 PHA bins.
# Reduced chi-squared =         0.6639 for     56 degrees of freedom
# Null hypothesis probability =   9.752480e-01

Photon flux (15-150 keV)    in 149 sec: 1.69508 ( -0.09988  0.07489 ) ph/cm2/s
Energy fluence (15-150 keV)             : 2.74933e-05 ( -6.28367e-07  4.22224e-07 ) ergs/cm2
1-s peak spectrum fit
Power-law model

Time interval is from   -0.132 sec. to    0.868 sec.

Spectral model in power-law:
------------------------------------------------------------
Parameters  : value       lower 90%   higher 90%
Photon index: -1.42029     ( -0.15749   0.154429 )
Norm@50keV  : 7.96116E-02    ( -0.00698165   0.00693836 )
------------------------------------------------------------
#Fit statistic : Chi-Squared =          47.83 using 59 PHA bins.
# Reduced chi-squared =         0.8391 for     57 degrees of freedom
# Null hypothesis probability =   8.013330e-01

Photon flux (15-150 keV)    in 1 sec: 9.74097 ( -0.83903  0.84003 ) ph/cm2/s
Energy fluence (15-150 keV)             : 7.66231e-07 ( -7.56574e-08  7.62498e-08 ) ergs/cm2
Cutoff power-law model
Time interval is from   -0.132 sec. to    0.868 sec.
Spectral model in the cutoff power-law:
------------------------------------------------------------
Parameters  : value       lower 90%   higher 90%
Photon index: -1.41689     ( -0.158928   0.265441 )
Epeak [keV] : 9999.34      ( -9999.36 -9999.36 )
Norm@50keV  : 7.98899E-02    ( -0.0798873   0.0284156 )
------------------------------------------------------------
#Fit statistic : Chi-Squared =          47.85 using 59 PHA bins.
# Reduced chi-squared =         0.8545 for     56 degrees of freedom
# Null hypothesis probability =   7.724016e-01

Photon flux (15-150 keV)    in 1 sec: 4.71434 ( -1.32537  1.31697 ) ph/cm2/s
Energy fluence (15-150 keV)             : 0 ( 0  0 ) ergs/cm2
Time-resolved spectra
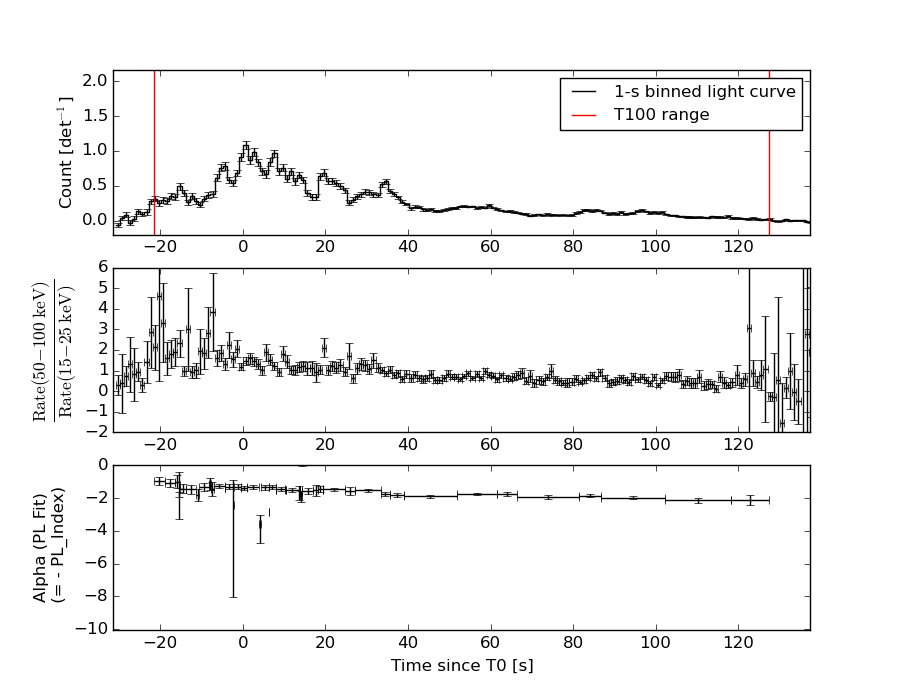
Distribution
T90 vs. Hardness ratio plot
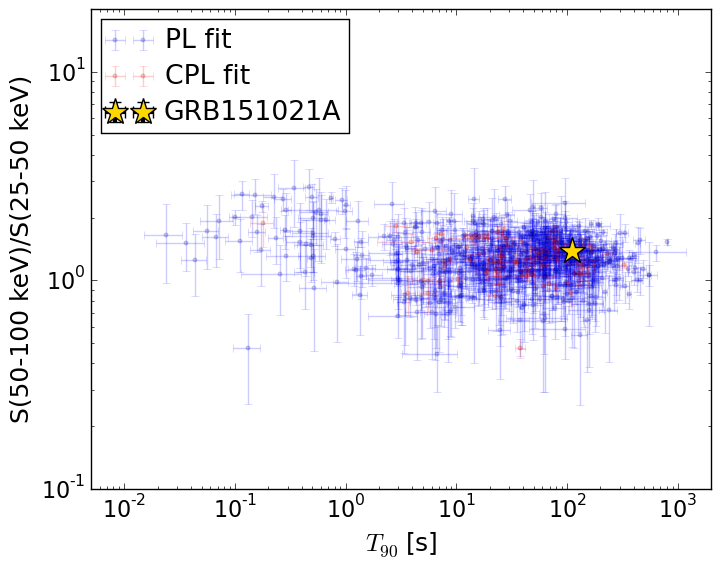
T90                                   = 110.056 sec.
Hardness ratio (energy fluence ratio) = 1.39001640575
S(15-50 keV) vs. S(50-150 keV) plot
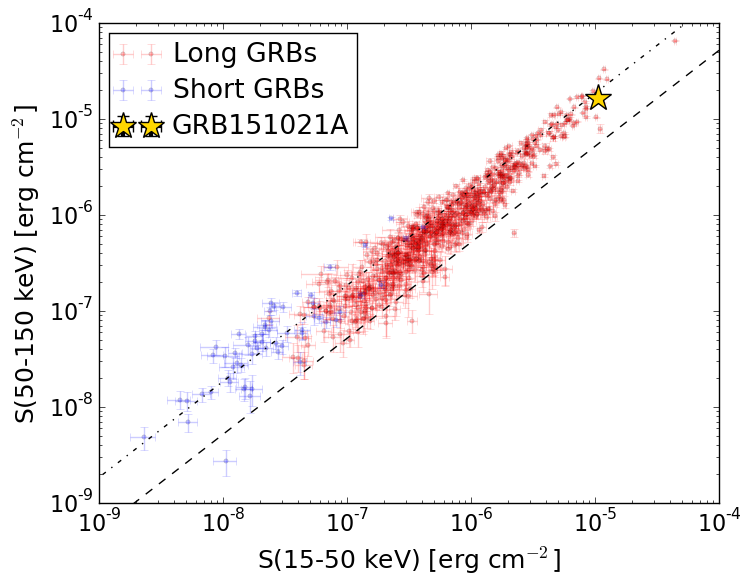
S(15-50 keV)  = 1.0646451e-05
S(50-150 keV) = 1.6748489e-05
The dash-dotted line and the dashed line traces the fluences calculated from the Band function with Epeak = 15 and 150 keV, respectively. Both lines assume a canonical values of alpha = -1 and beta = -2.5.
Mask shadow pattern
IMX = 7.560019176857721E-01, IMY = -5.817320087857388E-01
Spacecraft aspect plot
Bright source in the pre-burst/pre-slew/post-slew images
Pre-burst image of 15-350 keV band
Time interval of the image:
-239.872000 -21.620000

# RAcent  DECcent POSerr Theta    Phi  PeakCts   SNR AngSep     Name
#  [deg]    [deg]    ['] [deg]  [deg]                   [']
264.9099 -44.4855    5.5  52.5  -39.8  -1.9910  -2.1    7.5	4U 1735-44
  1.7972 -39.1271    2.6  34.4   66.7   1.8133   4.5 ------	UNKNOWN
343.8240 -35.6354    2.9  40.1   44.2   1.9290   4.1 ------	UNKNOWN
 94.0575 -32.3076    2.5  56.9  173.8   5.6401   4.7 ------	UNKNOWN
105.9736 -35.5910    3.3  57.2 -173.8   2.9952   3.5 ------	UNKNOWN
Pre-slew background subtracted image of 15-350 keV band
Time interval of the image:
-21.620000 16.828600

# RAcent  DECcent POSerr Theta    Phi  PeakCts   SNR AngSep     Name
#  [deg]    [deg]    ['] [deg]  [deg]                   [']
264.6746 -44.4019    4.8  52.6  -39.9   1.0241   2.4    4.1	4U 1735-44
337.6473 -33.1889    0.4  43.6   37.6  22.7168  32.6 ------	UNKNOWN
322.5658 -28.8344    3.1  51.3   22.2   4.3124   3.7 ------	UNKNOWN
270.5725 -44.3638    3.2  51.2  -34.9   0.9884   3.7 ------	UNKNOWN
146.6341 -53.2562    2.3  49.8 -133.0   2.0714   4.9 ------	UNKNOWN
Post-slew image of 15-350 keV band
Time interval of the image:
79.828600 362.388000

# RAcent  DECcent POSerr Theta    Phi  PeakCts   SNR AngSep     Name
#  [deg]    [deg]    ['] [deg]  [deg]                   [']
335.2506  15.2399    3.2  48.5   32.4  25.4987   3.6 ------	UNKNOWN
 36.3615 -50.5473    3.0  45.7  166.1  14.0846   3.9 ------	UNKNOWN
 55.8931 -55.3067    2.2  56.8  173.7  60.4724   5.3 ------	UNKNOWN
326.0215 -12.1229    3.8  23.6    6.1   5.4314   3.0 ------	UNKNOWN
 72.7684 -75.3051    2.9  59.3 -161.6  43.8263   4.0 ------	UNKNOWN
287.7540 -74.9248    2.4  48.0 -129.0  33.0735   4.7 ------	UNKNOWN
286.0252 -52.6279    3.6  41.3  -98.5  20.1053   3.2 ------	UNKNOWN