Analysis Summary
Notes:
- 1) No attempt has been made to eliminate the non-significant decimal places.
- 2) This batgrbproduct analysis is done using the HEASARC data.
- 3) This batgrbproduct analysis is using the flight position for the mask-weighting calculation.
======================================================================
BAT GRB EVENT DATA PROCESSING REPORT
Process Script Ver: batgrbproduct v2.46
Process Start Time: Mon Nov 16 01:18:01 EST 2015
Host Name: bat1
Current Working Dir: /local/data/bat1/alien/Swift_3rdBATcatalog/event/batevent_reproc/trigger661253
======================================================================
Trigger: 00661253 Segment: 000
BAT Trigger Time: 467300600.128 [s; MET]
Trigger Stop: 467300601.152 [s; MET]
UTC: 2015-10-23T13:43:04.815600 [includes UTCF correction]
Where From?: TDRSS position message
BAT
RA: 271.019585617029 Dec: -8.3228306705058 [deg; J2000]
Catalogged Source?: NO
Point Source?: YES
GRB Indicated?: YES [ by BAT flight software ]
Image S/N Ratio: 8.49
Image Trigger?: NO
Rate S/N Ratio: 16.7332005306815 [ if not an image trigger ]
Image S/N Ratio: 8.49
Analysis Position: [ source = BAT ]
RA: 271.019585617029 Dec: -8.3228306705058 [deg; J2000]
Refined Position: [ source = BAT pre-slew burst ]
RA: 271.012509797461 Dec: -8.29311895355627 [deg; J2000]
{ 18h 04m 03.0s , -08d 17' 35.2" }
+/- 1.73990935619316 [arcmin] (estimated 90% radius based on SNR)
+/- 0.676165626112087 [arcmin] (formal 1-sigma fit error)
SNR: 13.788242656085
Angular difference between the analysis and refined position is 1.831532 arcmin
Partial Coding Fraction: 0.8359375 [ including projection effects ]
Duration
T90: 10.7599999308586 +/- 4.3722653107991
Measured from: -0.527999997138977
to: 10.2319999337196 [s; relative to TRIGTIME]
T50: 3.23599994182587 +/- 1.22536527753205
Measured from: 0.451999962329865
to: 3.68799990415573 [s; relative to TRIGTIME]
Fluence
Peak Flux (peak 1 second)
Measured from: 0.236000001430511
to: 1.23600000143051 [s; relative to TRIGTIME]
Total Fluence
Measured from: -0.984000027179718
to: 12.1639999747276 [s; relative to TRIGTIME]
Band 1 Band 2 Band 3 Band 4
15-25 25-50 50-100 100-350 keV
Total 0.222541 0.230564 0.085569 0.008733
0.023553 0.021281 0.017556 0.015000 [error]
Peak 0.054572 0.042738 0.024318 0.009152
0.007010 0.006359 0.005290 0.004138 [error]
[ fluence units of on-axis counts / fully illuminated detector ]
======================================================================
====== Table of the duration information =============================
Value tstart tstop
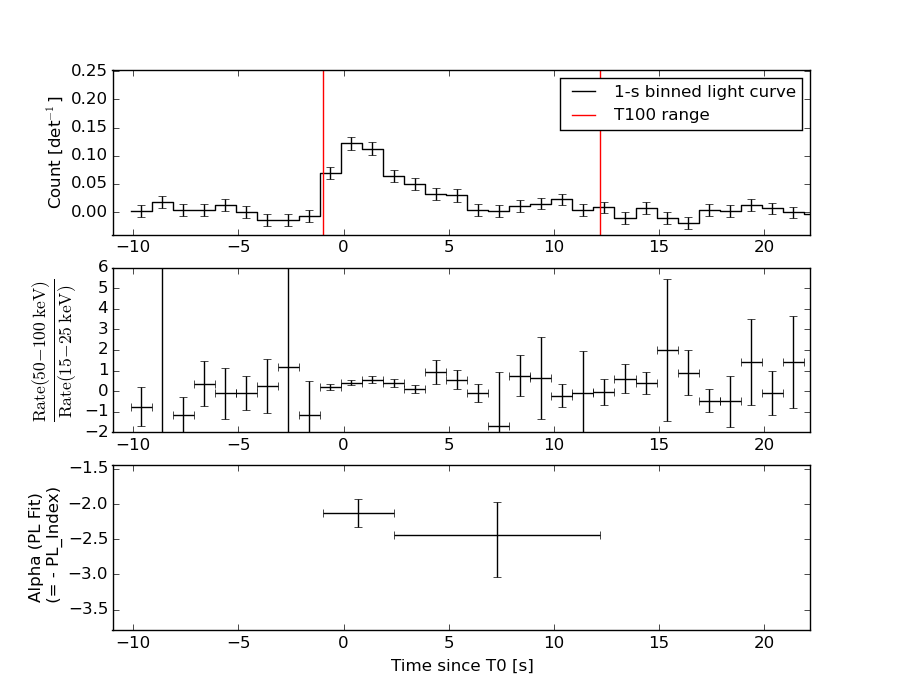
T100 13.148 -0.984 12.164
T90 10.760 -0.528 10.232
T50 3.236 0.452 3.688
Peak 1.000 0.236 1.236
====== Spectral Analysis Summary =====================================
Model : spectral model: simple power-law (PL) and cutoff power-law (CPL)
Ph_index : photon index: E^{Ph_index}
Ph_90err : 90% error of the photon index
Epeak : Epeak in keV
Epeak_90err: 90% error of Epeak
Norm : normalization at 50 keV in both the PL model and CPL model
Nomr_90err : 90% error of the normalization
chi2 : Chi-Squared
dof : degree of freedo
=== Time-averaged spectral analysis ===
(Best model with acceptable fit: PL)
Model Ph_index Ph_90err_low Ph_90err_hi Epeak Epeak_90err_low Epeak_90err_hi Norm Nomr_90err_low Norm_90err_hi chi2 dof
PL -2.254 -0.239 0.222 - - - 2.13e-03 -3.46e-04 3.39e-04 56.250 57
CPL -1.363 -0.789 1.282 27.306 N/A N/A 7.40e-03 N/A N/A 53.990 56
=== 1-s peak spectral analysis ===
(Best model with acceptable fit: PL)
Model Ph_index Ph_90err_low Ph_90err_hi Epeak Epeak_90err_low Epeak_90err_hi Norm Nomr_90err_low Norm_90err_hi chi2 dof
PL -2.040 -0.346 0.317 - - - 6.82e-03 -1.42e-03 1.34e-03 58.480 57
CPL -2.062 -0.519 0.200 29.925 N/A N/A 6.14e-03 N/A N/A 58.000 56
=== Fluence/Peak Flux Summary ===
Model Band1 Band2 Band3 Band4 Band5 Total
15-25 25-50 50-100 100-350 15-150 15-350 keV
Fluence PL 7.30e-08 8.51e-08 7.14e-08 1.01e-07 2.66e-07 3.31e-07 erg/cm2
90%_error_low -1.10e-08 -1.00e-08 -1.55e-08 -3.70e-08 -3.58e-08 -5.83e-08 erg/cm2
90%_error_hi 1.13e-08 9.95e-09 1.62e-08 4.96e-08 3.68e-08 6.75e-08 erg/cm2
Peak flux PL 4.73e-01 3.46e-01 1.68e-01 1.16e-01 1.04e+00 1.10e+00 ph/cm2/s
90%_error_low -1.08e-01 -5.16e-02 -4.63e-02 -5.27e-02 -1.56e-01 -1.65e-01 ph/cm2/s
90%_error_hi 1.13e-01 5.16e-02 4.71e-02 7.53e-02 1.56e-01 1.65e-01 ph/cm2/s
Fluence CPL 6.90e-08 9.35e-08 6.40e-08 2.25e-08 2.43e-07 2.49e-07 erg/cm2
90%_error_low -1.24e-08 N/A -2.09e-08 -1.85e-08 -3.83e-08 -4.38e-08 erg/cm2
90%_error_hi 1.23e-08 N/A 1.95e-08 7.83e-08 4.37e-08 9.23e-08 erg/cm2
Peak flux CPL 4.48e-01 2.54e-01 1.52e-01 1.21e-01 9.66e-01 1.04e+00 ph/cm2/s
90%_error_low -1.13e-01 -1.34e-01 N/A -1.21e-01 N/A -4.93e-01 ph/cm2/s
90%_error_hi 1.60e-01 1.19e-01 N/A 3.01e-02 N/A 1.41e-01 ph/cm2/s
======================================================================
Image
Pre-slew 15.0-350.0 keV image (Event data)
#   RAcent    DECcent   POSerr    Theta     Phi              Peak Cts       SNR   Name
  271.0125    -8.2931   0.0139    18.0224   133.0387         0.5888895     13.788 TRIG_00661253

Foreground time interval of the image:
 -0.984  12.164 (delta_t =  13.148 [sec])
Background time interval of the image:
-250.227  -0.984 (delta_t = 249.243 [sec])
Light Curves
Note: The mask-weighted lightcurves have units of either count/det or counts/sec/det, where a det is 0.4 x 0.4 = 0.16 sq cm.
Full-time range; 1 s binning
Other quick-look light curves:
- 64 ms binning (zoomed)
- 16 ms binning (zoomed)
- 8 ms binning (zoomed)
- 2 ms binning (zoomed)
- SN=5 or 10 s binning (full-time range)
- Raw light curve
Spectra
- 64 ms binning (zoomed)
- 16 ms binning (zoomed)
- 8 ms binning (zoomed)
- 2 ms binning (zoomed)
- SN=5 or 10 s binning (full-time range)
- Raw light curve
Spectra
Notes:
- 1) The fitting includes the systematic errors.
- 2) When the burst includes telescope slew time periods, the fitting uses an average response file made from multiple 5-s response files through out the slew time plus single time preiod for the non-slew times, and weighted by the total counts in the corresponding time period using addrmf. An average response file is needed becuase a spectral fit using the pre-slew DRM will introduce some errors in both a spectral shape and a normalization if the PHA file contains a lot of the slew/post-slew time interval.
- 3) For fits to more complicated models (e.g. a power-law over a cutoff power-law), the BAT team has decided to require a chi-square improvement of more than 6 for each extra dof.
Time averaged spectrum fit using the average DRM
Power-law model
Time interval is from   -0.984 sec. to   12.164 sec.

Spectral model in power-law:
------------------------------------------------------------
Parameters  : value       lower 90%   higher 90%
Photon index: -2.25372     ( -0.238941   0.222453 )
Norm@50keV  : 2.13222E-03    ( -0.000346467   0.000339462 )
------------------------------------------------------------
#Fit statistic : Chi-Squared =          56.25 using 59 PHA bins.
# Reduced chi-squared =         0.9869 for     57 degrees of freedom
# Null hypothesis probability =   5.030606e-01

Photon flux (15-150 keV)    in 13.15 sec: 0.363308 ( -0.040989  0.041001 ) ph/cm2/s
Energy fluence (15-150 keV)             : 2.65843e-07 ( -3.57752e-08  3.67827e-08 ) ergs/cm2
Cutoff power-law model
Time interval is from   -0.984 sec. to   12.164 sec.
Spectral model in the cutoff power-law:
------------------------------------------------------------
Parameters  : value       lower 90%   higher 90%
Photon index: -1.36334     ( -0.789284   1.28187 )
Epeak [keV] : 27.3063      (   )
Norm@50keV  : 7.39775E-03    (     )
------------------------------------------------------------
#Fit statistic : Chi-Squared =          53.99 using 59 PHA bins.
# Reduced chi-squared =         0.9641 for     56 degrees of freedom
# Null hypothesis probability =   5.513589e-01

Photon flux (15-150 keV)    in 13.15 sec: 0.351295 ( -0.042717  0.042953 ) ph/cm2/s
Energy fluence (15-150 keV)             : 2.42754e-07 ( -3.82954e-08  4.36739e-08 ) ergs/cm2
1-s peak spectrum fit
Power-law model
Time interval is from    0.236 sec. to    1.236 sec.

Spectral model in power-law:
------------------------------------------------------------
Parameters  : value       lower 90%   higher 90%
Photon index: -2.04033     ( -0.346018   0.317234 )
Norm@50keV  : 6.81711E-03    ( -0.00141991   0.00133567 )
------------------------------------------------------------
#Fit statistic : Chi-Squared =          58.48 using 59 PHA bins.
# Reduced chi-squared =          1.026 for     57 degrees of freedom
# Null hypothesis probability =   4.207775e-01

Photon flux (15-150 keV)    in 1 sec: 1.04208 ( -0.156199  0.15633 ) ph/cm2/s
Energy fluence (15-150 keV)             : 6.30347e-08 ( -1.15759e-08  1.19444e-08 ) ergs/cm2
Cutoff power-law model
Time interval is from    0.236 sec. to    1.236 sec.
Spectral model in the cutoff power-law:
------------------------------------------------------------
Parameters  : value       lower 90%   higher 90%
Photon index: -2.36627     ( 0   0.718871 )
Epeak [keV] : 137.497      (   )
Norm@50keV  : 4.51184E-03    (     )
------------------------------------------------------------
#Fit statistic : Chi-Squared =          55.89 using 59 PHA bins.
# Reduced chi-squared =         0.9980 for     56 degrees of freedom
# Null hypothesis probability =   4.790081e-01

Photon flux (15-150 keV)    in 1 sec: 0.966006 (    ) ph/cm2/s
Energy fluence (15-150 keV)             : 0 ( 0  0 ) ergs/cm2
Time-resolved spectra
Distribution
T90 vs. Hardness ratio plot
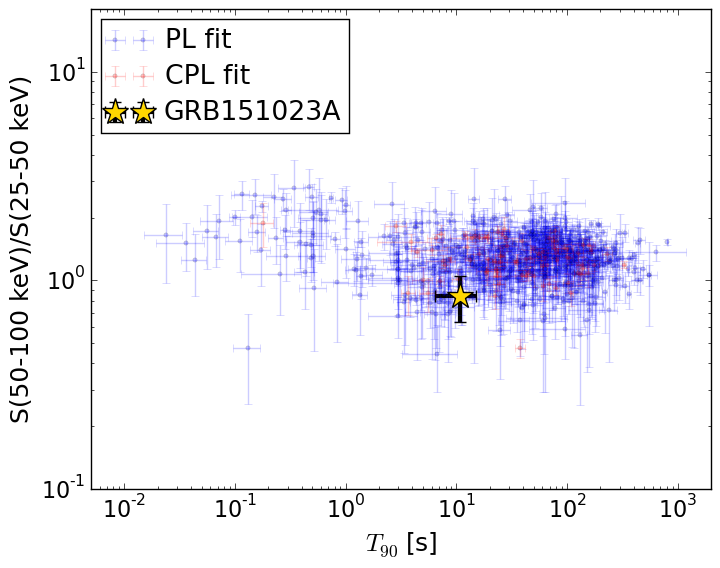
T90                                   = 10.76 sec.
Hardness ratio (energy fluence ratio) = 0.83876447998
S(15-50 keV) vs. S(50-150 keV) plot
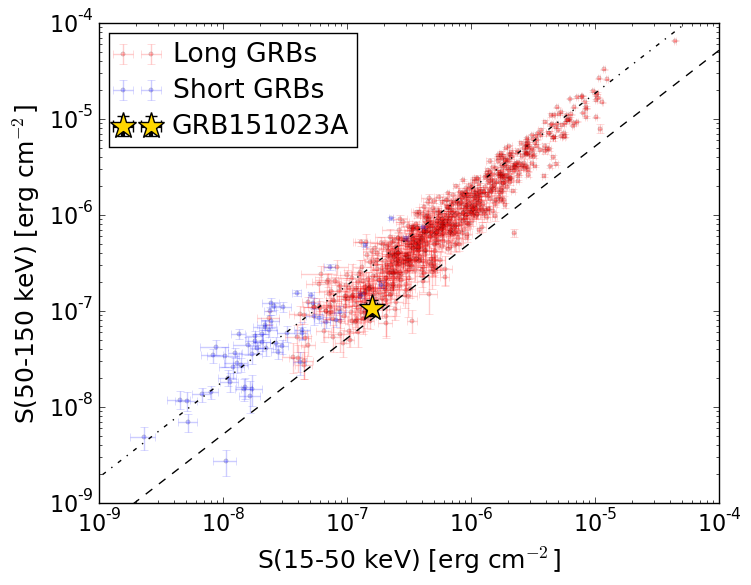
S(15-50 keV)  = 1.5815745e-07
S(50-150 keV) = 1.0768796e-07
The dash-dotted line and the dashed line traces the fluences calculated from the Band function with Epeak = 15 and 150 keV, respectively. Both lines assume a canonical values of alpha = -1 and beta = -2.5.
Mask shadow pattern
IMX = -2.220497500751255E-01, IMY = -2.377966004227701E-01
Spacecraft aspect plot
Bright source in the pre-burst/pre-slew/post-slew images
Pre-burst image of 15-350 keV band
Time interval of the image:
-250.227400 -0.984000

# RAcent  DECcent POSerr Theta    Phi  PeakCts   SNR AngSep     Name
#  [deg]    [deg]    ['] [deg]  [deg]                   [']
244.9836 -15.6358    0.4  18.5 -133.1  11.0989  31.5    0.4	Sco X-1
254.3811  35.3450   18.1  35.3   14.3   0.2845   0.6    3.7	Her X-1
255.9868 -37.8209    1.6  37.9 -166.2   2.8908   7.4    1.4	4U 1700-377
256.5457 -36.4317    2.4  36.5 -167.0   1.7747   4.8    5.4	GX 349+2
263.1716 -24.8571    7.7  26.1  178.0   0.5462   1.5   11.1	GX 1+4
264.6408 -44.5545   29.8  45.4 -174.5  -0.2530  -0.4    7.6	4U 1735-44
268.3521  -1.4794    7.9  13.5  111.6   0.4829   1.5    1.9	SW J1753.5-0127
270.3206 -25.0495    2.8  29.1  165.6   1.5532   4.1    2.7	GX 5-1
270.2116 -25.8267    6.8  29.7  166.7   0.6407   1.7    7.0	GRS 1758-258
274.1051 -13.8469    0.0  23.5  142.1   1.2588   3.4   12.8	GX 17+2
275.8865 -30.5437    6.2  36.5  164.0   0.9773   1.9   10.8	H1820-303
285.1305 -24.7506    8.6  38.3  147.7  -0.8509  -1.3   11.4	HT1900.1-2455
288.8002  10.9400  750.8  35.3   86.0   0.0121   0.0    0.3	GRS 1915+105
263.0964 -33.7618    5.9  34.6 -176.8   0.7639   2.0    6.9	GX 354-0
281.4067 -38.5847    2.6  45.6  166.0   3.4907   4.4 ------	UNKNOWN
264.5482  -9.1463    2.7  13.2  149.3   1.2805   4.3 ------	UNKNOWN
219.2044  29.4217    4.1  45.0  -30.9   1.8317   2.8 ------	UNKNOWN
Pre-slew background subtracted image of 15-350 keV band
Time interval of the image:
-0.984000 12.164000

# RAcent  DECcent POSerr Theta    Phi  PeakCts   SNR AngSep     Name
#  [deg]    [deg]    ['] [deg]  [deg]                   [']
244.8706 -15.8122    0.0  18.7 -133.1   0.0861   2.2   12.1	Sco X-1
254.5506  35.5081    5.4  35.5   14.6  -0.1185  -2.1   10.9	Her X-1
255.7753 -37.7294    0.0  37.8 -165.9  -0.0244  -0.5   12.2	4U 1700-377
256.2417 -36.3439   12.2  36.4 -166.6   0.0470   0.9   10.5	GX 349+2
262.9793 -24.5969    5.4  25.8  178.2   0.0862   2.1    9.1	GX 1+4
264.6885 -44.4118   10.1  45.3 -174.6   0.0812   1.1    3.3	4U 1735-44
268.3379  -1.5679    6.3  13.5  112.0  -0.0725  -1.8    7.1	SW J1753.5-0127
270.1761 -25.2137   53.0  29.2  166.1  -0.0103  -0.2   10.0	GX 5-1
270.4721 -25.7951   65.8  29.8  166.2  -0.0083  -0.2    9.7	GRS 1758-258
274.1051 -13.8469    0.0  23.5  142.1  -0.0686  -1.5   12.8	GX 17+2
275.8081 -30.3943    3.7  36.3  163.9   0.1698   3.1    6.3	H1820-303
285.0672 -24.8918   62.2  38.3  148.0   0.0131   0.2    2.4	HT1900.1-2455
288.8741  10.8353   22.0  35.4   86.2  -0.0525  -0.5    8.0	GRS 1915+105
263.0303 -33.8395    5.9  34.7 -176.7  -0.0911  -1.9    2.1	GX 354-0
283.5989  31.3347    2.1  41.4   53.4   0.6702   5.5 ------	UNKNOWN
271.0125  -8.2931    0.8  18.0  133.0   0.5888  13.8 ------	UNKNOWN
Post-slew image of 15-350 keV band
Time interval of the image:
58.772590 962.959600

# RAcent  DECcent POSerr Theta    Phi  PeakCts   SNR AngSep     Name
#  [deg]    [deg]    ['] [deg]  [deg]                   [']
244.9865 -15.6358    0.3  26.5  -99.8  39.8850  43.2    0.5	Sco X-1
254.3218  35.3718    8.7  46.4  -10.1   1.6773   1.3    6.9	Her X-1
256.0040 -37.8328    1.7  32.5 -148.9   5.1757   7.0    1.1	4U 1700-377
256.4441 -36.4198    1.2  31.1 -148.2   6.7184   9.3    0.5	GX 349+2
263.0923 -24.8607   30.6  18.2 -147.7   0.2665   0.4    8.3	GX 1+4
264.8215 -44.4985    3.9  36.6 -163.8   2.3502   3.0    4.4	4U 1735-44
268.3707  -1.4009   14.2   7.4  -12.1   0.5171   0.8    3.1	SW J1753.5-0127
270.2456 -25.0874    1.6  16.8 -168.9   4.5963   7.2    2.2	GX 5-1
270.2311 -25.7694    2.3  17.5 -168.9   3.2066   5.0    4.2	GRS 1758-258
273.9864 -14.0243    1.7   6.4  161.9   4.4165   6.8    1.3	GX 17+2
275.8007 -30.3557    2.9  22.5  177.9   2.7838   4.0    6.5	H1820-303
285.0648 -24.9896    7.4  21.4  151.6  -1.1561  -1.6    4.4	HT1900.1-2455
288.8141  10.9691    2.4  26.2   51.6   4.4522   4.9    1.7	GRS 1915+105
263.1042 -33.8572    4.9  26.6 -156.4   1.7867   2.4    5.9	GX 354-0
297.4870  35.0651    3.7  50.1   37.2  11.5084   3.1 ------	UNKNOWN
289.0975 -63.4700    4.2  56.7  179.2  14.4543   2.7 ------	UNKNOWN
266.1210  -0.2751    2.5   9.4  -22.6   2.6133   4.5 ------	UNKNOWN
260.3800 -33.5172    2.5  27.0 -151.5   3.0597   4.5 ------	UNKNOWN
244.8563  41.8386    2.9  55.6  -14.7  10.2328   4.0 ------	UNKNOWN
230.5263 -39.9536    2.6  47.9 -129.2  13.7677   4.4 ------	UNKNOWN
229.7104 -17.3933    4.1  41.2  -98.2  10.7274   2.8 ------	UNKNOWN